

Teamgroup may be a name some of you don't immediately recognise but they have been around for over 20 years. The company's T-Force product line covers their high-performance and gaming products. The new flagship SSD of the T-Force line-up is the Cardea Zero Z440 SSD, a drive that sports the latest PCIe Gen4 x4 interface.
Teamgroup's T-Force Cardea Zero Z440 uses a combination of a Phison PS5016-E16 controller (the world's first PCIe Gen 4 controller) and BiCS4 96-layer 3D TLC NAND. At the time of writing, there are only two drives in the T-Force Cardea Zero Z440 line-up, the 1TB drive we are looking at here and a flagship 2TB model.
The official performance figures are the same for both drives. Up to 5,000 MB/s and 4,400MB/s for Sequential read and write respectively while the 4K random rating is up to a very impressive 750,000 IOPS for both reads and writes.
The official endurance figure for the 1TB drive is 1,800TB TBW and the drive is backed with a 5-year warranty.
Physical Specifications:
Usable Capacities: 1TB.
NAND Components: Toshiba BiSC4 96-Layer 3D TLC.
NAND Controller: Phison PS5016-E16.
Cache: 1GB DDR4-2400 (2 x 512MB SK hynix H5AN4G8NBJA).
Interface: PCIe Gen4 x4 / NVMe 1.3.
Form Factor: M.2 2280.
Dimensions: 80.0 x 22.0 x 3.7mm.
Drive Weight: 9g.
Firmware Version: EGFM11.2
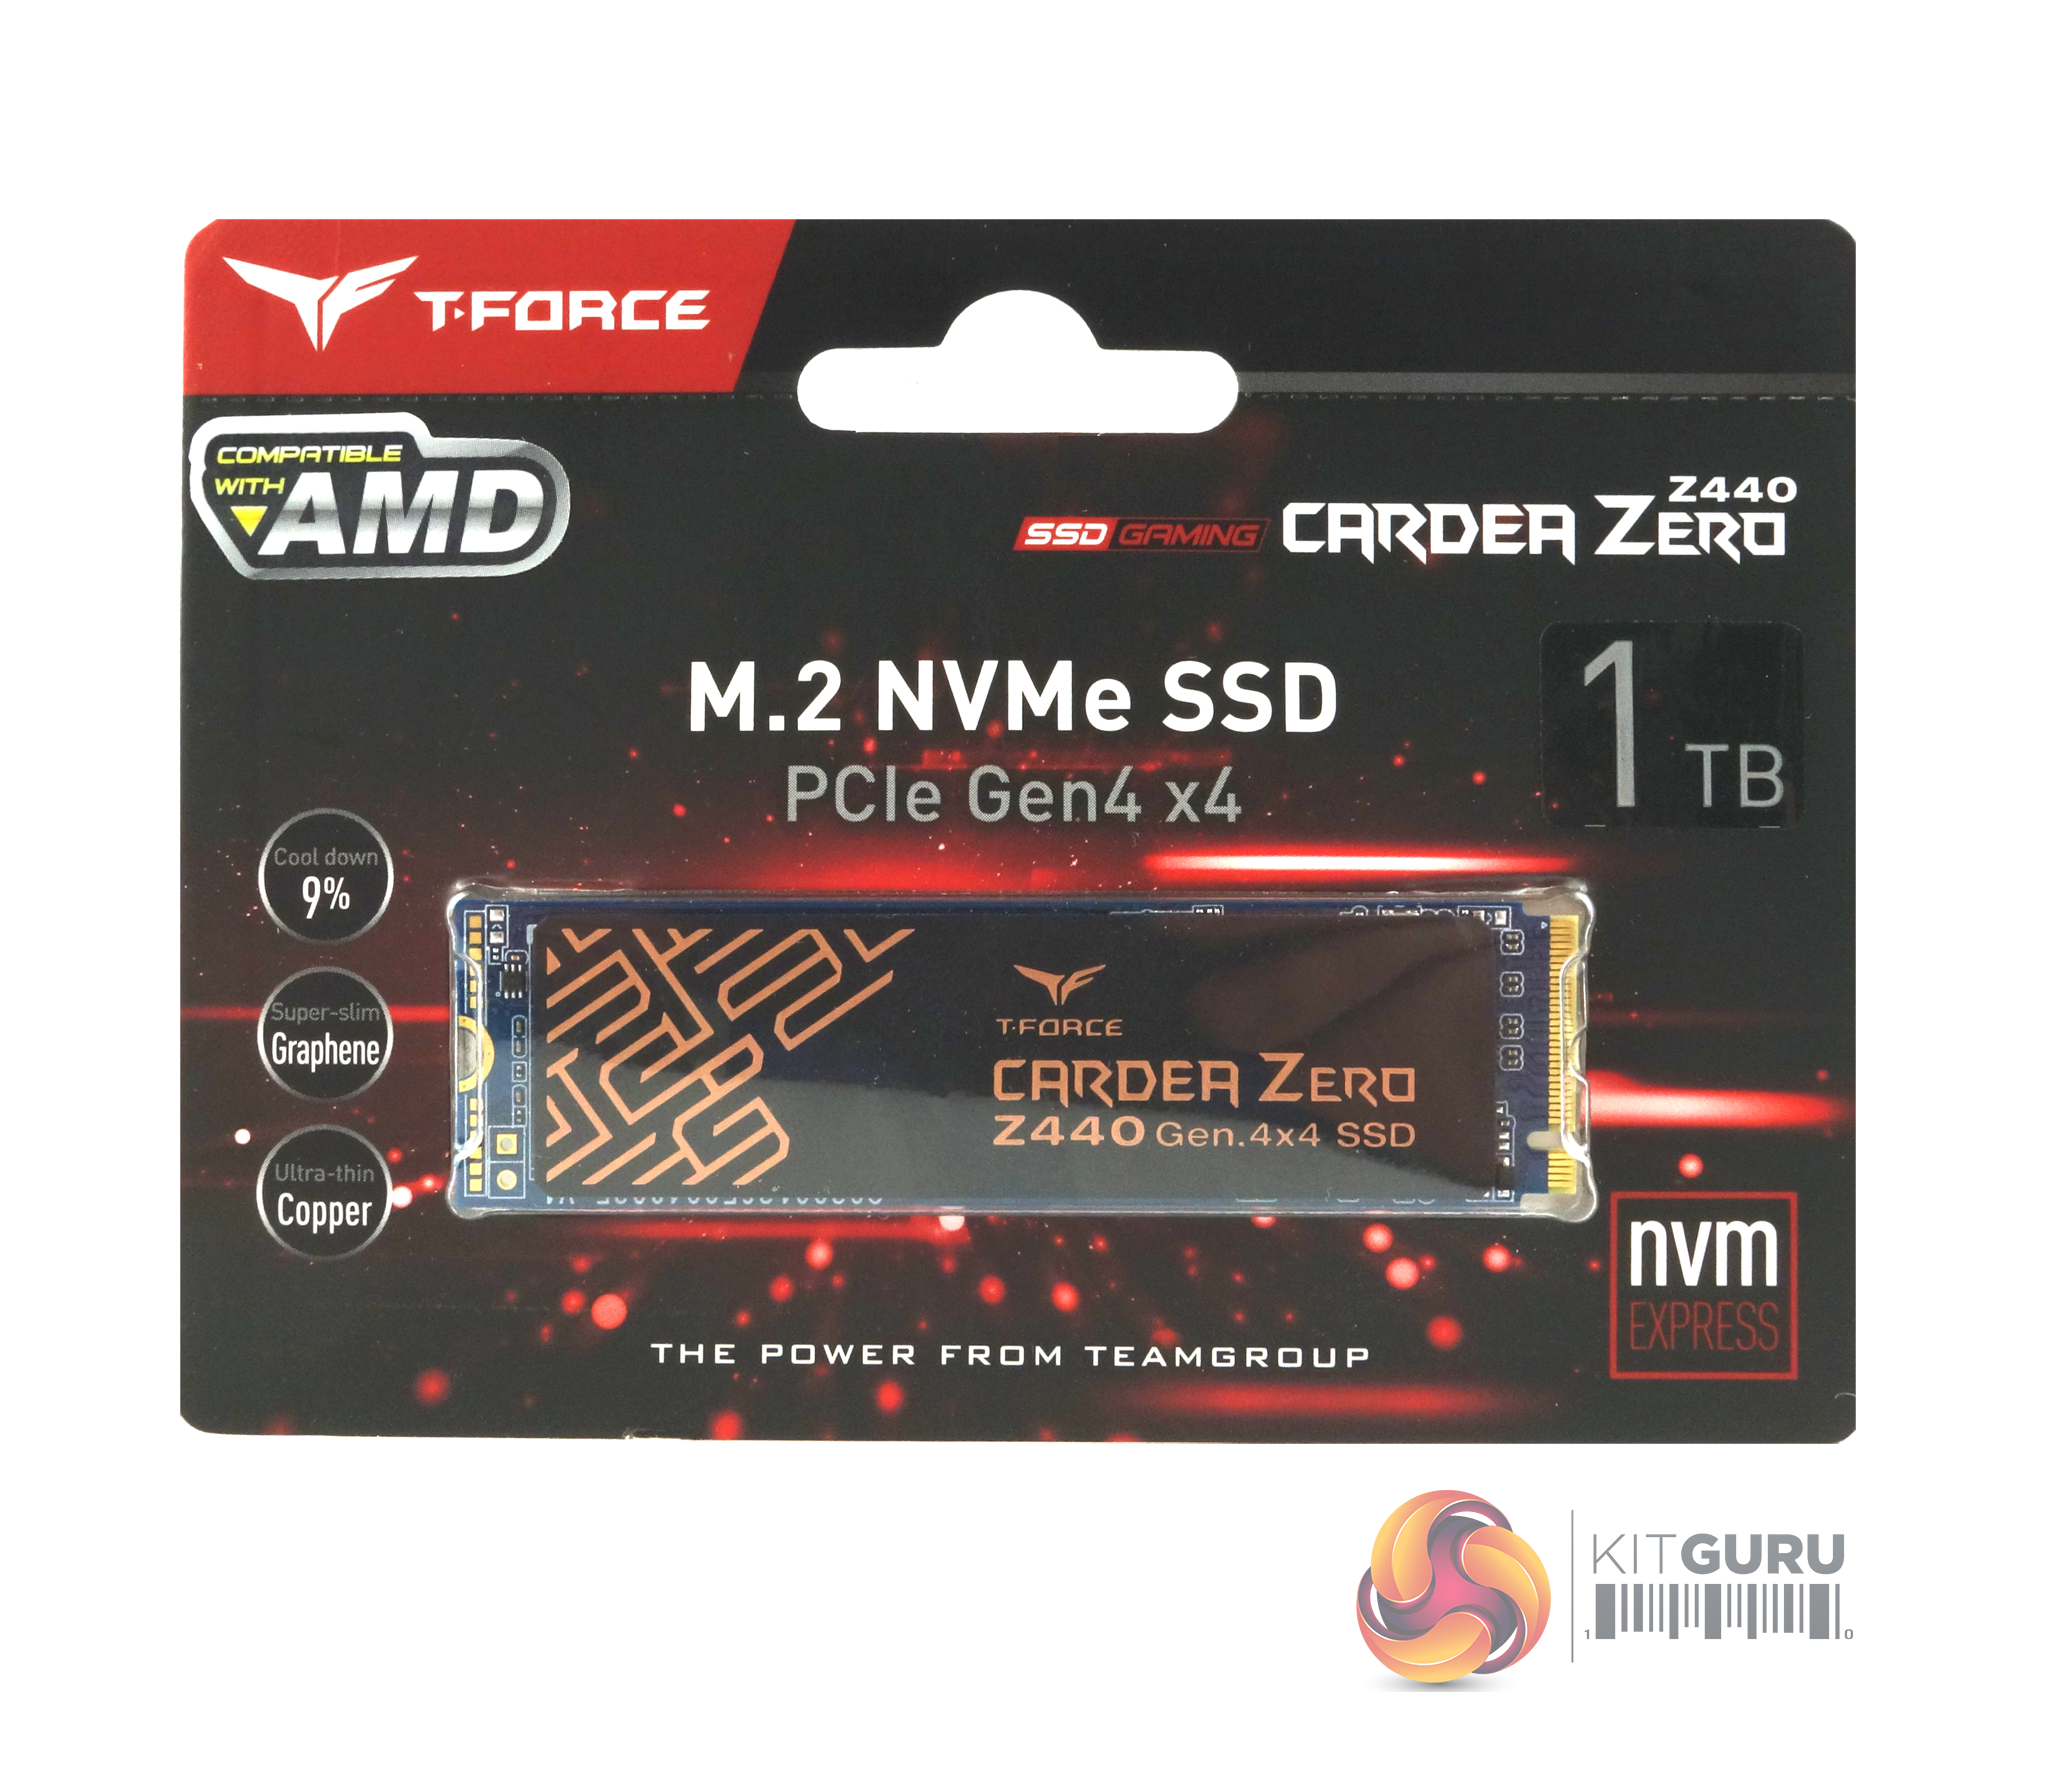
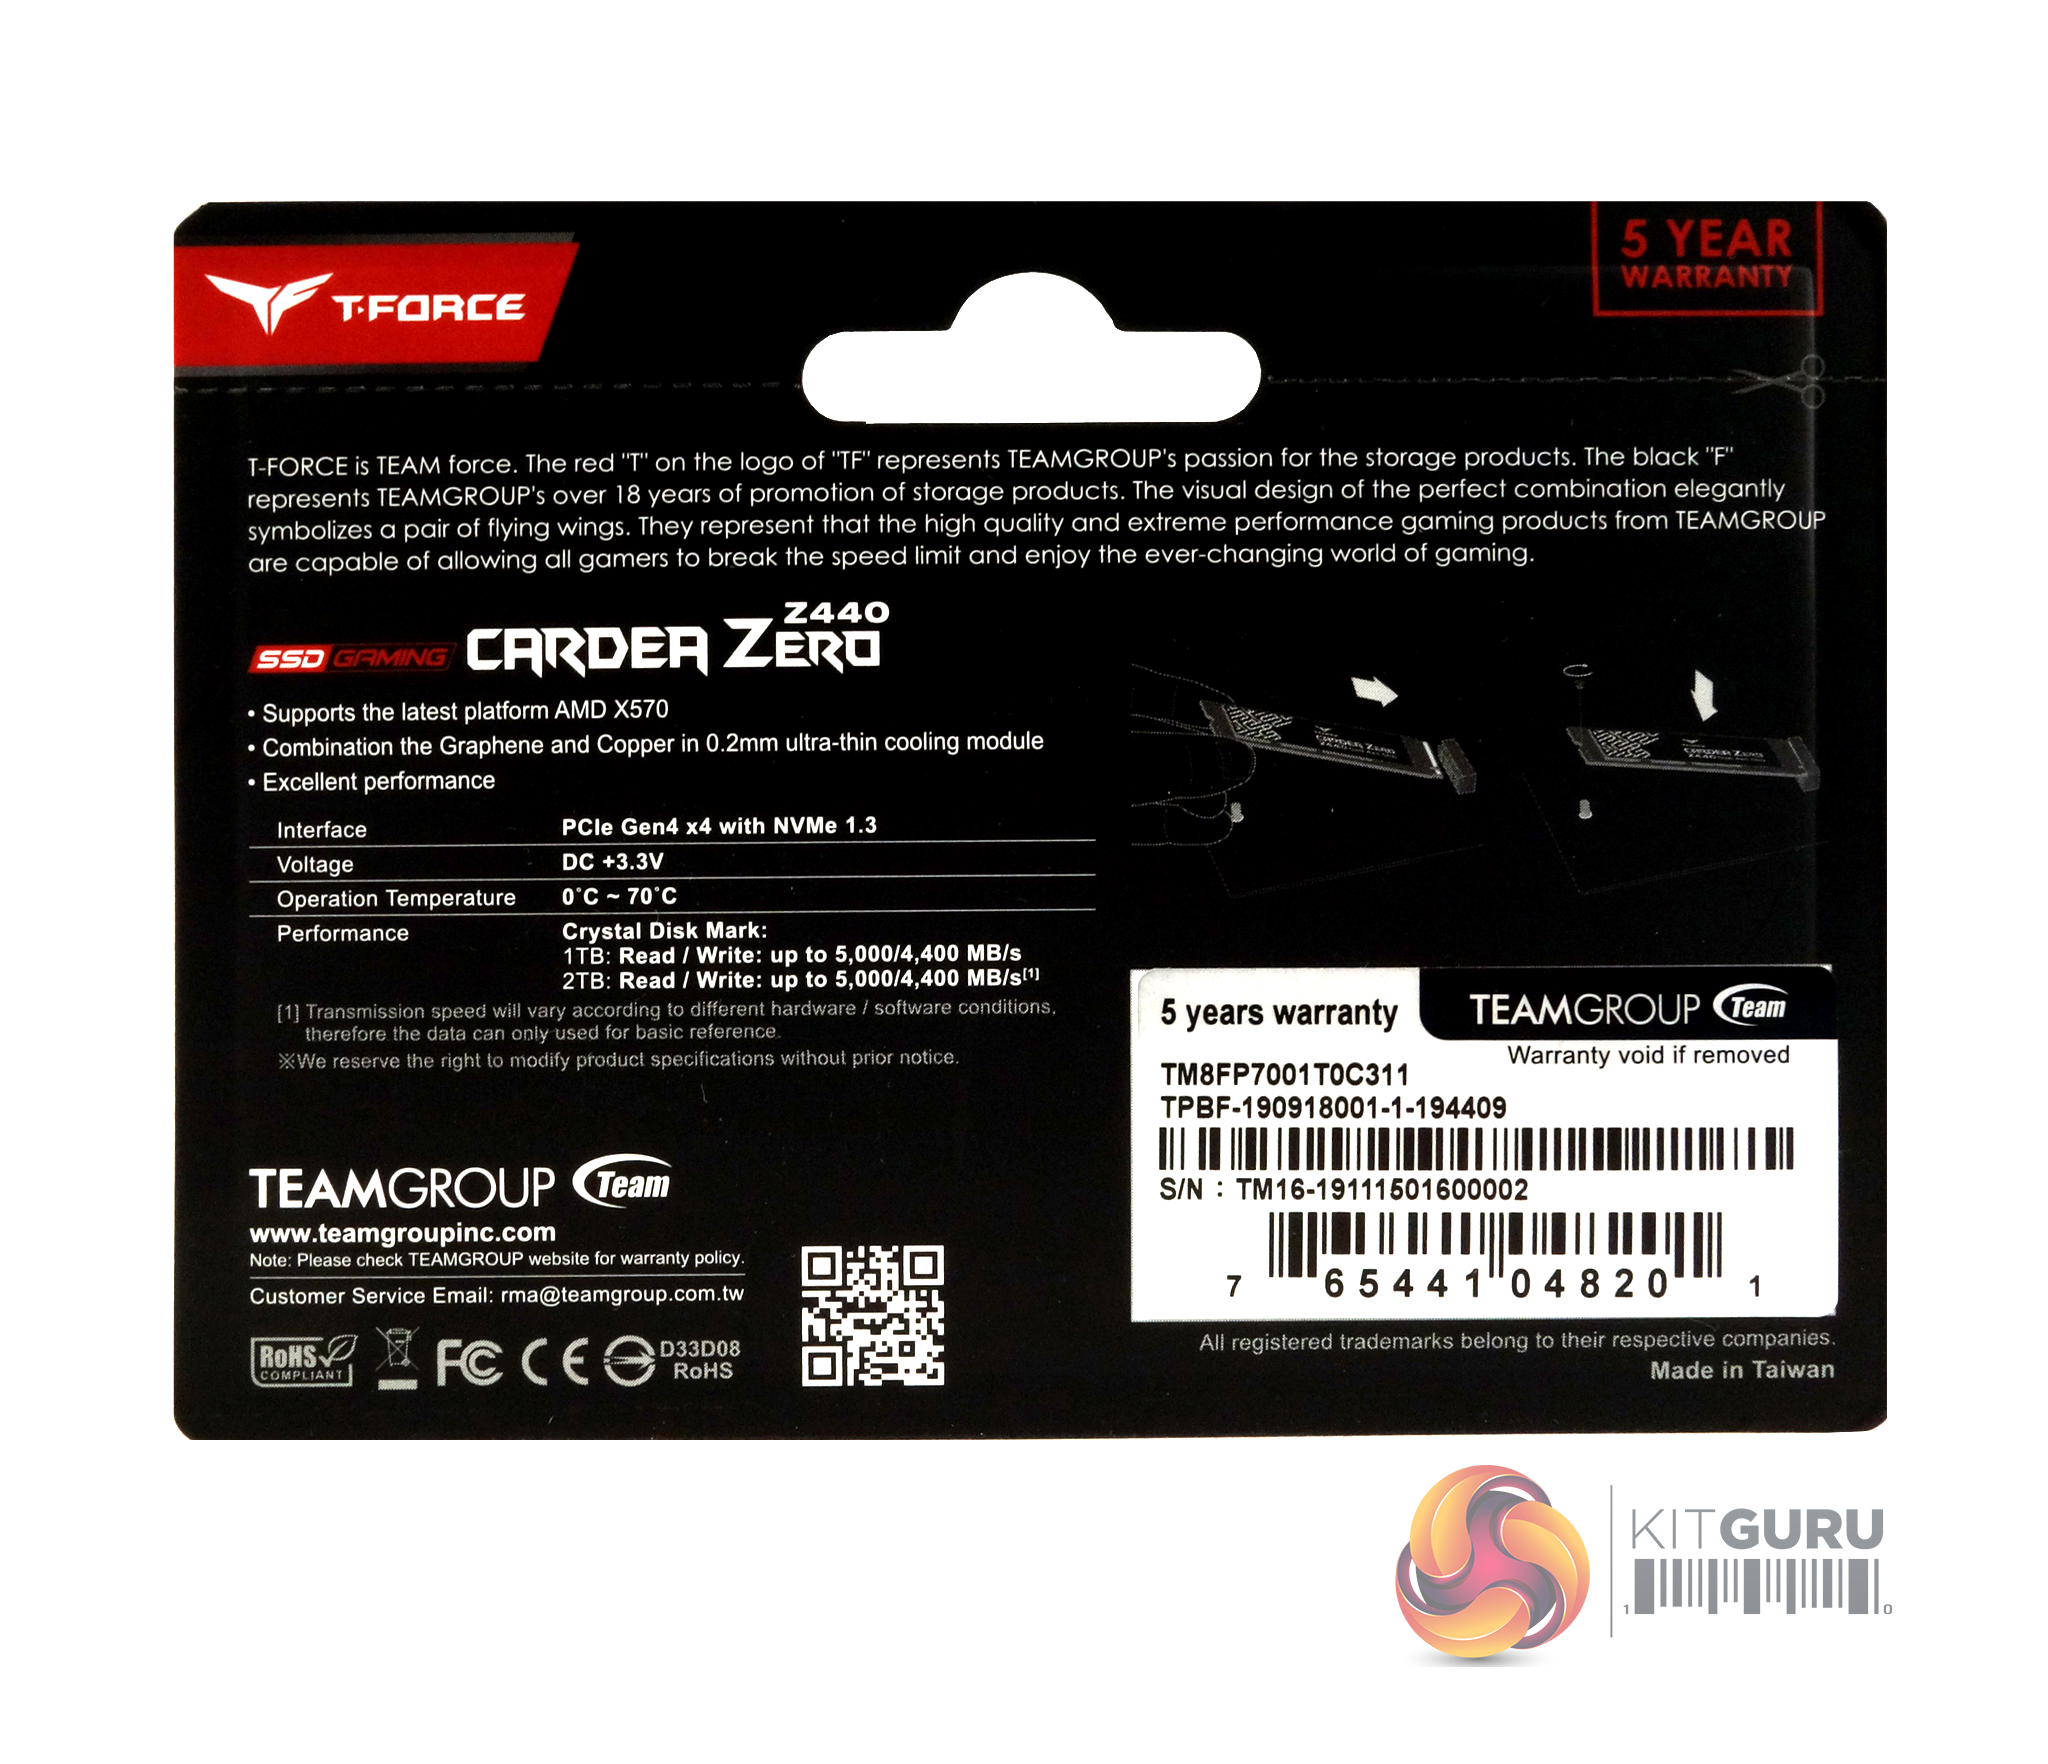
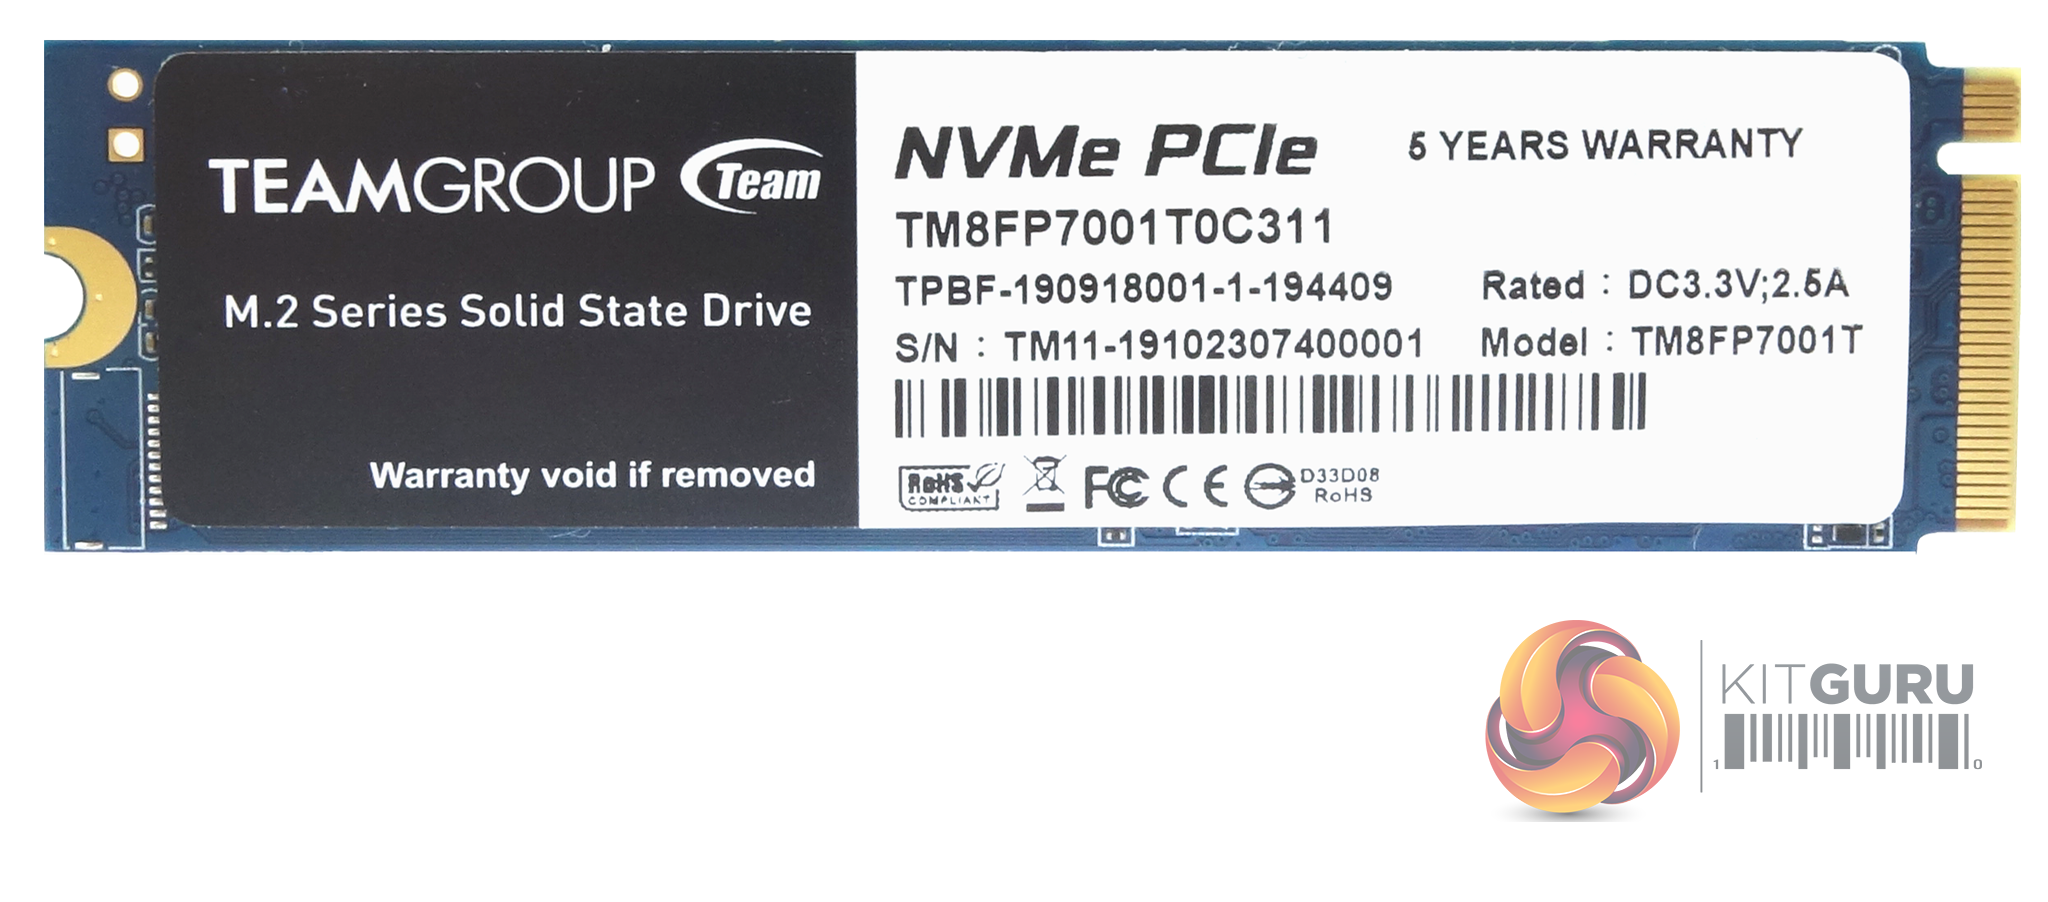
The front of the blister pack that the drive comes in gives you all the information you need about the drive; capacity, the graphene/copper cooling and that it supports NVMe. The rear of the pack has a small drive feature/specs panel and a couple of diagrams showing how to install the drive. Along with the warranty sticker, there is also a reminder that the drive is backed by a five-year warranty.
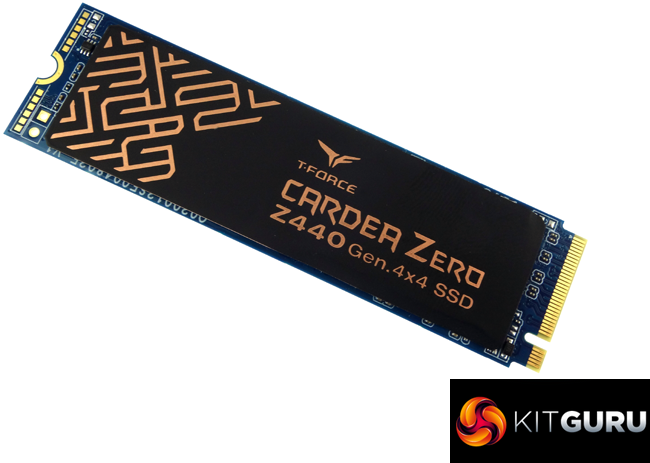
Teamgroup's T-Force Cardea Zero Z440 is built on a double-sided M.2 2280 format. One side holds the Phison PS5016-E16 controller, two 96-layer BiCS4 3D TLC NAND packages (coded TABBG65AWV) and a SKhynix DDR4-2400 DRAM cache (H5AN4G8NBJR-UHC) IC. The other side of the PCB holds another pair of NAND packages and a second DRAM chip.
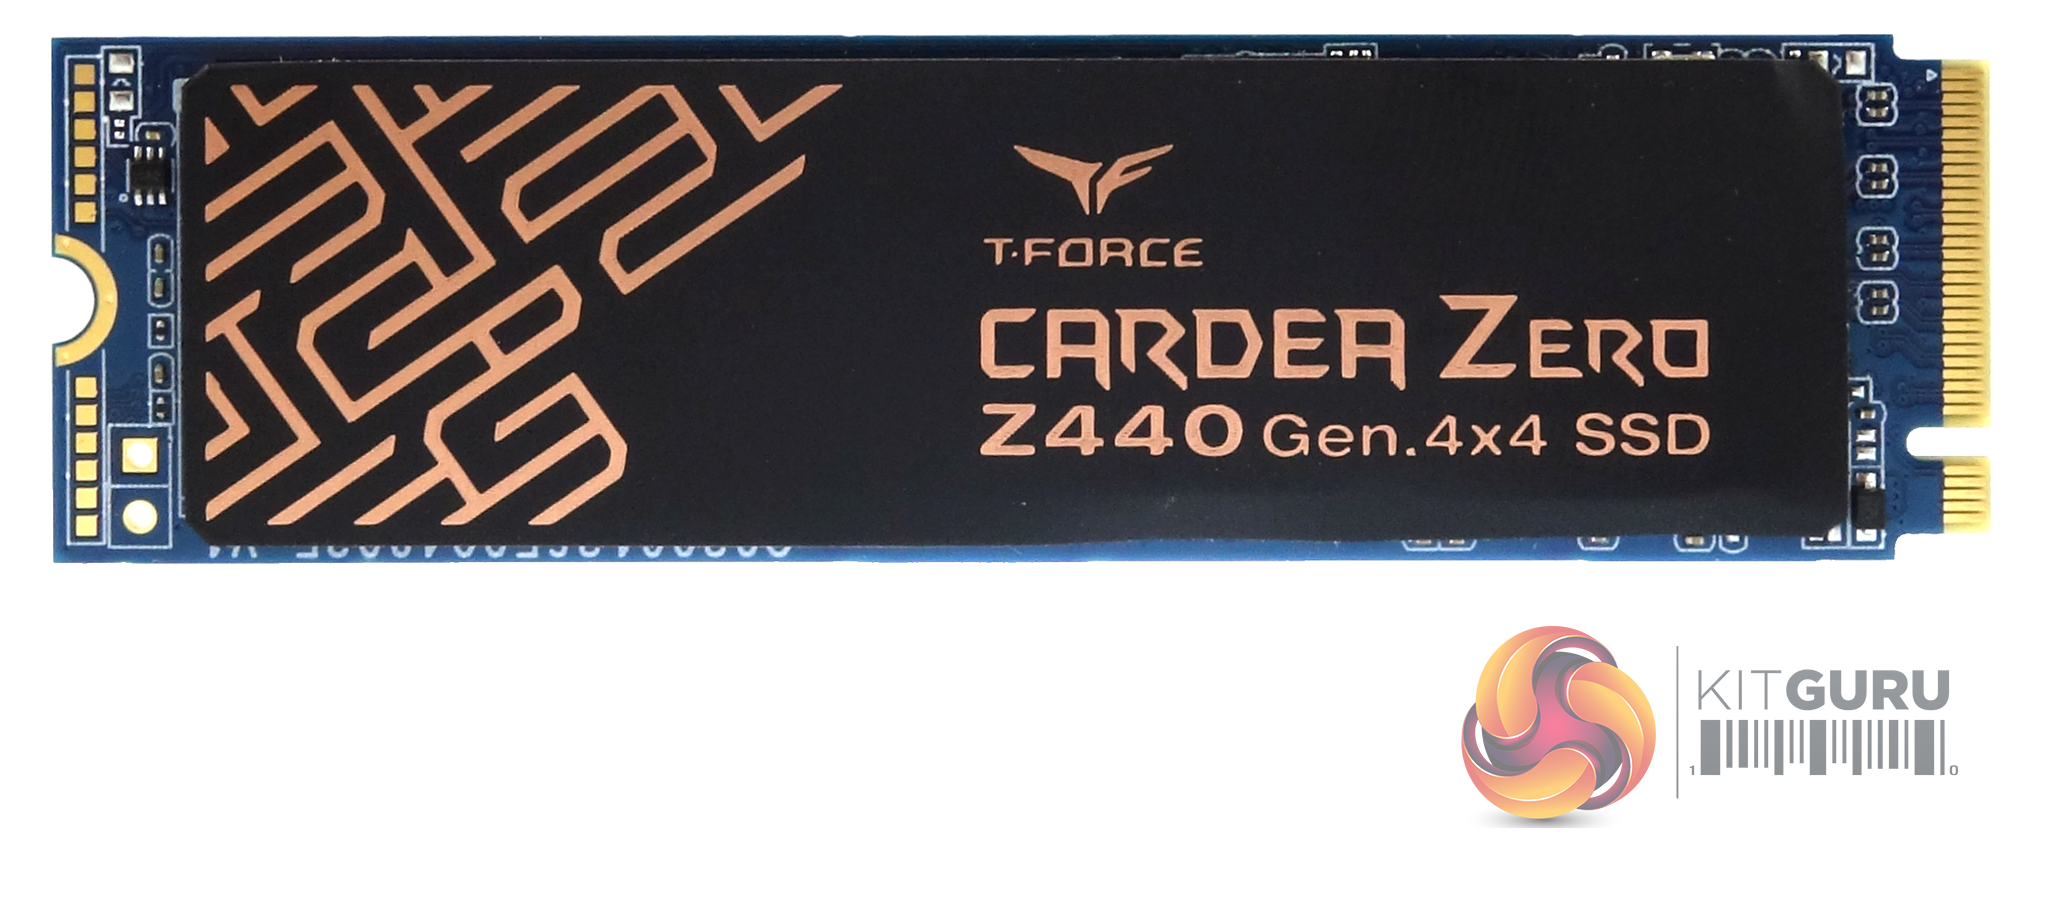
Interestingly the drive doesn't use the large heatsink seen on other PCIe Gen 4 drives but instead, there is a very thin label that incorporates a Teamgroup patented material that combines graphene and copper to keep the drive cool.

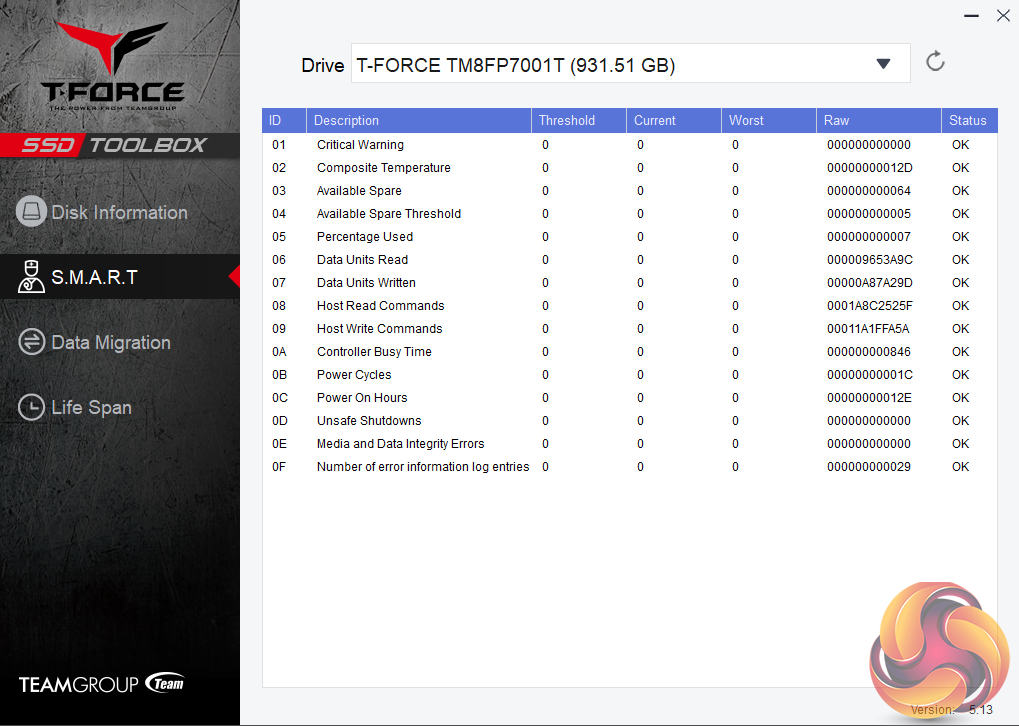
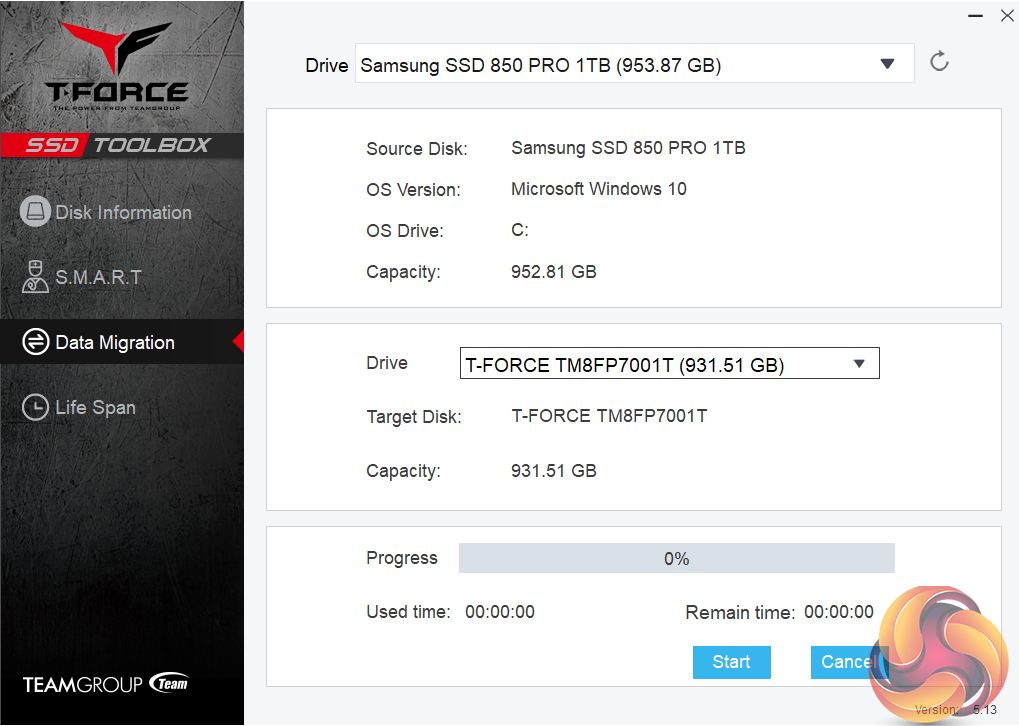
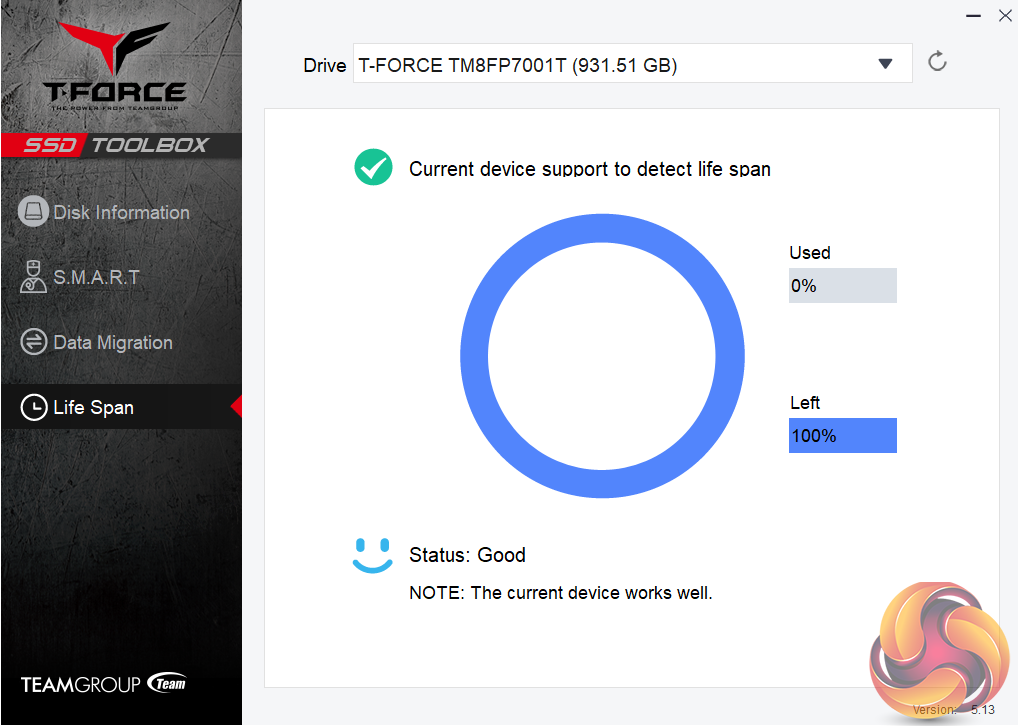
TeamGroup's SSD management utility goes by the name of the T-Force SSD Toolbox. It may not look a complex as some of the competition's offerings at first glance, but all you really need is included. Drive health, temperature and capacity usage are all clearly displayed as is S.M.A.R.T information and drive life span. It even has integrated drive migration software.
For testing, the drives are all wiped and reset to factory settings by HDDerase V4. We try to use free or easily available programs and some real-world testing so you can compare our findings against your own system.
This is a good way to measure potential upgrade benefits.
Main system:
AMD Ryzen 5 3600X, 16GB DDR4-2400, Sapphire R9 390 Nitro and an MSI Meg X570 Ace motherboard.
Other drives:
1TB class
Corsair Force MP600 1TB (PCIe Gen4)
Corsair Force MP510 960GB
Crucial P1 1TB
Patriot Viper VPN4100 1TB (PCIe Gen4)
Patriot Viper VPN100 1TB
PNY CS3030 1TB
Seagate FireCuda 510 1TB
Samsung SSD970 PRO 1TB
Samsung SSD960 PRO 2TB
Samsung SSD960 EVO 1TB
Samsung SSD960 EVO Plus 1TB
Toshiba BG4 1TB
Toshiba XG6 1TB
Western Digital Black SN750 1TB
Western Digital Black SN750 1TB with Heatsink
Western Digital Black NVMe 1TB
Software:
Atto Disk Benchmark 3.05 / 4.00.
CrystalMark 6.0.0 / 7.
AS SSD 2.0.
IOMeter.
Futuremark PC Mark 8.
All our results were achieved by running each test five times with every configuration this ensures that any glitches are removed from the results. Trim is confirmed as running by typing fsutil behavior query disabledeletenotify into the command line. A response of disabledeletenotify =0 confirms TRIM is active.
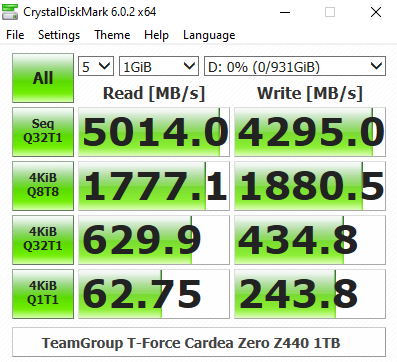
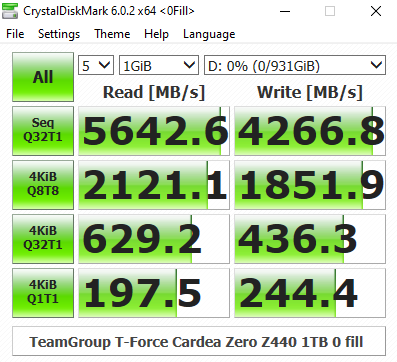
CrystalDiskMark is a useful benchmark to measure theoretical performance levels of hard drives and SSD’s. We are using v6.0.
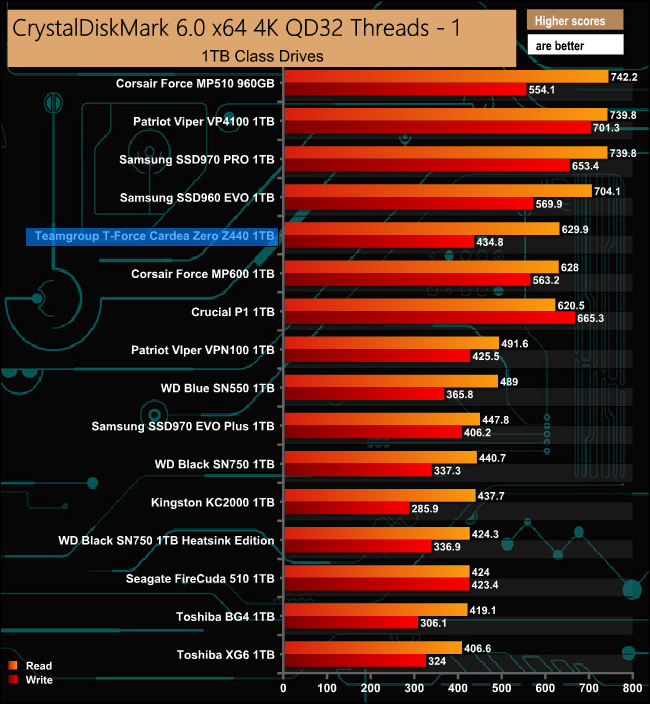
In CrystalDiskMark’s QD32 test, the Teamgroup T-Force Cardea Zero Z440 just shades Corsair's Force MP600 in terms of read performance but falls behind when it comes to writes. Both read and write scores are way behind Patriot's PCIe Gen 4 drive, the Viper VP4100.
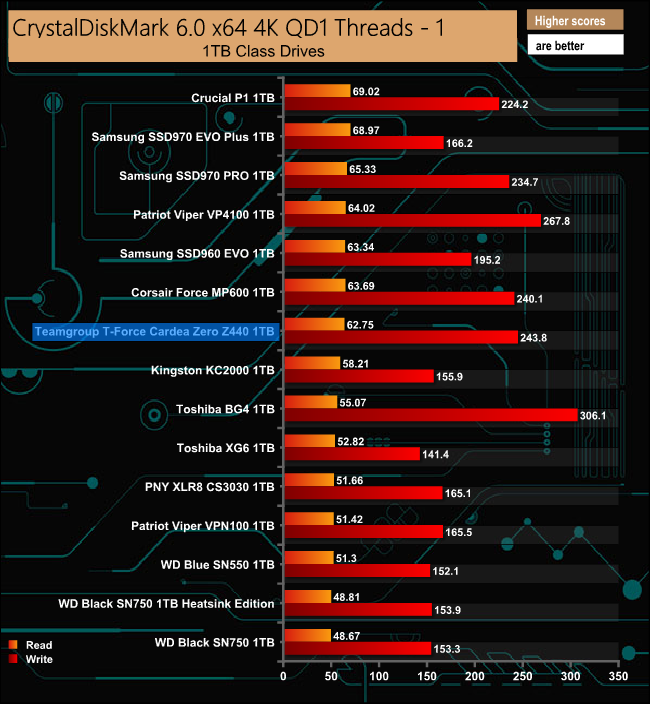
At a queue depth of 1, the T-Force Cardea Zero Z440 sits below both the other Gen 4 drives, the Corsair Force MP600 and Patriot's Viper VP4100 in our result chart.
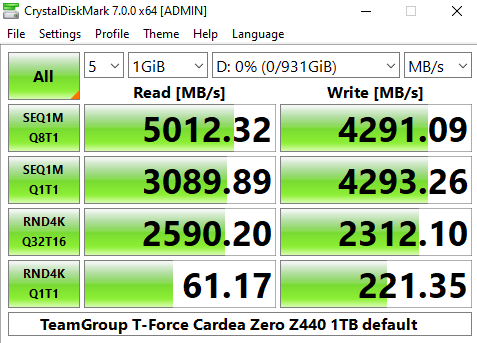
We have just started to test drives with version 7 of CrystalDiskMark.
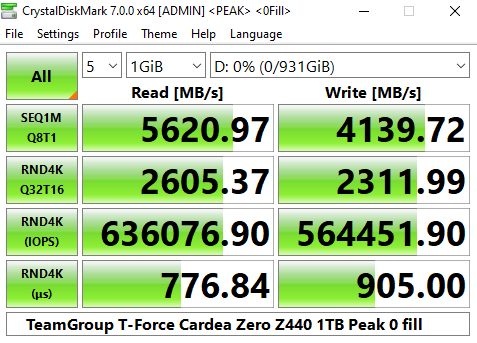
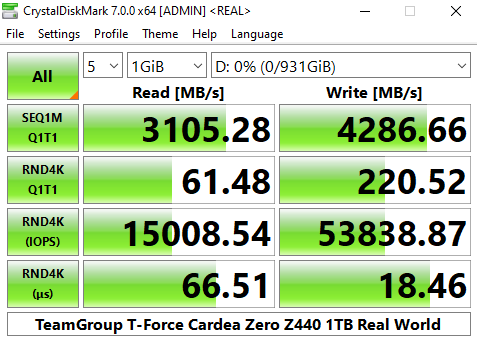
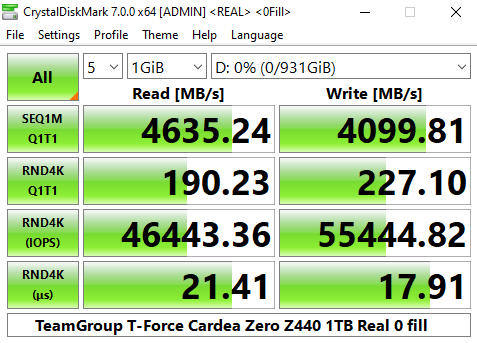
The latest version of CrystalDiskMark includes a couple of profiles that can be used for testing, Peak Performance and Real World. The result screens for these two profiles not only display MB/s results but also IOPS and latency.
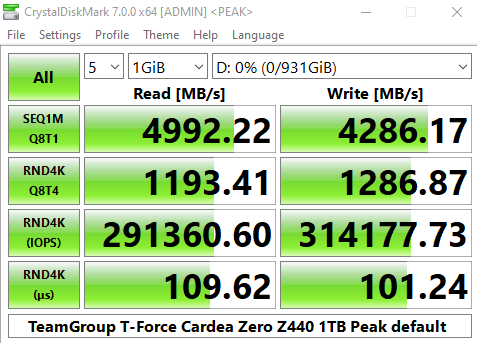
Looking at the Peak Performance profile results for Sequential read/write performance we see that it confirms the official maximum read figure for the T-Force Cardea Zero Z440 of 5,000 MB/s but falls short of the maximum official write figure of 4,400MB/s. However, the fastest read IOPS figure of 636,076 IOPS and write figure of 564,451 IOPS fall way, way short of the official maximum of 750,000 IOPS.
The ATTO Disk Benchmark performance measurement tool is compatible with Microsoft Windows. Measure your storage systems performance with various transfer sizes and test lengths for reads and writes. Several options are available to customize your performance measurement including queue depth, overlapped I/O and even a comparison mode with the option to run continuously.
Use ATTO Disk Benchmark to test any manufacturers RAID controllers, storage controllers, host adapters, hard drives and SSD drives and notice that ATTO products will consistently provide the highest level of performance to your storage.
We are using version 3.5 for our NVMe disk tests but have recently started to use ATTO 4 for testing so we've included results from these tests.
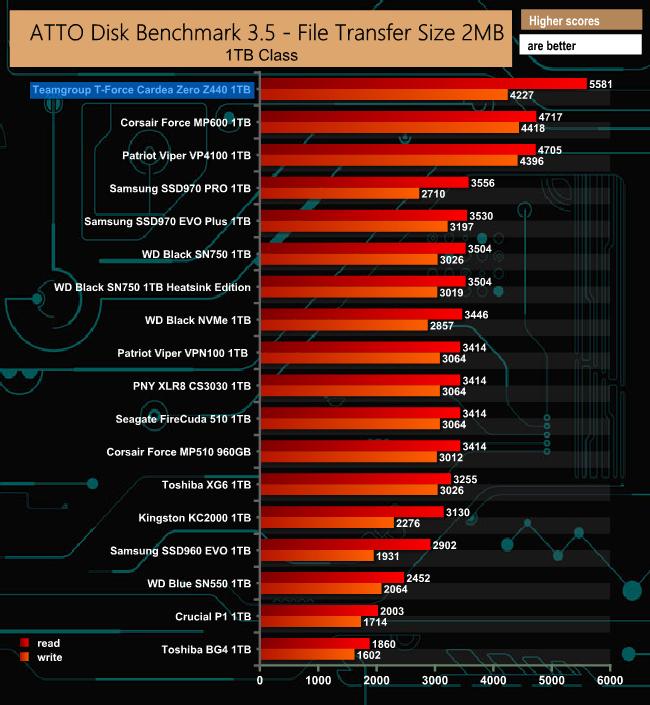
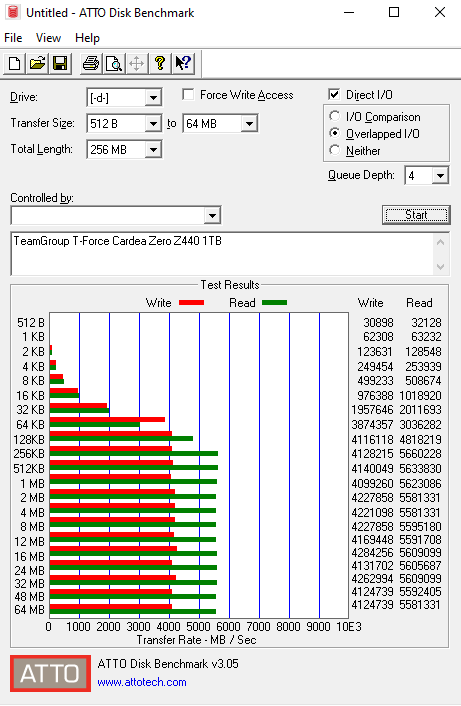
The official Sequential read/write performance figures for the drive are up 5,000 MB/s and 4,400MB/s respectively. Using the ATTO 3.5 benchmark the reviewed drive produced a read figure of 5,581MB/s, sailing past that official figure. The write figure on the other hand at 4,227MB/s was a fair bit off the stated maximum.
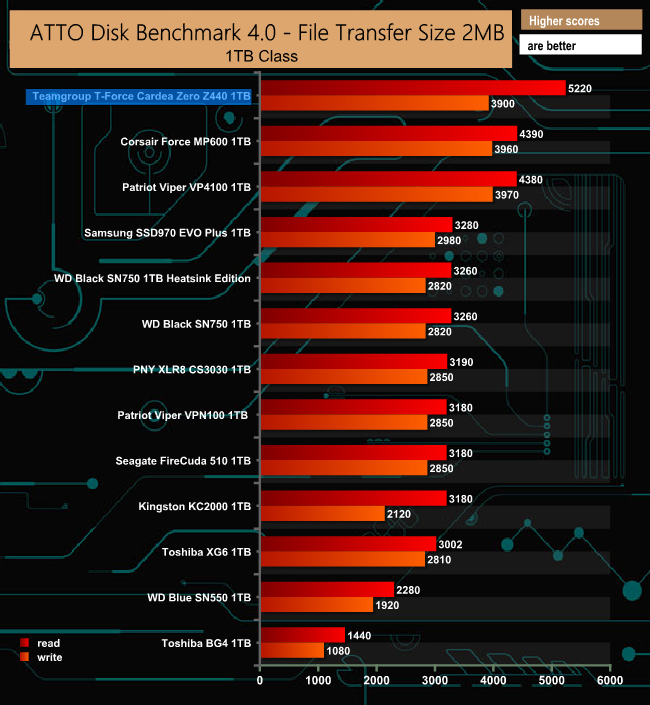
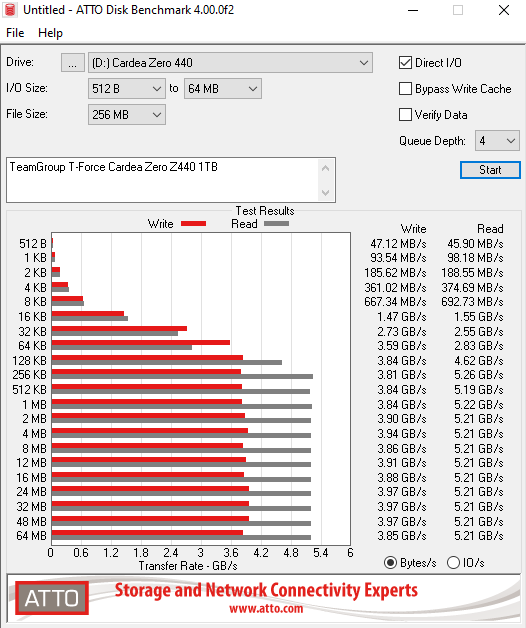
It was a similar story with ATTO 4.0 with the read performance bettering the official figure at 5,220MB/s while the writes were way off at 3,990MB/s.
AS SSD is a great free tool designed just for benching Solid State Drives. It performs an array of sequential read and write tests, as well as random read and write tests with sequential access times over a portion of the drive. AS SSD includes a sub suite of benchmarks with various file pattern algorithms but this is difficult in trying to judge accurate performance figures.
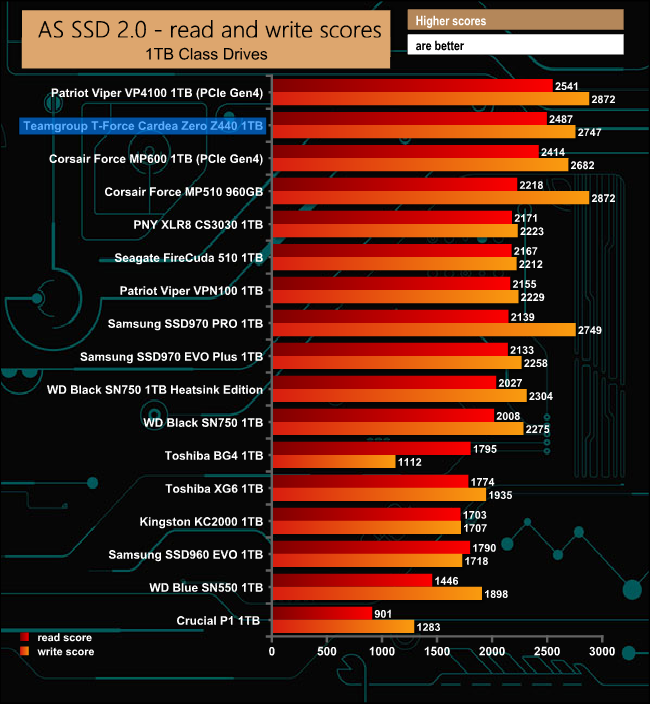
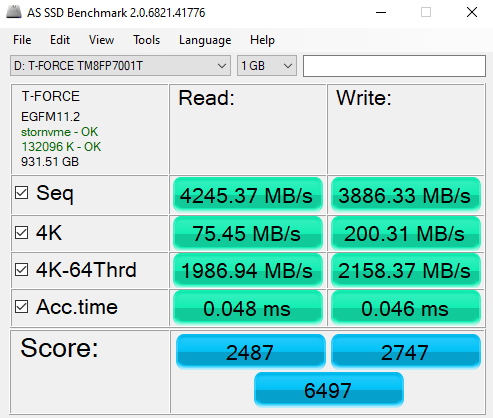
Teamgroup's T-Force Cardea Zero Z440 drive sits between the two other PCIe Gen 4 drives we've tested being slightly faster than the Corsair Force MP600 and slightly slower than Patriot's Viper VP4100 drive.
IOMeter is another open-source synthetic benchmarking tool which is able to simulate the various loads placed on a hard drive and solid-state drive technology. There are many ways to measure the IOPS performance of a Solid State Drive, so our results will sometimes differ from the manufacturer’s quoted ratings. We do test all drives in exactly the same way, so the results are directly comparable.
We test 128KB Sequential read and write and random read and write 4k tests. The test setup’s for the tests are listed below. Each is run five times.
128KB Sequential Read / Write.
Transfer Request Size: 128KB Span: 8GB Thread(s): 1, Outstanding I/O: 1-32 Test Run: 20 minutes per test
4K Sustained Random Read / Write.
Transfer Request Size: 4KB Span: 80GB Thread(s): 4, Outstanding I/O: 1-32 Test Run: 20 minutes per test
4K Random 70/30 mix Read/Write.
Transfer Request Size: 4KB Span: 80GB Reads: 70% Writes: 30% Thread(s): 4 Outstanding I/O: 2 – 32 Test Run: 20 minutes.
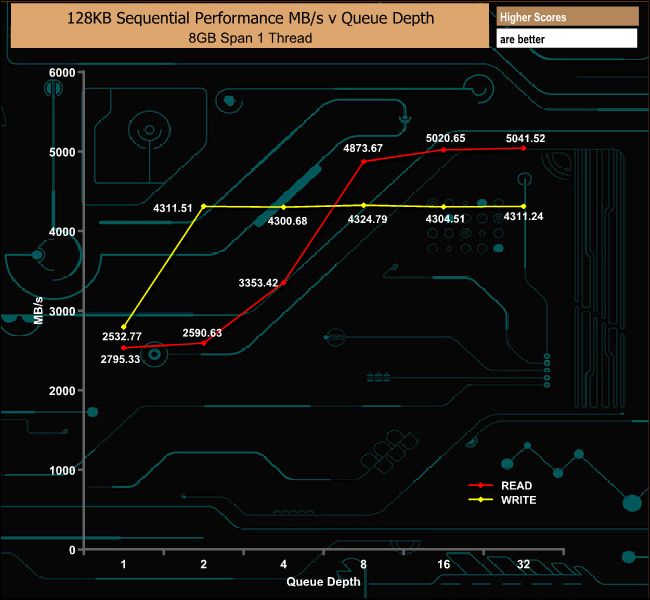
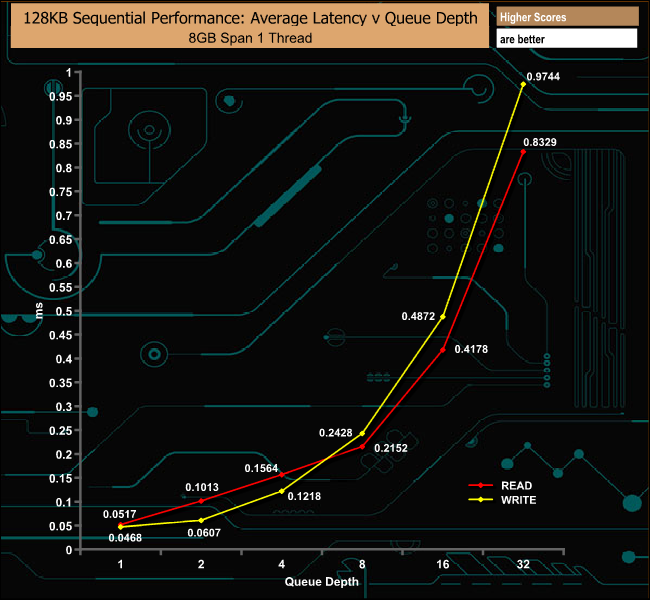
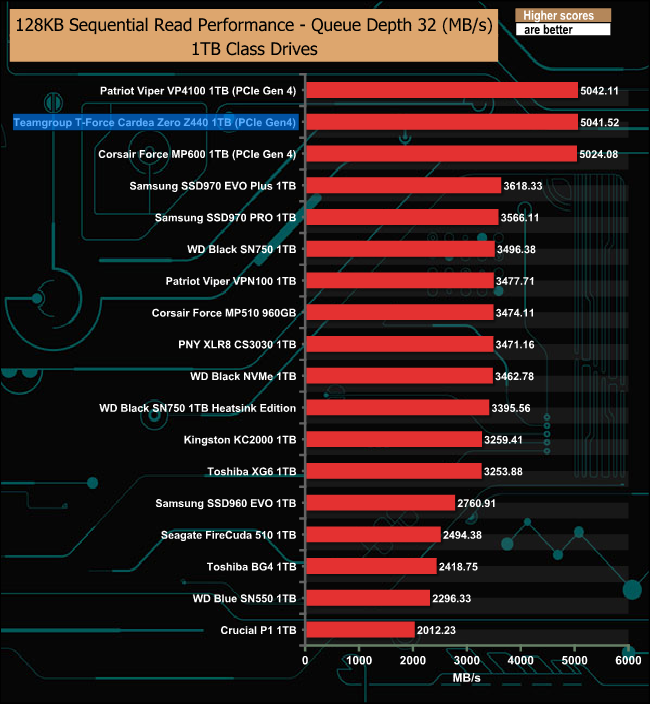
With our own Sequential tests we got slightly a slightly faster, 5,041MB/s, read result than the official maximum of 5,000MB/s while the write result from our tests at 4,331MB/s didn't quite get to the official maximum of 4.400MB/s.
128KB Sequential Read Performance v QD
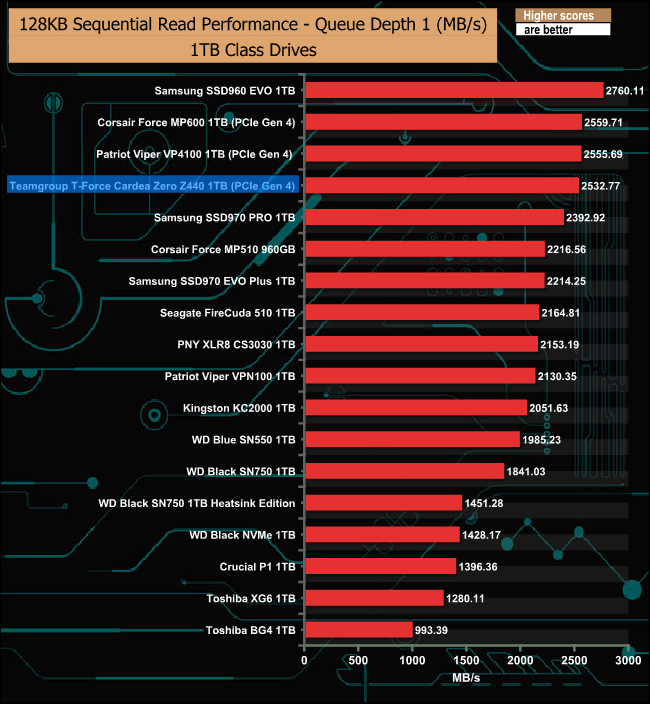
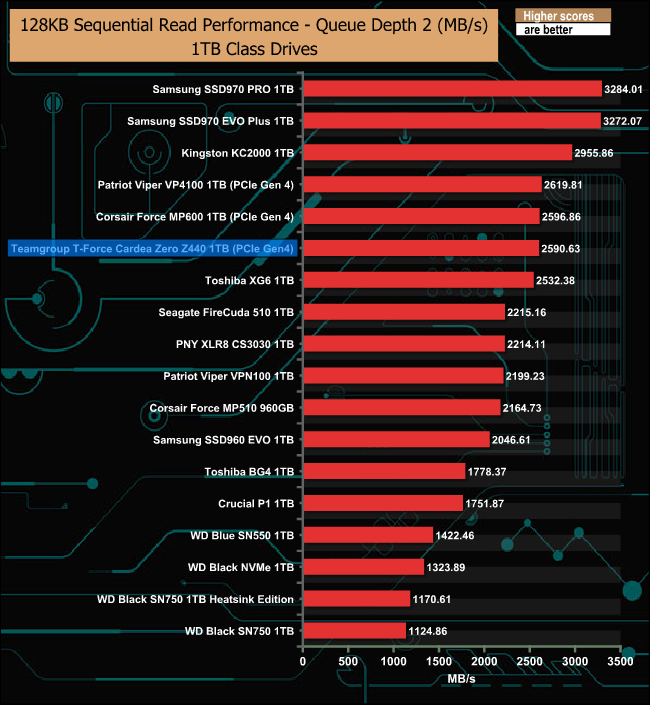
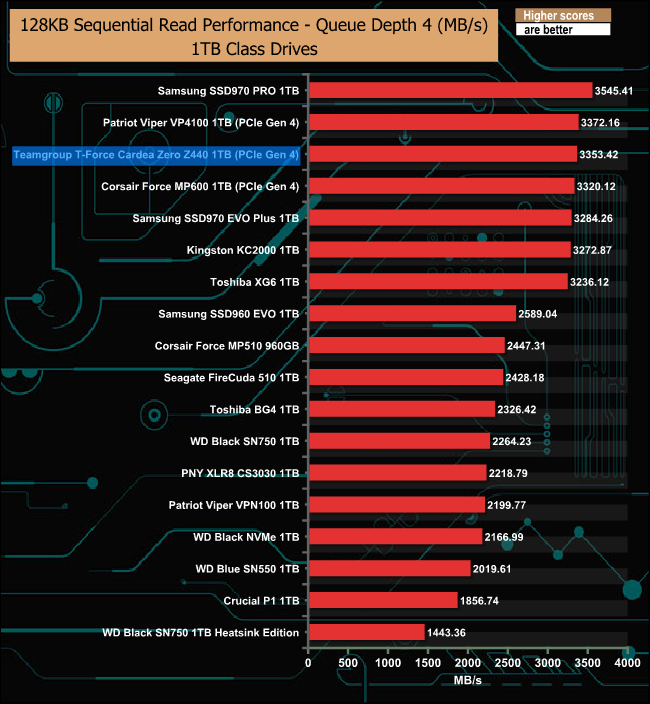
At a QD's 1 and 2 the T-Force Cardea Zero Z440 trails both the Patriot Viper VP4100 and the Corsair MP600, the two other Gen 4 drives we've recently looked at. But as the QD deepens the drive leap frogs the Corsair drive and closes up right behind the Patriot drive.
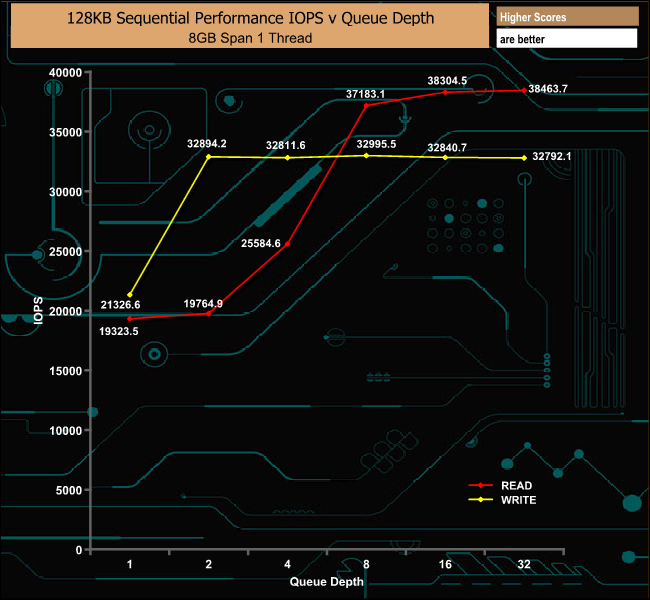
128KB Sequential Write Performance v QD
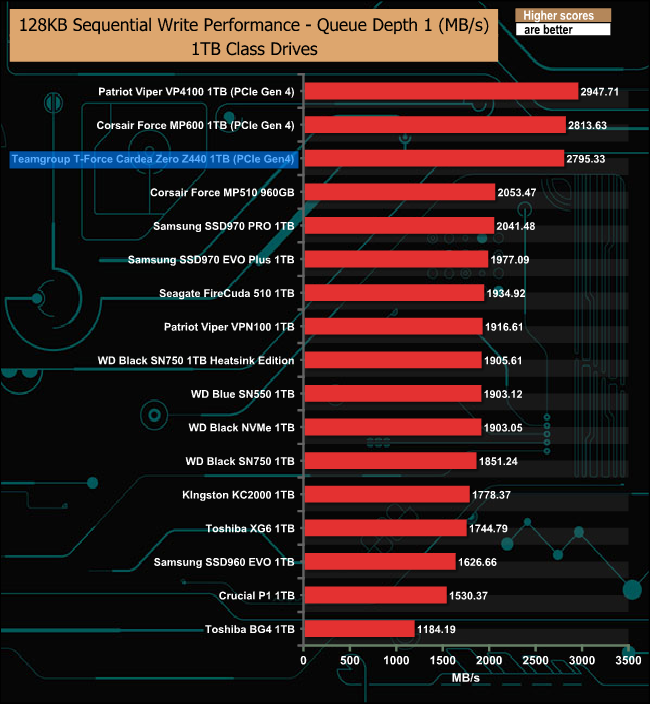
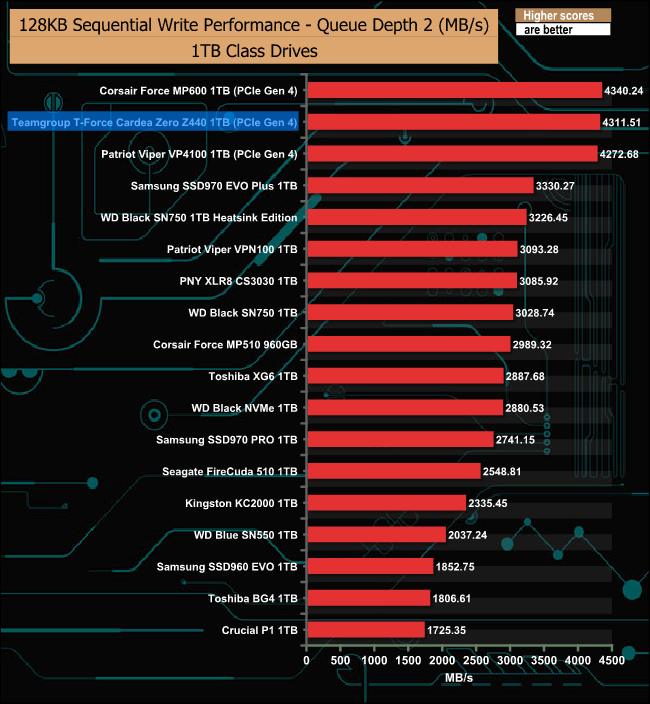
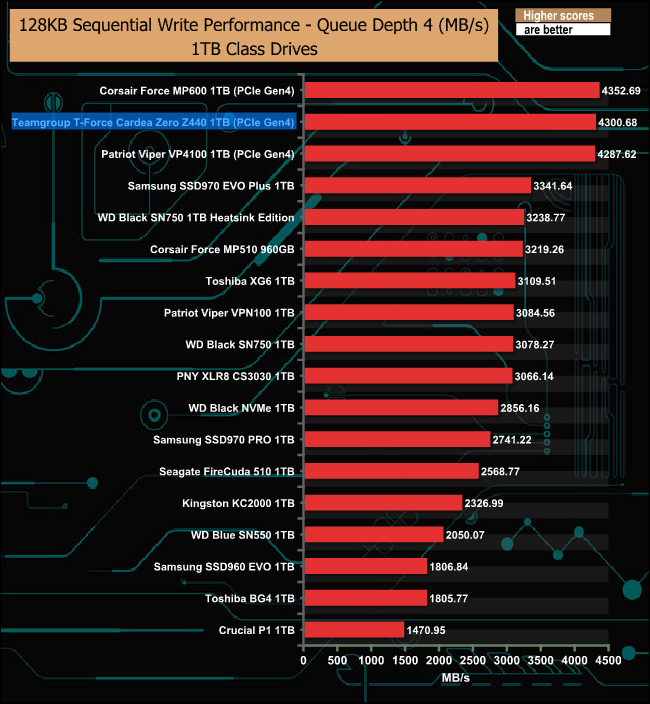
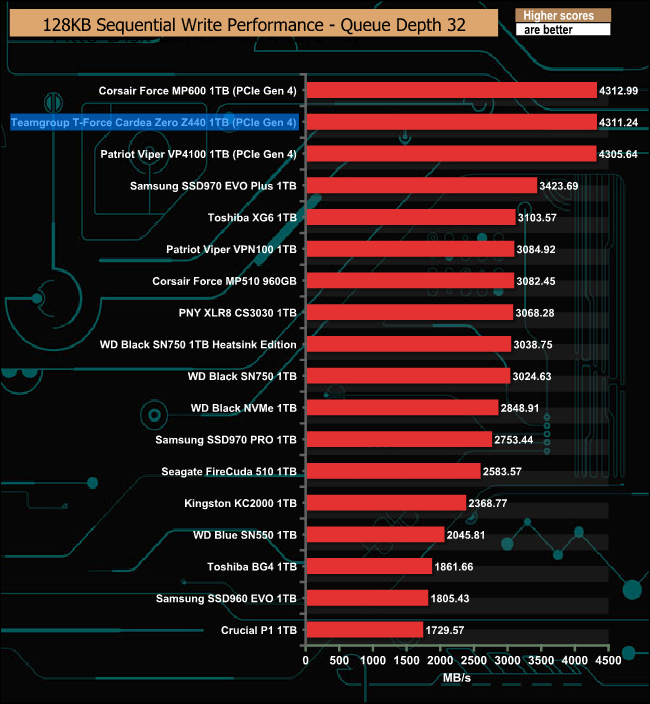
As with the Sequential read performance, the write performance of the drive in comparison with the other two Gen 4 drives improves as the QD deepens.
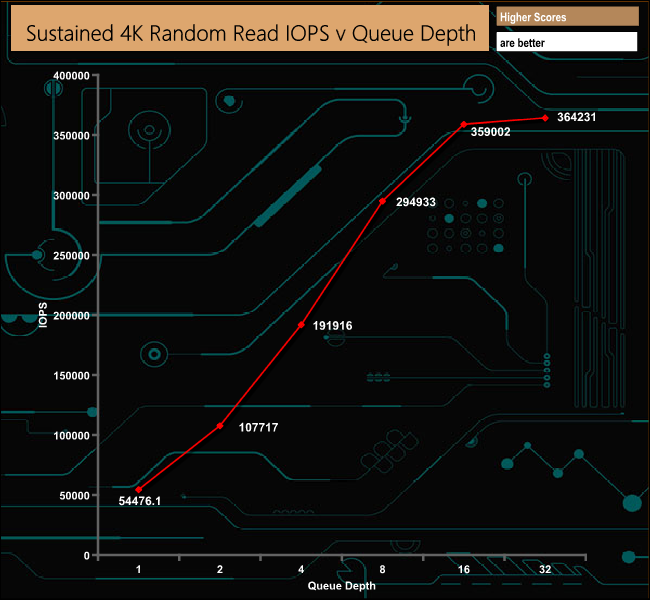
The official maximum read IOPS figure for the drive is 750,000 IOPS. As you can see from the results chart we couldn't get close to that figure with our 4-threaded tests. The fastest performance we saw was 364,231 IOPS at a QD of 32.
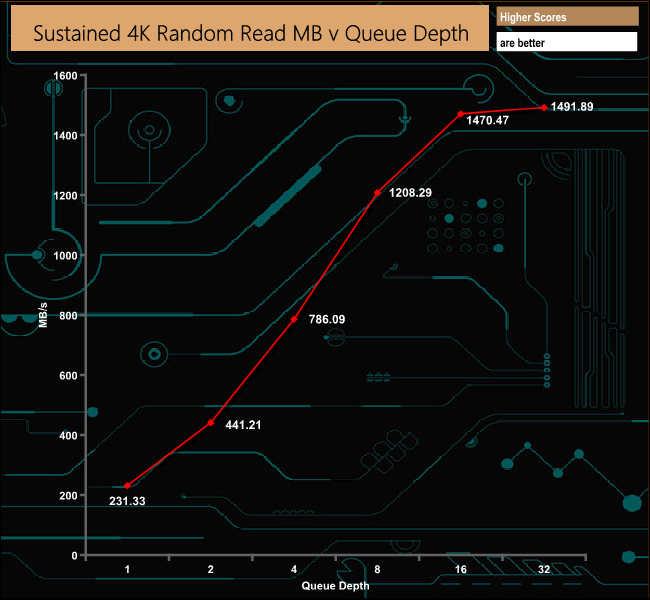
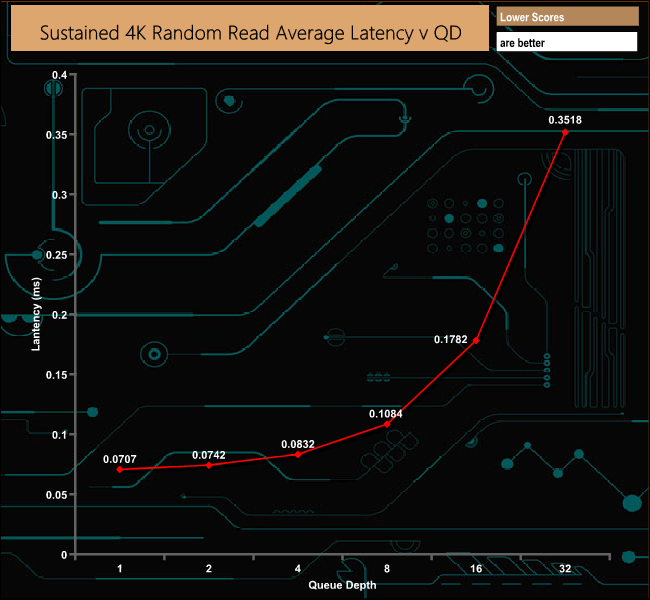
4K Random Read v QD Performance

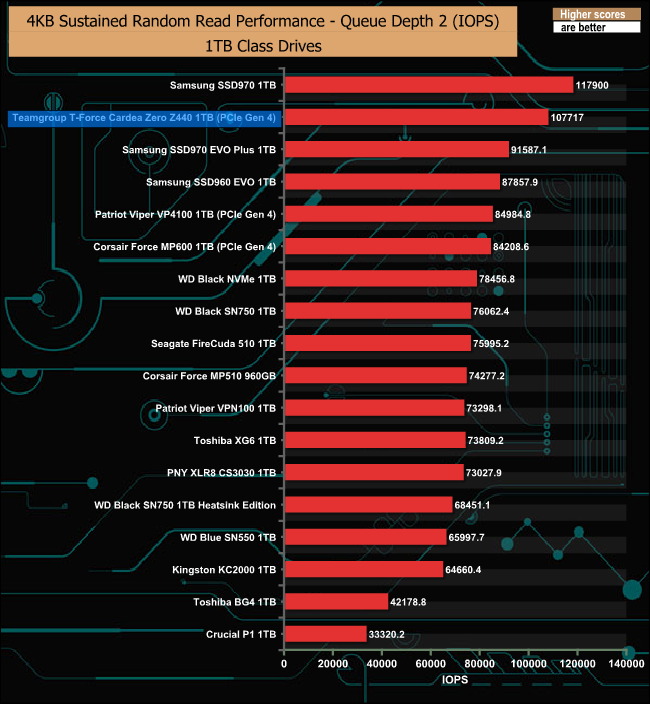
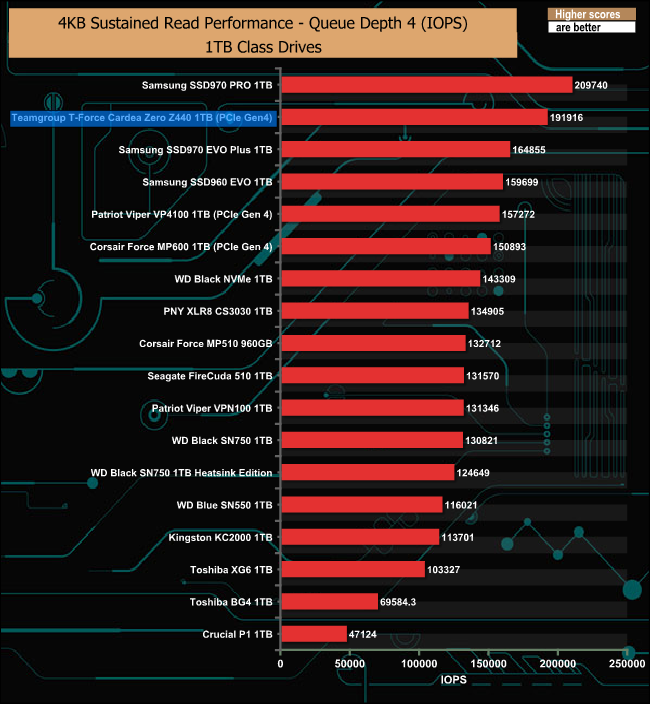

The drive seemed to perform the best at QD's 2 and 4 before falling back compared to the other two Gen 4 drives at a deep QD of 32.
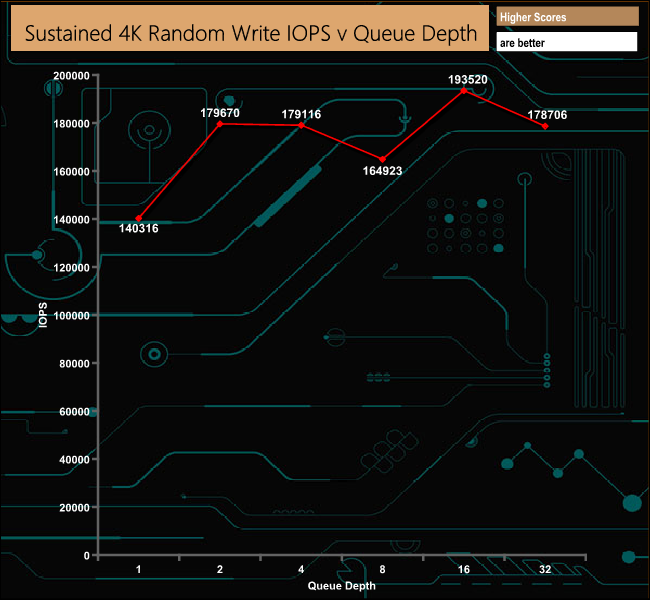
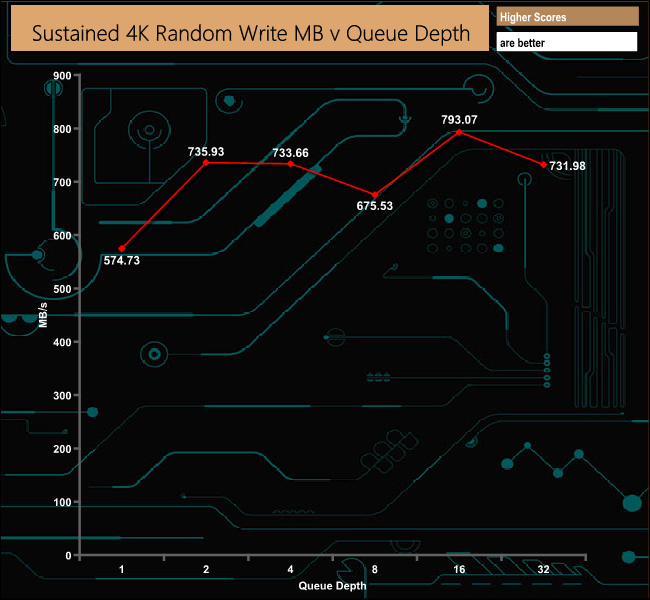
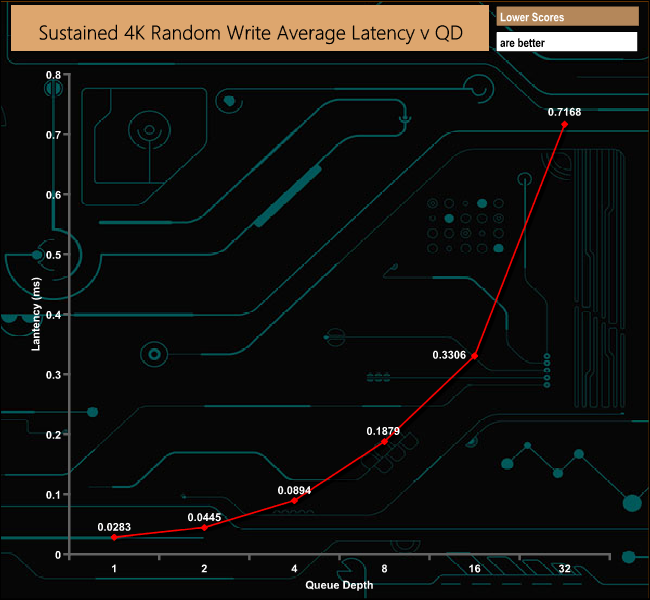
As with random reads, the maximum random write figure for the drive is 750,000 IOPS. Once again we couldn't get close to this figure with our tests, the best IOPS figure we could get was at a QD of 16 at 193,520 IOPS.
4K Random Write v QD Performance
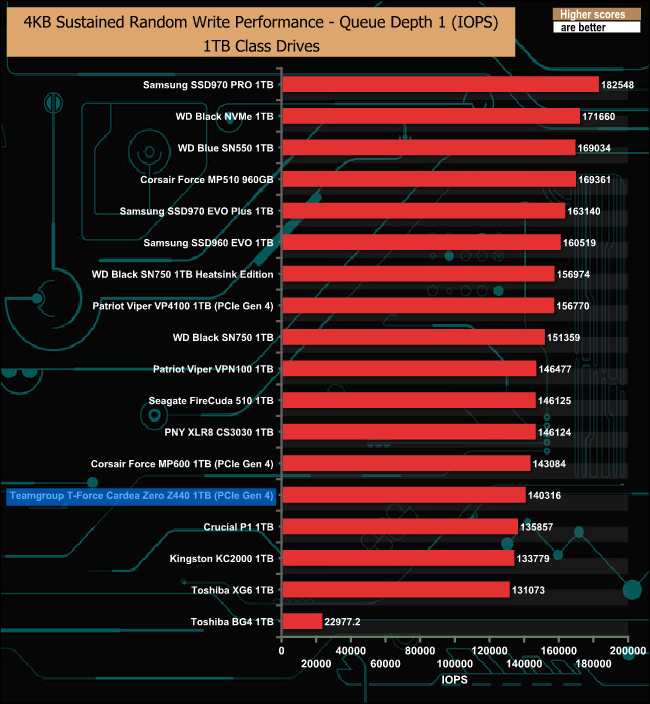

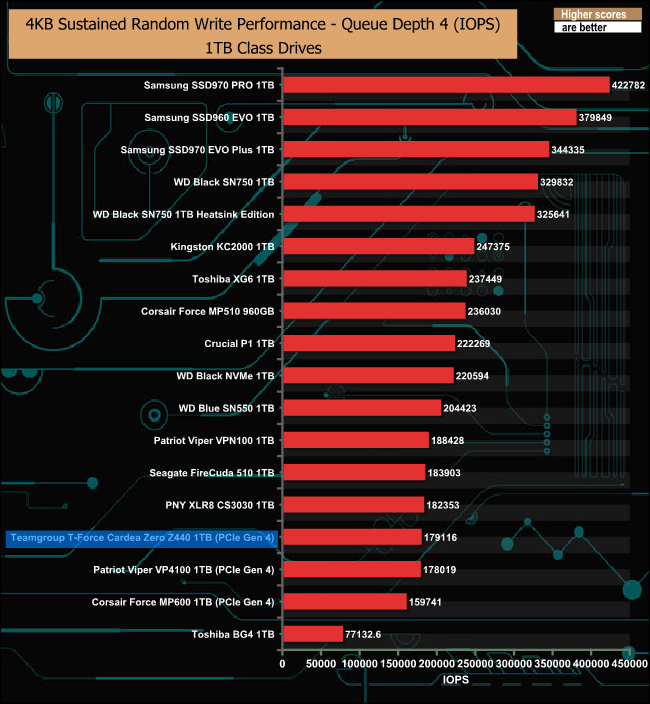
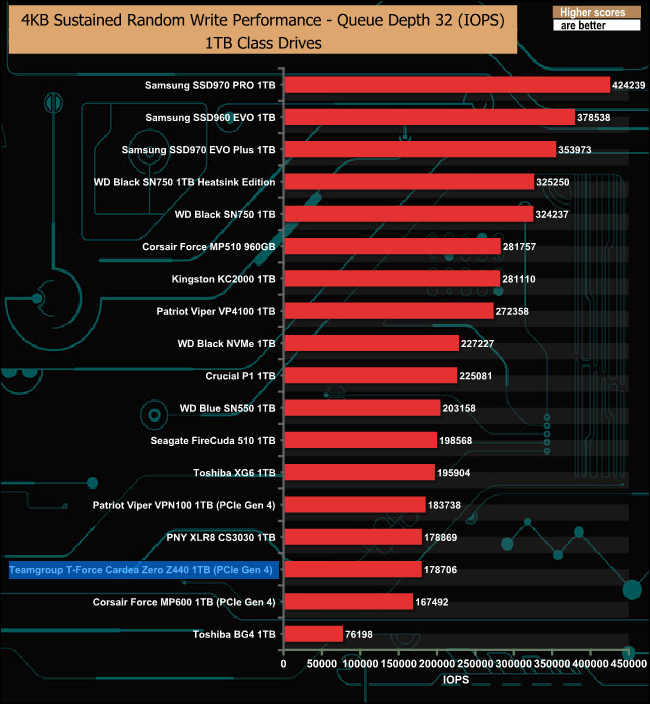
Compared to the other two PCIe Gen 4 drives, the best random write performance of the T-Force Cardea Zero Z440 comes at QD's 2 and 4 where it is the quickest of the three drives.
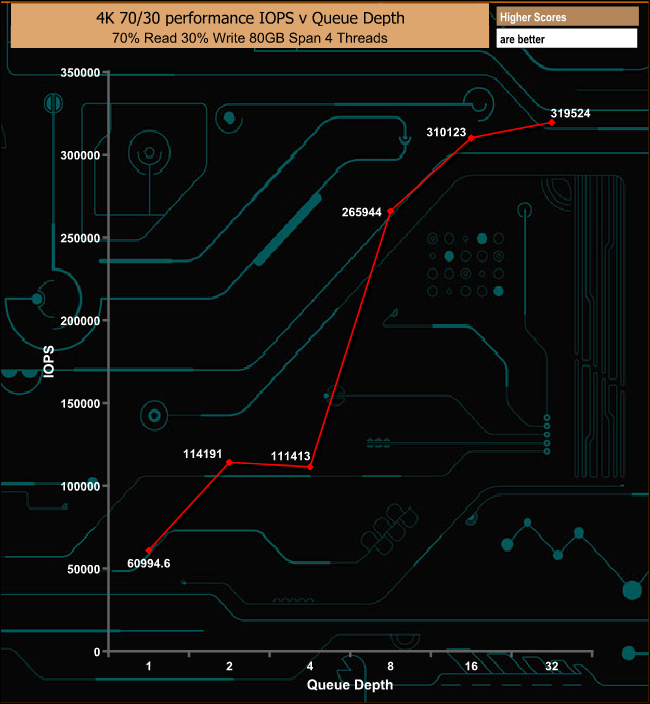
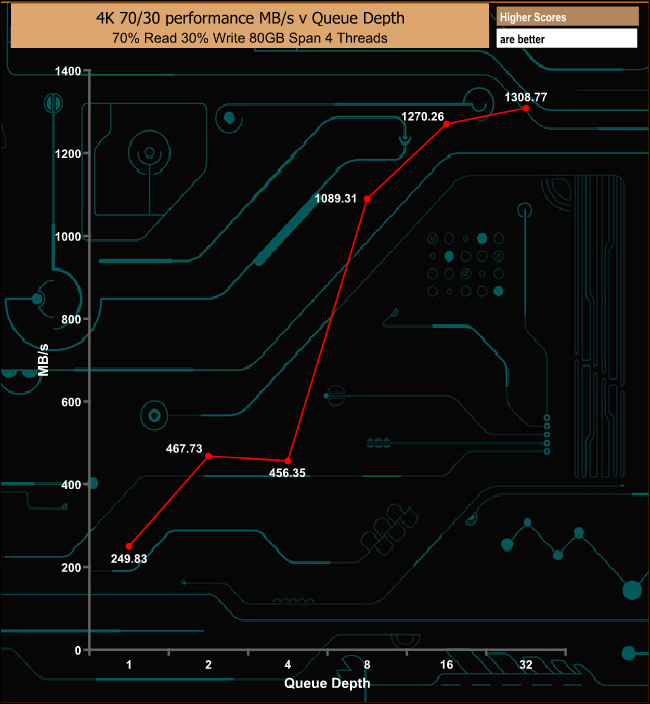
After plateauing out between QD's 2 and 4, the performance climbs steadily in the mixed 70/30 read/write test to finish at a strong 319,524 IOPS (1,308.88MB/s) at a QD of 32.
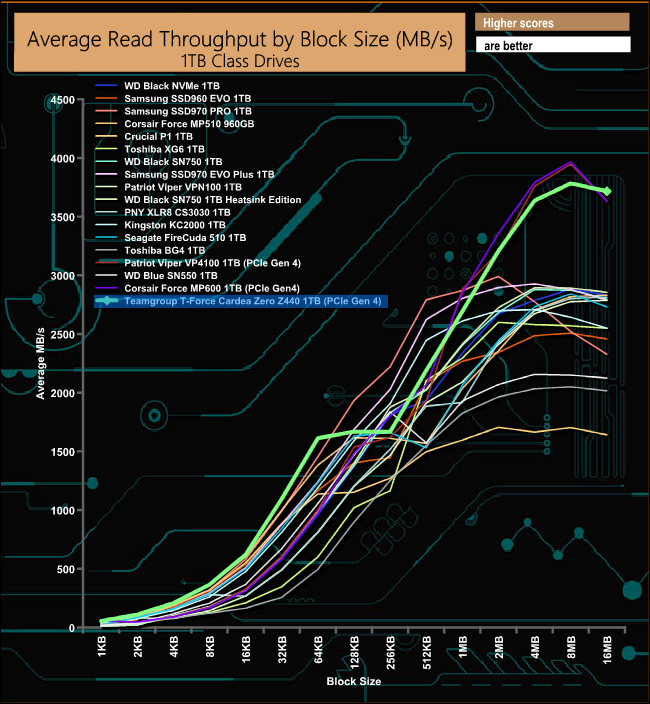
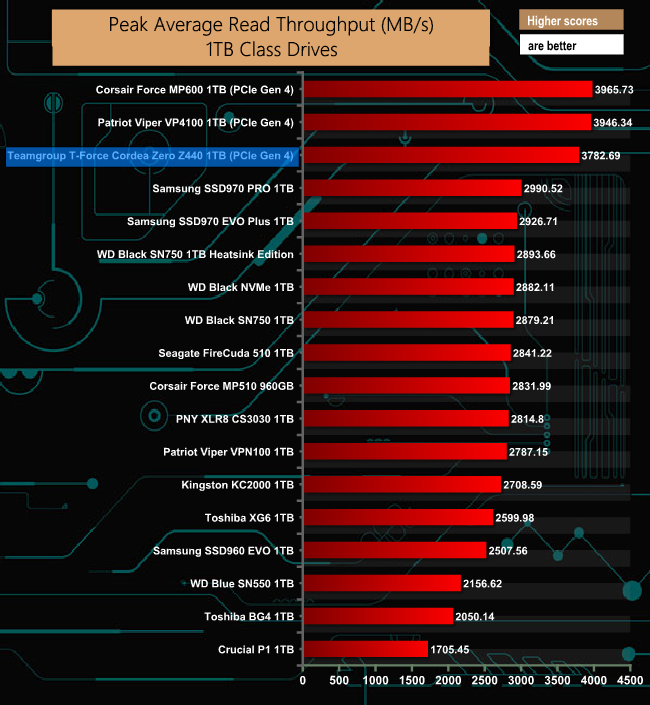
In our read throughput test the drive peaks at the 8MB block mark at 3,782.69MB/s, putting it into third place behind the other two PCIe Gen 4 drives recently tested.
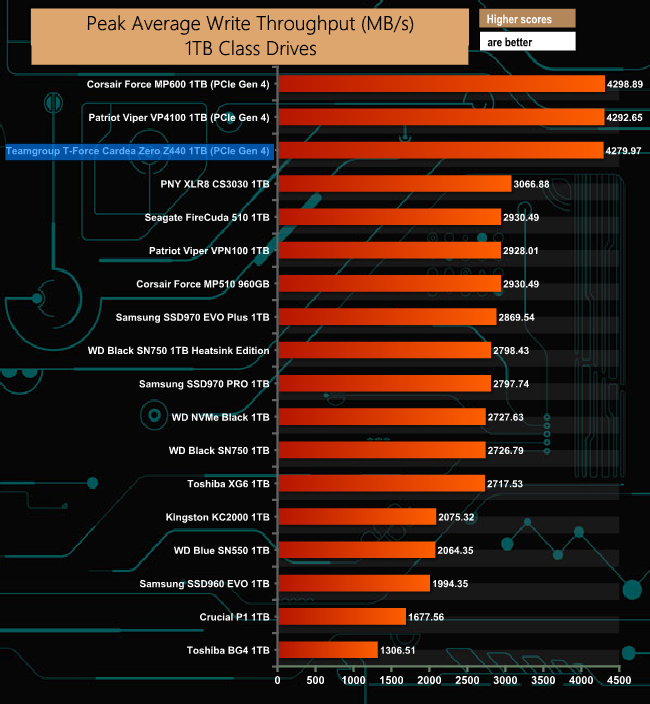
As with the read throughput test, the drive is behind the other two PCIe Gen 4 drives in our write throughput test. It peaks at the 4MB block mark at 4,279.97MB/s.
Futuremark’s PCMark 8 is a very good all-round system benchmark but it’s Storage Consistency Test takes it to a whole new level when testing SSD drives. It runs through four phases; Preconditioning, Degradation, Steady State, Recovery and finally Clean Up. During the Degradation, Steady State and Recovery phases it runs performance tests using the 10 software programs that form the backbone of PCMark 8; Adobe After Effects, Illustrator, InDesign, Photoshop Heavy and Photoshop Light, Microsoft Excel, PowerPoint, Word, Battlefield 3 and World of Warcraft. With some 18 phases of testing, this test can take many hours to run.
Preconditioning
The drive is written sequentially through up to the reported capacity with random data, write size of 256 × 512 = 131,072 bytes. This is done twice.
Degradation
Run writes of random size between 8 × 512 and 2048 × 512 bytes on random offsets for 10 minutes. It then runs a performance test. These two actions are then repeated 8 times and on each pass, the duration of random writes is increased by 5 minutes.
Steady State
Run writes of random size between 8 × 512 and 2048 × 512 bytes on random offsets for final duration achieved in degradation phase. A performance test is then run. These actions are then re-run five times.
Recovery
The drive is idled for 5 minutes. Then a performance test is run. These actions are then repeated five times.
Clean Up
The drive is written through sequentially up to the reported capacity with zero data, write size of 256 × 512 = 131,072 bytes.
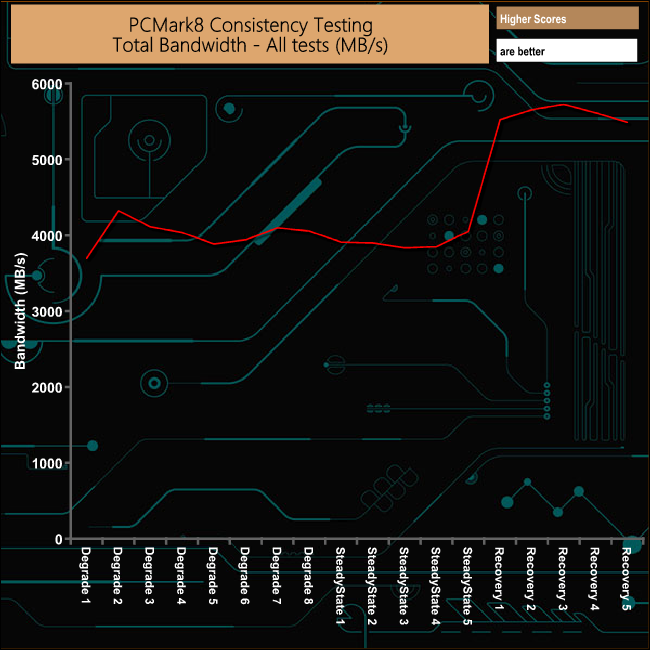

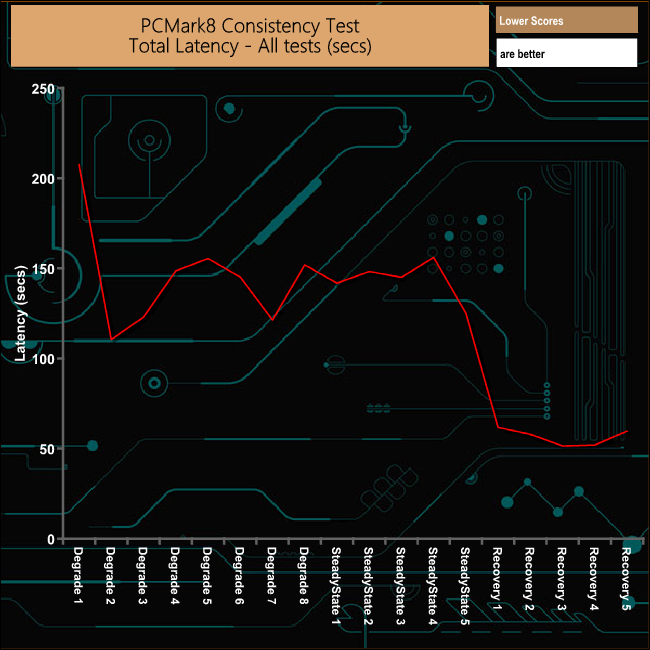
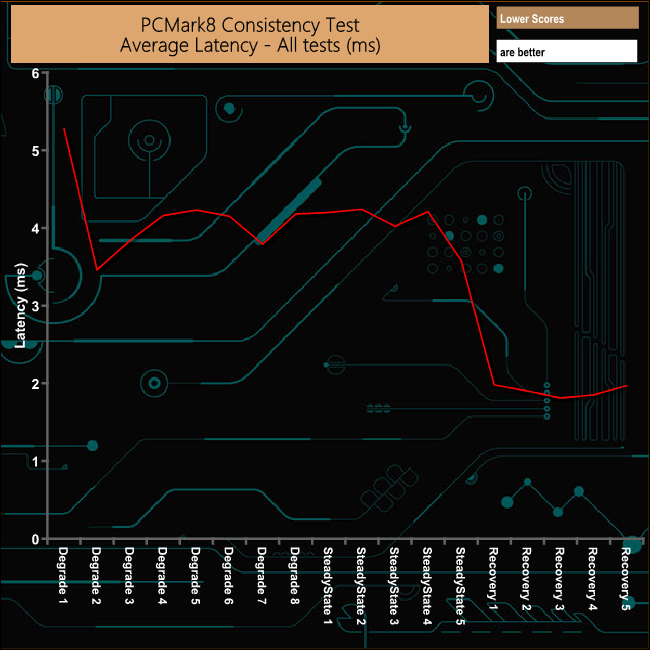
Teamgroup's T-Force Cardea Zero Z440 handles the stresses of PCM8's Consistency test pretty well overall. There are no major dips in bandwidth and the drive recovers well if a little erratically from the ordeal.
PCMark 8’s Consistency test provides a huge amount of performance data, so here we’ve looked a little closer at how the Cardea Force Z440 performs in each of the benchmarks test suites.
Adobe Creative Cloud
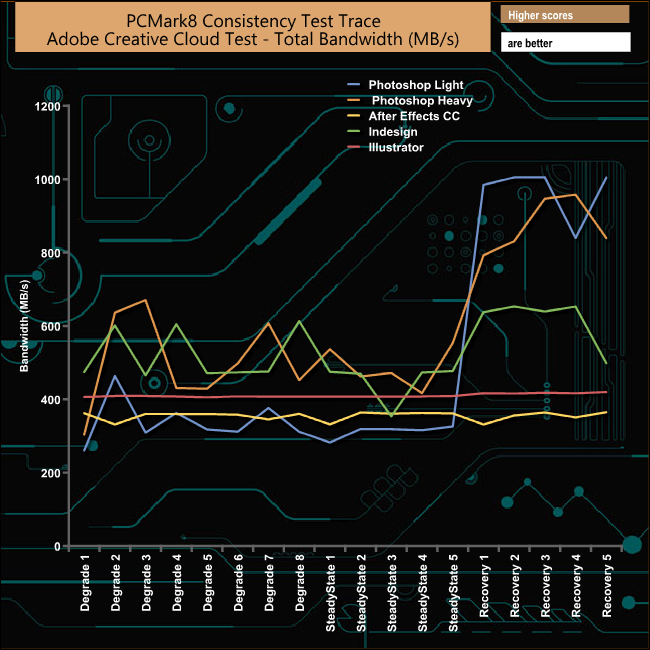
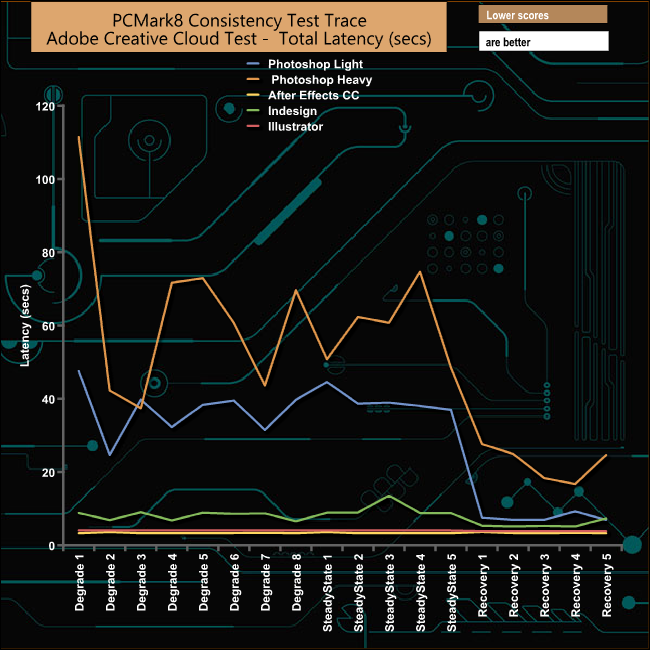
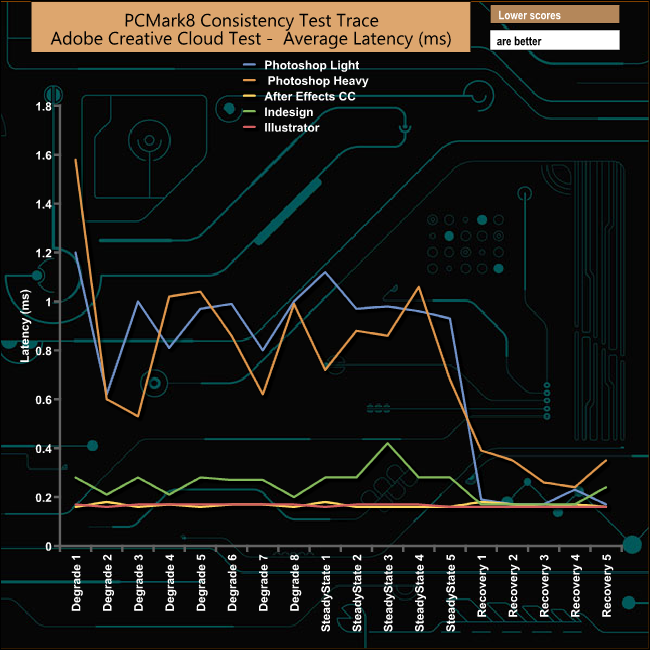
Usually, during the Adobe CC set of tests in the benchmark, it's the Adobe Photoshop Heavy trace that causes a drive problems, not so with the T-Force Cardea Zero Z440. In this instance, it's the other Photoshop trace, the Photoshop Light that causes problems and although the drive recovers well from both Photoshop tests, the performance during the Recovery phase is erratic, to say the least.
Microsoft Office
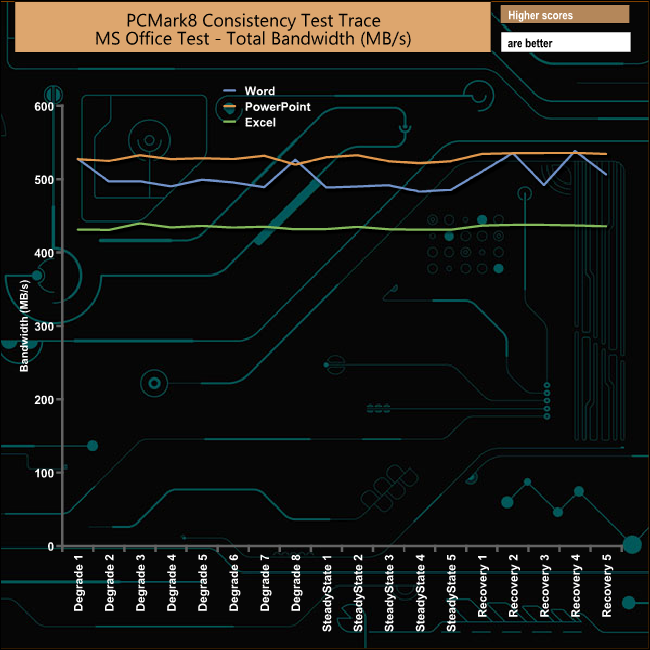
It's pretty rare in the Microsoft Office test runs to see bandwidth result traces as flat as this. Even the Word trace, one which normally seems to give a drive some problems is dealt with very efficiently.
Casual Gaming
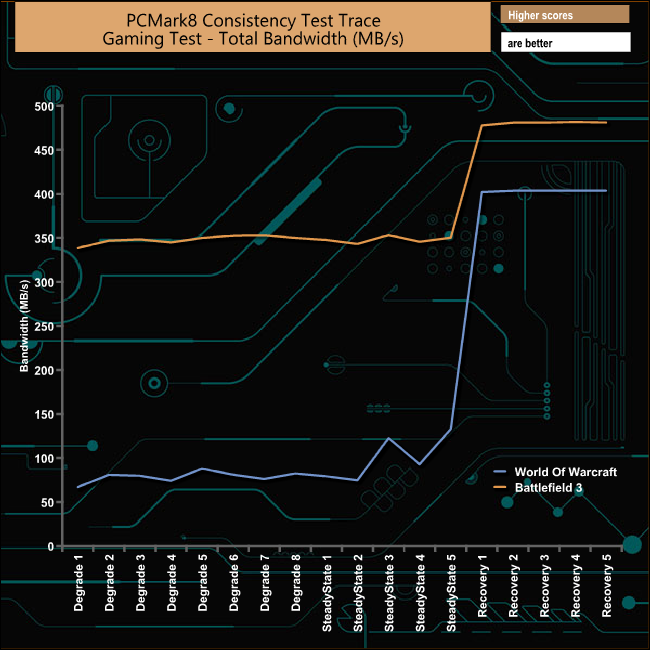
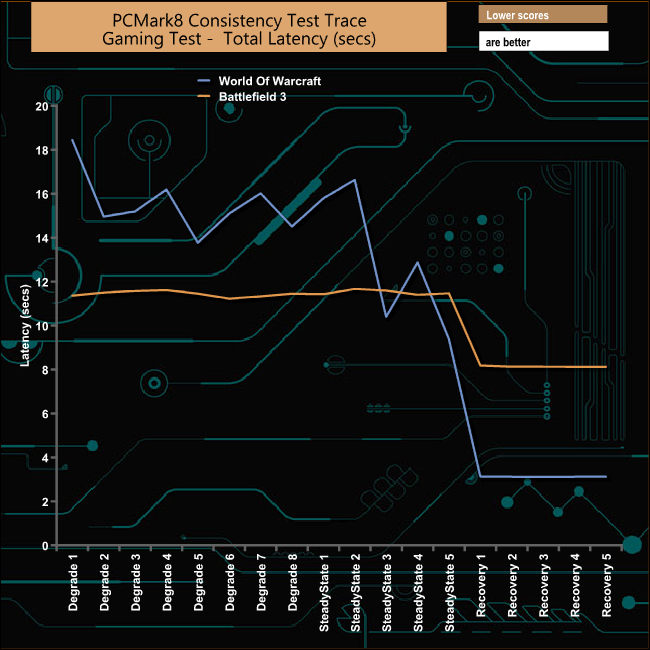
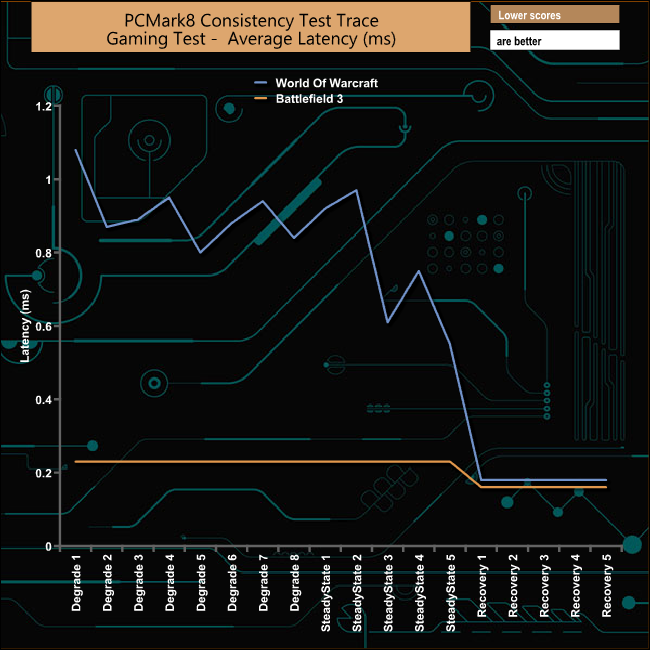
The two game traces are dealt with very differently by the drive. The World Of Warcraft trace has low bandwidth figures throughout the test until the Recovery phase starts where the bandwidth rockets up before levelling off through the rest of the recovery phase. The Battlefield 3 trace, on the other hand, produces much higher bandwidth figures for the test run but with a much smaller climb at the start of the Recovery phase before once again levelling out.
Just like the Consistency test, PCMark 8’s Standard Storage test also saves a large amount of performance data. The default test runs through the test suite of 10 applications three times. Here we show the total bandwidth performance for each of the individual test suites for the third and final benchmark run.
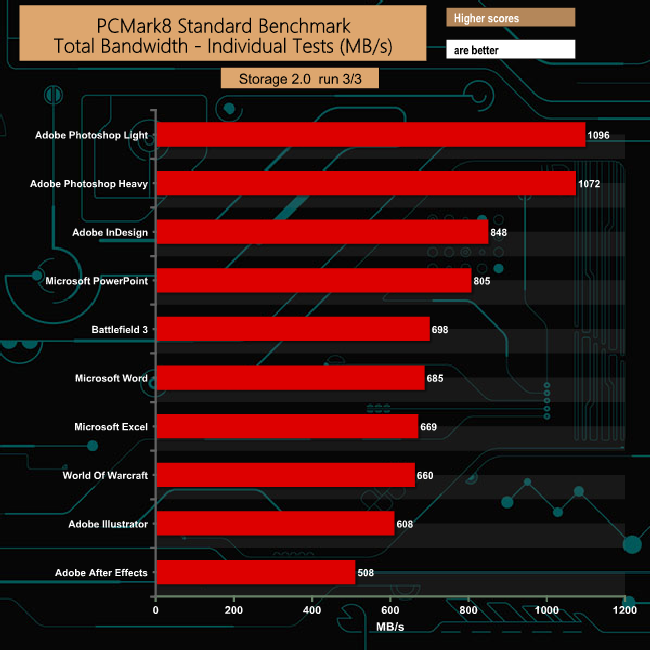
The T-Force Cardea Zero Z440 performs strongly in PCMark 8's Standard Storage test with over 1GB/s bandwidth figures for both the Adobe Photoshop traces. Also, the Adobe InDesign and Microsoft PowerPoint traces produce very good bandwidth figures.
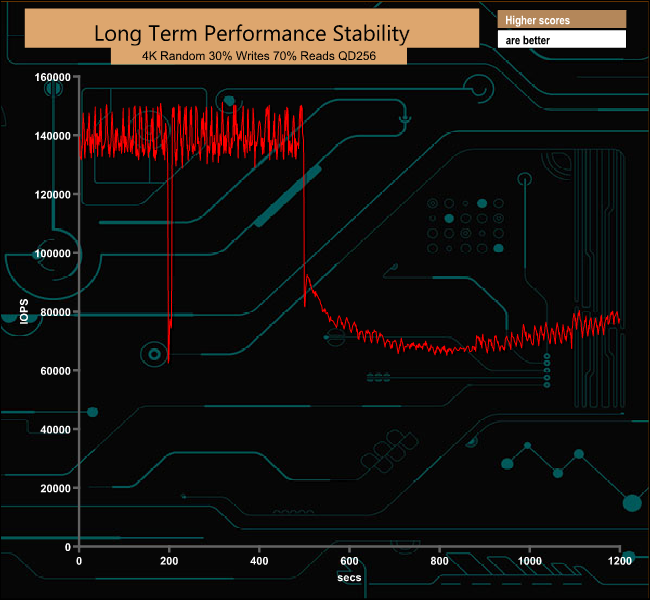
For the long term performance stability test, we set the drive up to run a 20-minute 4K random test with a 30% write, 70% read split, at a Queue Depth of 256 over the entire disk. The 1TB T-Force Cardea Zero Z440 averaged 99,981.95 IOPS for the test with a performance stability of 66.70%.
To test the real-life performance of a drive we use a mix of folder/file types and by using the FastCopy utility (which gives a time as well as MB/s result) we record the performance of drive reading from & writing to a 256GB Samsung SSD850 PRO.
100GB data file.
60GB iso image.
60GB Steam folder – 29,521 files.
50GB File folder – 28,523 files.
21GB 8K Movie demos.
12GB Movie folder – 24 files (mix of Blu-ray and 4K files).
11GB 4K Raw Movie Clips (8 MP4V files).
10GB Photo folder – 621 files (mix of png, raw and jpeg images).
10GB Audio folder – 1,483 files (mix of mp3 and .flac files).
5GB (1.5bn pixel) photo.
Blu-ray movie.
![]()
The drive handled our real-life file transfers without any problems particularly when dealing with the larger file size transfers, averaging 528MB/s for writes and 437MB/s for reads when dealing with these file types.
To get a measure of how much faster PCIe NVMe drives are than standard SATA SSD's we use the same files but transfer to and from a 512GB Toshiba OCZ RD400.
![]()
When the SATA drive is taken out of the equation and the drive reads and writes to another NVMe drive, albeit a PCIe Gen 3 drive then you can see just how fast the drive is when dealing with larger file sizes.
Teamgroup produces its own brand of memory modules, memory cards, USB flash drives, solid-state drives, peripheral's mobile accessories and industrial applications. The companies T-Force product line covers their high-performance and gaming products. The current (at the time of writing) flagship SSD of the T-Force line-up is the Cardea Zero Z440 SSD, a drive that uses the latest PCIe Gen4 x4 interface.
Officially the drive is rated as up to 5,000 MB/s and 4,400MB/s for Sequential read and write respectively. When tested with the ATTO 3.5 benchmark, the review drive kicked sand in the face of that official read figure, producing a figure of 5,581MB/s, making it the fastest 1TB class consumer drive we've seen to date in terms of Sequential reads.
However, when it came to the Sequential write performance, we couldn't quite match that official figure, the drive producing a figure of 4,227MB/s. We got a little closer with our own test at 4,311.24MB/s. Although not matching the official maximum write speed, that ATTO 3.5 write figure is still the third-best write speed we've seen for a consumer 1TB SSD.
4K random performance is quoted as up to 750,000 IOPS for both reads and writes. With our 4-threaded 4K random testing we couldn't get close to that figure, the best read/write figures we saw were 364,231 IOPS and 193,520 IOPS respectively. The closest we saw to the quoted maximum was in the Peak Performance profile test of Crystal Disk Mark 7 where the drive produced a read figure of 636,076 IOPS with writes at 564,451 IOPS (QD32 16 Threads).
Teamgroup forgoes the large heatsink of other Gen4 SSD's with the T-Force Cardea Zero Z440. Instead there is, what looks like a first glance, a normal label covering the controller and NAND, but in fact, the label is a bit special. It uses a patented graphene copper foil ultra-thin (less than 0.2mm thick) material to help keep the drive cool.
According to Teamgroup's own figures, it drops the temperature from 61.8°C to 56.5°C when compared to the lack of any heat sink when actively reading and writing. Using a thin label like this also means that the drive can easily be used in conjunction with any integrated M.2 cooling solution on an X570 motherboard without the faffing around of removing the drive's heatsink.
![]()
We found the 1TB Teamgroup T-Force Cardea Zero Z440 for £239.99 (inc VAT) on Overclockers UK HERE.
Discuss on our Facebook page HERE.
Pros.
- Sequential performance.
- PCIe Gen4 x4 SSD.
- Does away with any bulky heatsink.
Cons.
- Needs a X570/Ryzen 3000 combination to get the full benefit of the technology.
- Tested 4K performance couldn’t match the official maximum figures.
Kitguru says: They may be a new name to some but Teamgroup have made their presence felt in the high-performance SSD market by being one of only a very few select manufacturers that have, in the form of the T-Force Cardea Zero Z440, a PCIe Gen 4 SSD sitting in the marketplace