Test Settings:
- Our manual overclock settings of note are: 3.6GHz CPU frequency (36x multiplier), 1.075V CPU Core Voltage (within the MSI UEFI), Mode 2 Load-Line Calibration.
- Our Precision Boost Overdrive settings of note are: 1000A TDC, 1000A EDC, 1000W PPT, +200MHz Frequency Offset.
Test Procedures:
- All CPU coolers are set to 100% fan speed using the CPU_Fan (and EXS3_FAN for dual-fan operation) motherboard header. We also test the IceGiant ProSiphon Elite at reduced fan speed for specific comparisons versus Noctua.
- Corsair’s iCUE H115i RGB PRO XT AIO cooler is used to force full fan and pump speed using iCUE software for Windows 10. The iCUE software is removed when testing other, non-Corsair CPU coolers.
- We use identical thermal paste on all coolers with a consistent application technique.
- Each cooler is removed, cleaned, and remounted at least one time (typically twice) between the repeated test runs to ensure any one-off mounting irregularities are identified and corrected.
- We report the consistent, steady-state temperature that we see from the repeated test runs.
- CPU Package power and system-wide wall power are monitored during testing. We use this data when analysing the results.
- Noise testing is done with our sound meter positioned 50cm away from the side panel. The system is fully built with the side panels on but all fans other than the CPU cooler's are disabled.
Loading the CPU in our Test System:
Manually Overclocked Configuration Testing:
Our manual overclocking configuration uses Cinebench R20 as the stress test. We load all 128 threads and cycle the load for 1800 seconds (30 minutes). This provides what we perceive to be enough soak time for the CPU, CPU cooler, and supplementary hardware to reach a reasonable steady-state temperature level in Cinebench R20.
One slight downside of this loading approach is the small period of CPU downtime between completion of a render frame and the starting of the next render frame. This does, however, highlight how such a workload will perform on our test system with the coolers being compared.
We have also found that Cinebench R20 is one of the most demanding workloads for modern processors as its AVX-based workloads pushed CPU usage, package power levels (when unrestricted), and wall system power draws higher than many synthetic tests and to similar (or slightly higher) levels that we see from Blender.
Precision Boost Overdrive Configuration Testing:
Our PBO configuration uses AIDA64 as the stress test. We load all 128 threads using the Stress CPU, Stress FPU, and Stress Cache options for 1800 seconds (30 minutes). This provides what we perceive to be enough soak time for the CPU, CPU cooler, and supplementary hardware to reach a reasonable steady-state temperature level in AIDA64.
We have found that AIDA64 does not seem to be as demanding as Cinebench R20 for the CPU and the system. With that said, one clear benefit of this AIDA64 workload versus the Cinebench R20 alternative for our frequency-fixed testing is the consistent loading.
There is no drop in CPU usage when a frame is rendered, or a specific test is completed in AIDA64. Instead, we are loading the CPU consistently, without interruption, for the entire 30-minute test period.
Test Conditions:
Our ambient temperature is 23°C and typically varies by no more than 1°C above or below that level.
We use two appropriately positioned thermometers (one of which provides two readings) in order to mitigate mistakes from incorrect ambient readings.
Test System:
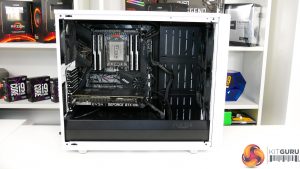
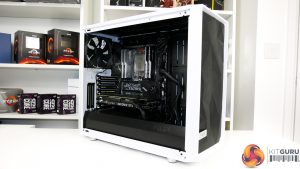
- Processor: AMD Ryzen Threadripper 3990X – PBO and Manual Overclock settings.
- Motherboard: MSI Creator TRX40 (static 4200-4400 RPM chipset fan speed to minimise influence on CPU cooling).
- Memory: 32GB (4x8GB) G.SKILL 3200MHz CL14 DDR4 @ 1.35V.
- Graphics Card: EVGA GTX 1080 Ti SC2 iCX (mounted in a lower slot to minimise influence on CPU cooling).
- Chassis: Fractal Design Meshify S2 (3x 140mm stock fans at 1000 RPM maximum speed – 2x front intake, 1x rear exhaust).
- System Drive: WD Black SN750 500GB.
- CPU Cooler: Varies – all 100% Fan Speed.
- Power Supply: Seasonic Prime TX-1000 80Plus Titanium 1000W.
- Operating System: Windows 10 Pro 64-bit.
Comparison CPU Cooler:
- be quiet! Dark Rock Pro TR4 Dual-tower Air Cooler. Conventional (horizontal) mounting orientation, front-to-back airflow direction, exhausting towards the rear fan.
- Corsair iCUE H115i RGB XT 280mm AIO Liquid Cooler. Roof mounting position, bottom-to-top airflow direction, exhausting towards the roof.
- IceGiant ProSiphon Elite Dual-Fan Thermosiphon Cooler. Conventional (horizontal) mounting orientation, bottom-to-top airflow direction, exhausting towards the roof.
- Noctua NH-U14S TR4-SP3 Single-tower, Single- and Dual-fan Air Cooler. Conventional (horizontal) mounting orientation, front-to-back airflow direction, exhausting towards the rear fan.
Test Software:
- Cinebench R20 – All-core rendering benchmark with periodic drops in CPU load between completed frame renders.
- AIDA64 – Multi-core stress test for CPU, FPU, and Caches.
- HWiNFO – System and CPU sensor monitoring. Data logged using 2000 ms polling period.
- CPUID HWMonitor – System and CPU sensor monitoring.
- Ryzen Master – CPU operation monitoring.
- CPU-Z – CPU clock speed and voltage monitoring.
 KitGuru KitGuru.net – Tech News | Hardware News | Hardware Reviews | IOS | Mobile | Gaming | Graphics Cards


