
For our fourth RTX 3080 review, our attention turns to ASUS and one of its custom designs. Rather than a look at the ASUS ROG Strix model, however, the card in for review today is the TUF Gaming RTX 3080 OC. While not as premium an offering as the upcoming ROG Strix card, the TUF 3080 still sports an all-aluminium shroud, on-board dual-BIOS functionality as well as a factory overclocked core. With an MSRP of £689, it's certainly ticking a lot of boxes on paper, but just how good is it?
First of all, we are clearly aware that finding stock of any RTX 3080 is difficult at the moment, and pre-order prices seem to have been increased over the MSRPs at several retailers. That can make an objective review tricky, but ASUS has explicitly told us the MSRP for the TUF Gaming RTX 3080 OC is £689, so that is the price we will use throughout this review. We don't know when cards will actually be in stock to buy at that price, but at least two retailers we have seen (Currys and AWD-IT) are using the MSRP price for their listings, the cards are just not available.
We contacted ASUS UK about the supply issues and were sent the follow statement, copied verbatim:
“ASUS is delighted to see the interest in their new RTX 30 series range and hopes that all who were able to purchase a card enjoy their next generation of ASUS and ROG gaming power. Demand for this stock is high and we will be replenishing stock with our retail partners as soon as possible. Please make sure your pre-order is made with your chosen retailer who will update you when stock will be available.”
Aside from the supply troubles, it's also worth making clear we are reviewing the TUF Gaming RTX 3080 OC edition (TUF-RTX3080-O10G-GAMING), when there is also a non-OC edition (TUF-RTX3080-10G-GAMING) which has an MSRP of £649. The only difference appears to be the clock frequency, as the OC edition – obviously – comes factory overclocked.
| GPU | RTX 3090 | RTX 3080 | RTX 2080 Ti (FE) | RTX 2080 SUPER | RTX 2080 (FE) |
| SMs | 82 | 68 | 68 | 48 | 46 |
| CUDA Cores | 10496 | 8704 | 4352 | 3072 | 2944 |
| Tensor Cores | 328 | 272 | 544 | 384 | 368 |
| RT Cores | 82 | 68 | 68 | 48 | 46 |
| Texture Units | 328 | 272 | 272 | 192 | 184 |
| ROPs | 112 | 96 | 88 | 64 | 64 |
| GPU Boost Clock | 1695 MHz | 1710 MHz | 1635 MHz | 1815 MHz | 1800 MHz |
| Memory Data Rate | 19.5 Gbps | 19 Gbps | 14 Gbps | 15.5 Gbps | 14 Gbps |
| Total Video Memory | 24GB GDDR6X | 10GB GDDR6X | 11GB GDDR6 | 8GB GDDR6 | 8GB GDDR6 |
| Memory Interface | 384-bit | 320-bit | 352-bit | 256-bit | 256-bit |
| Memory Bandwidth | 936 GB/Sec | 760 GB/Sec | 616 GB/sec | 496.1 GB/sec | 448 GB/sec |
| TGP | 350W | 320W | 260W | 250W | 225W |
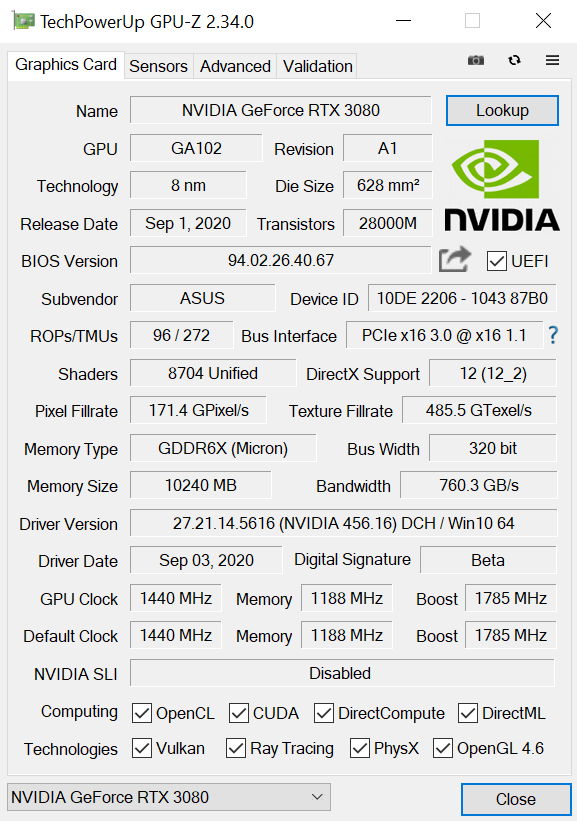
Just before diving into the details, it’s worth reminding ourselves of the key specs for the RTX 3080. Built on Nvidia’s GA102 GPU, fabricated on Samsung’s 8nm process, RTX 3080 houses 8704 CUDA cores, 68 RT Cores and 272 Tensor cores.
A reference board would come clocked at 1710MHz, but as we are reviewing the TUF Gaming OC edition, this model has a rated boost clock of 1785MHz. We would still expect GPU Boost to bring actual frequency well above those levels, but we will look at that later in the review.
The 10GB VRAM is provided thanks to Micron’s new GDDR6X memory. Operating at 19Gbps, over a 320-bit bus this gives total memory bandwidth of 760GB/s.
All of those cores, fast memory and factory overclock come at a cost, however, and that is power draw. Reference TGP for a RTX 3080 is 320W, but ASUS has bumped this up to 340W, making it one of the most power-hungry GPUs I have ever tested.
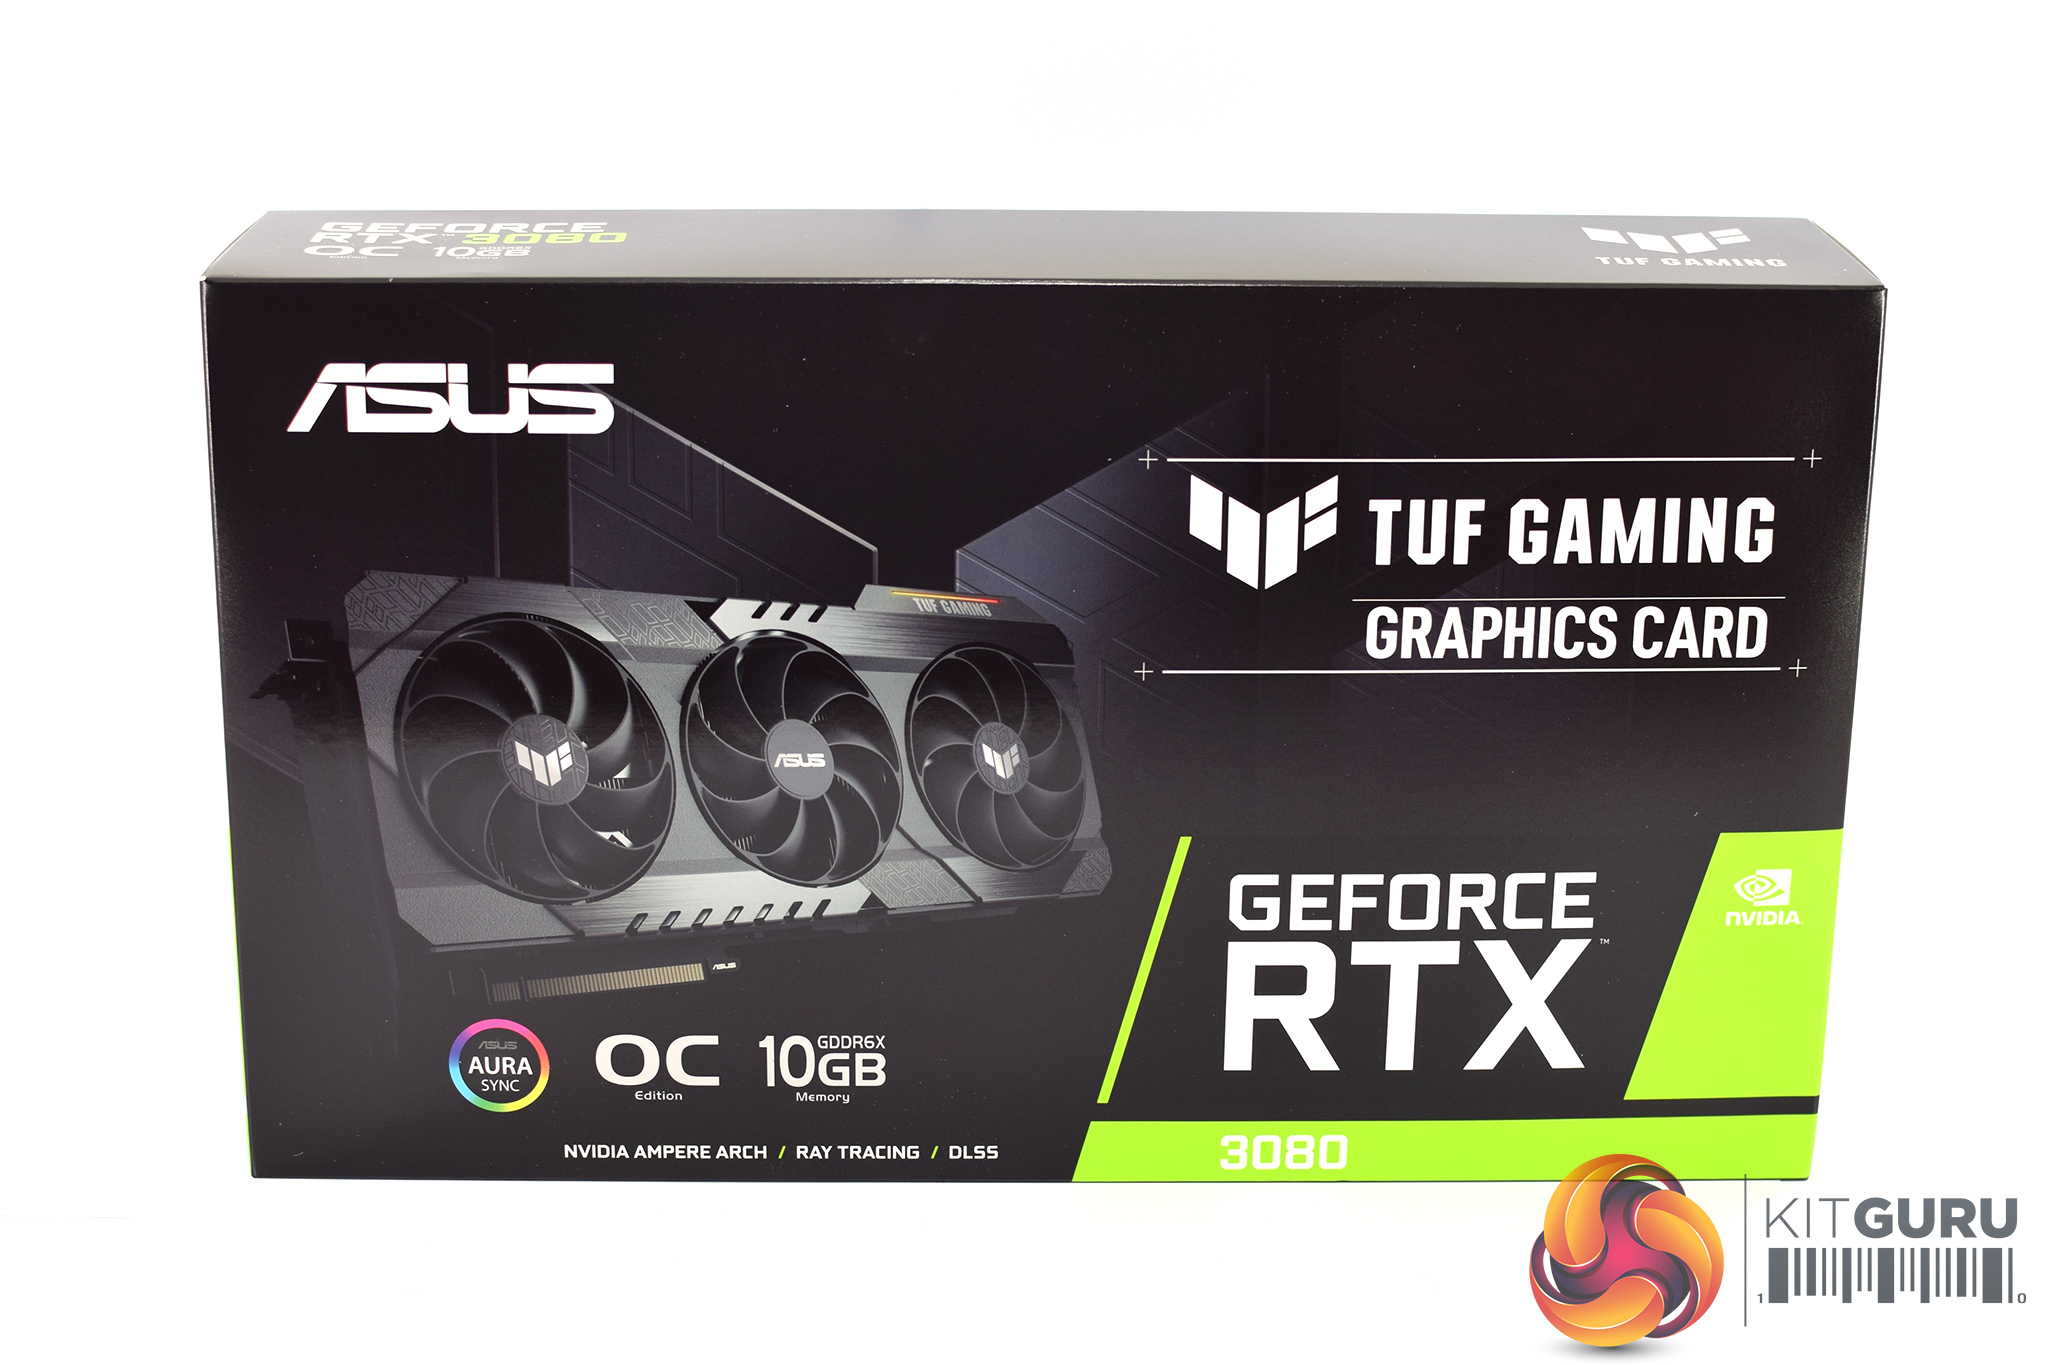
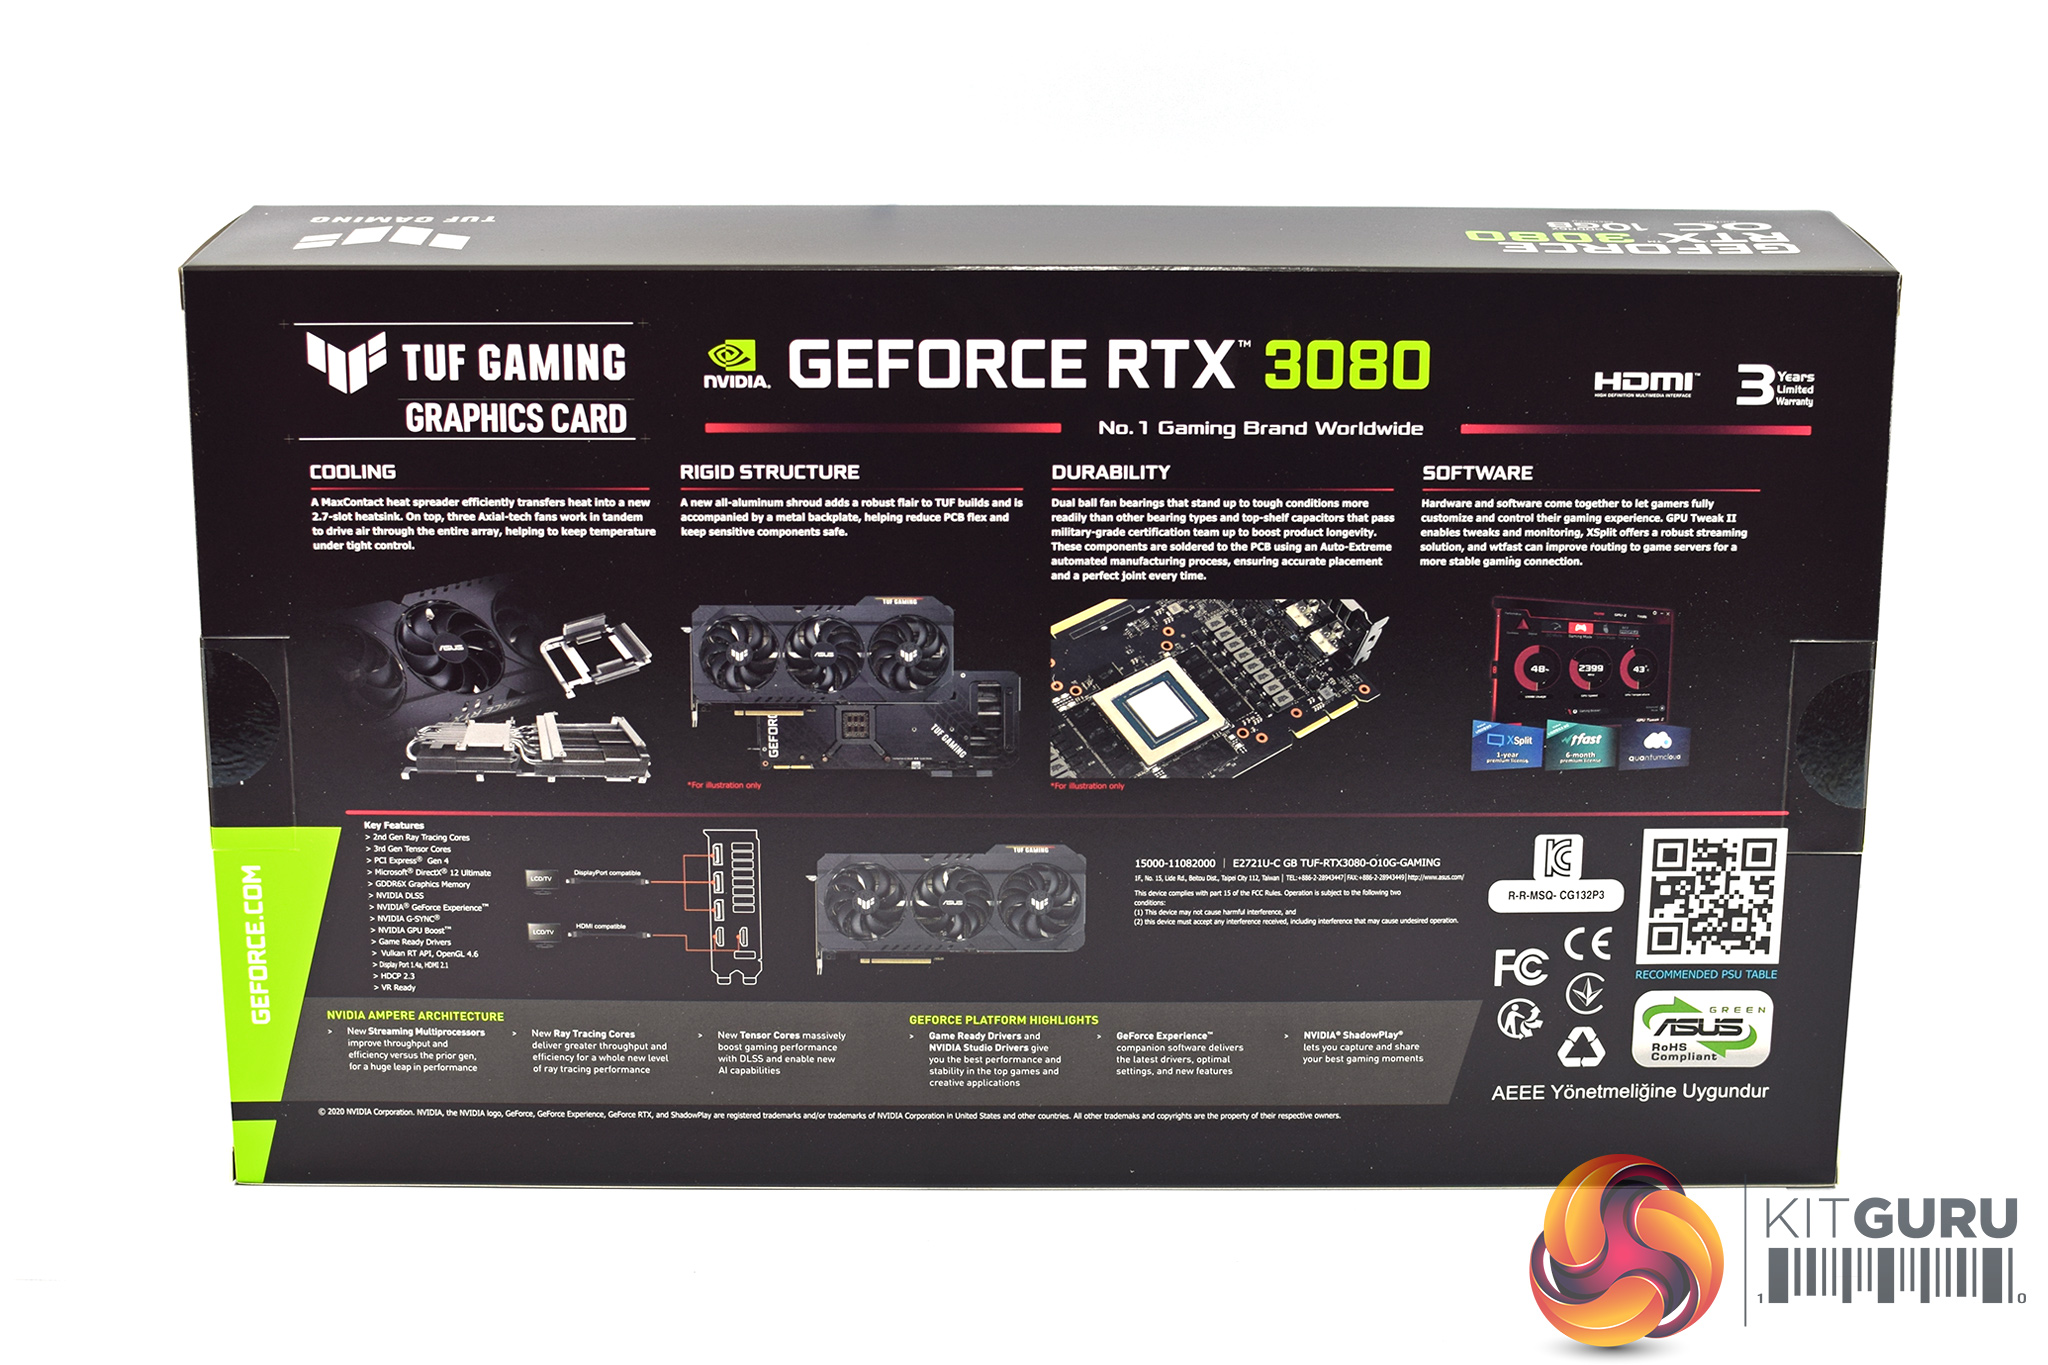
The ASUS TUF Gaming RTX 3080 OC ships in a black box, with an image of the graphics card visible on the front.
On the back, ASUS highlights a number of key features, including the new cooler design, the aluminium shroud, as well as the GPU Tweak II software.
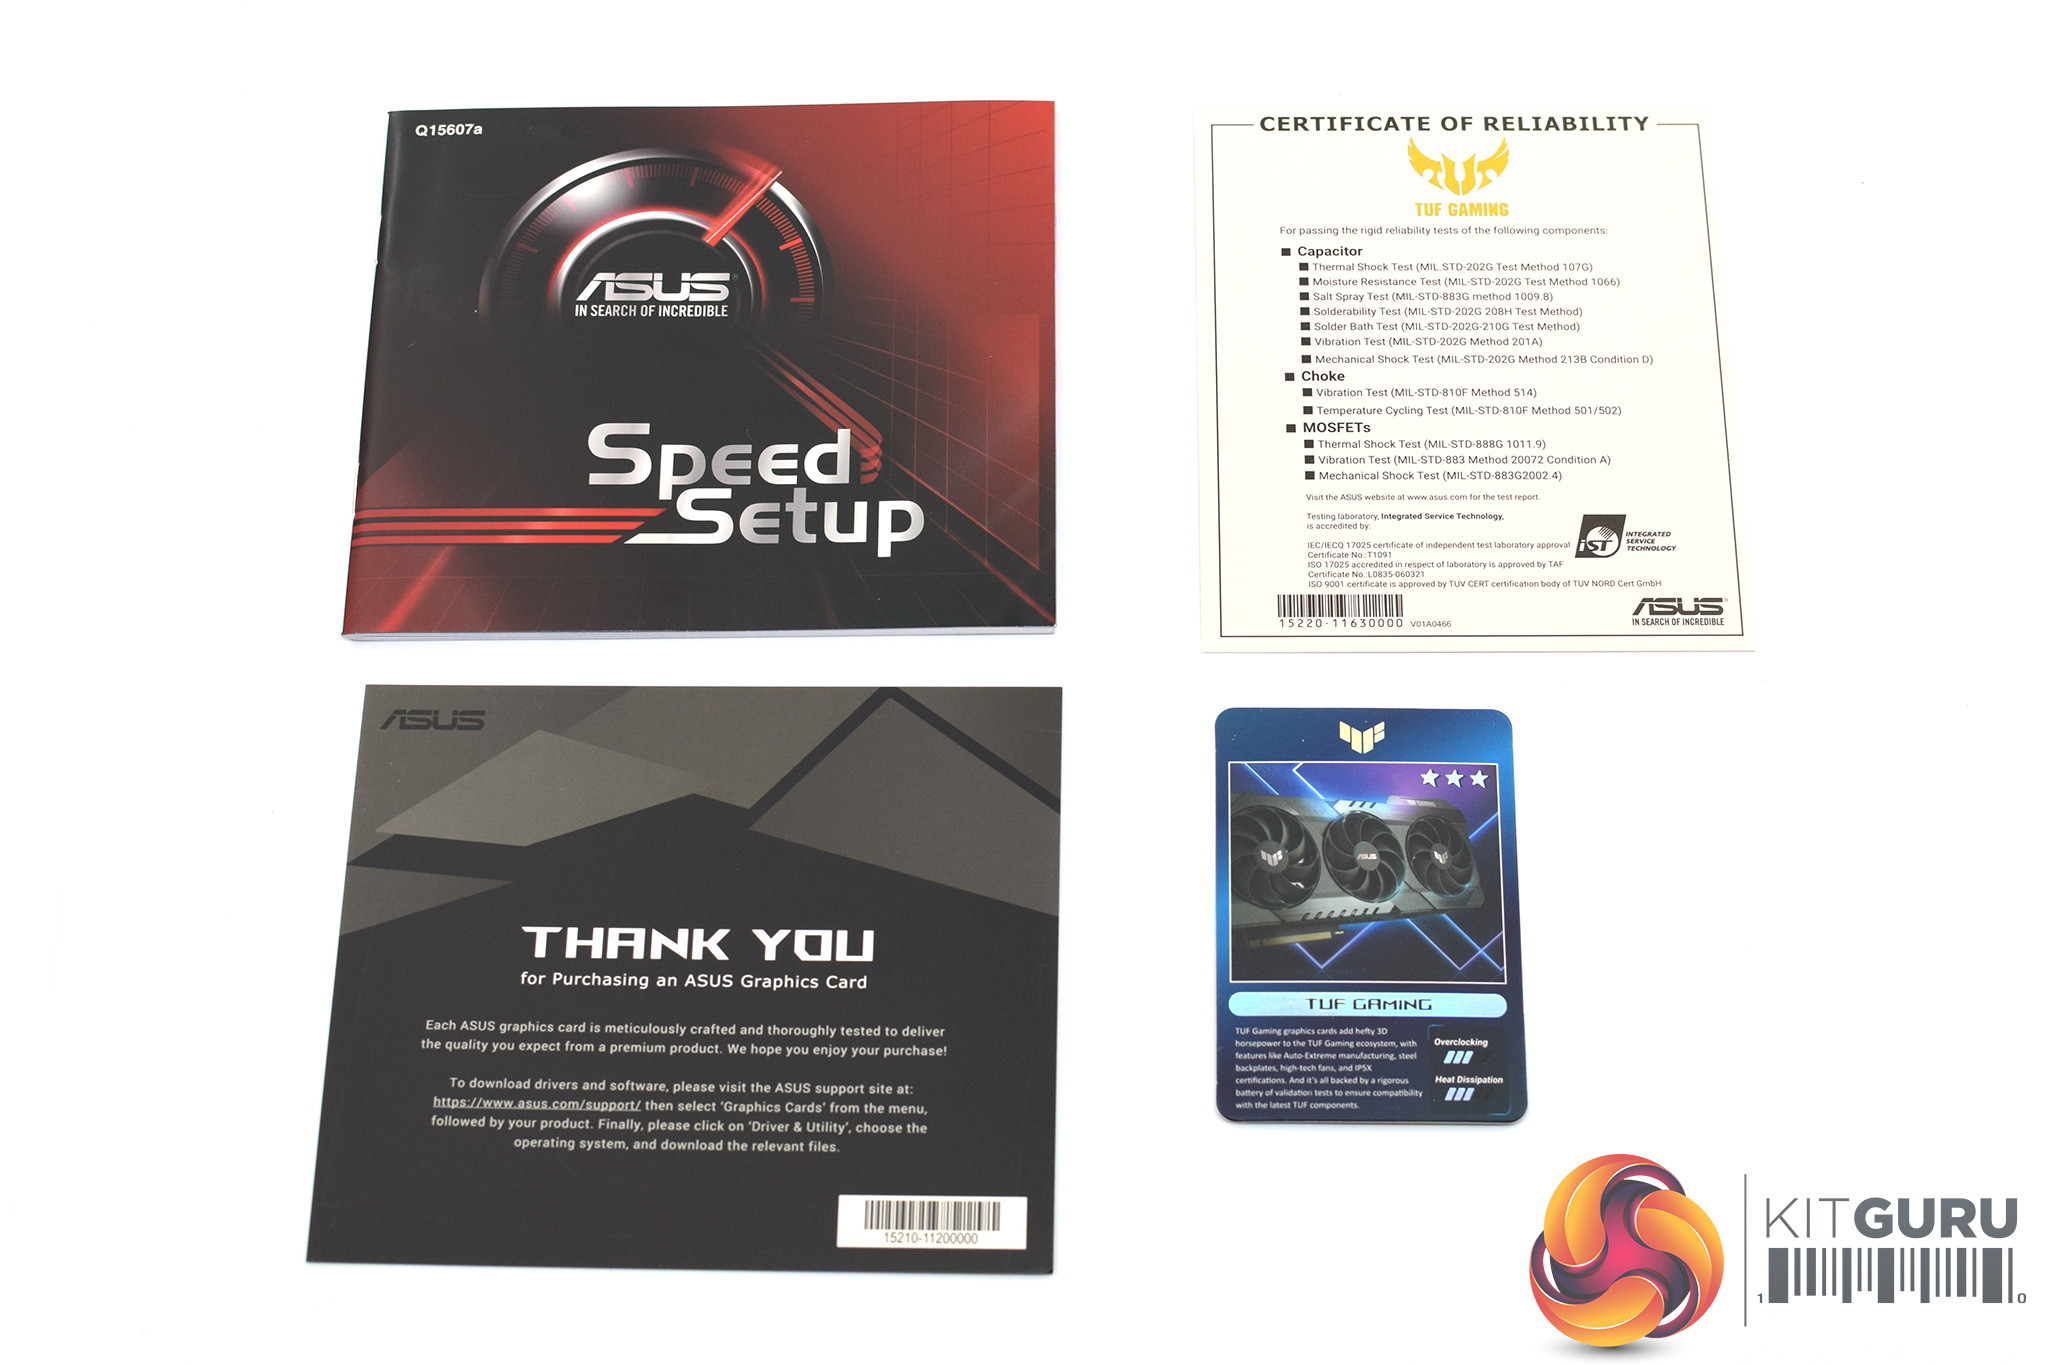
Inside the box, we find four small leaflets, consisting of a quick start guide, thank you note, and what appears to be some sort of playing card that rates the TUF's overclocking and heat dissipation at 3/5. Potentially a strange inclusion but we will save judgement until we have tested the card…
The final document is a certificate of reliability, outlining the various ways the TUF graphics card has been tested in line with industry standards.
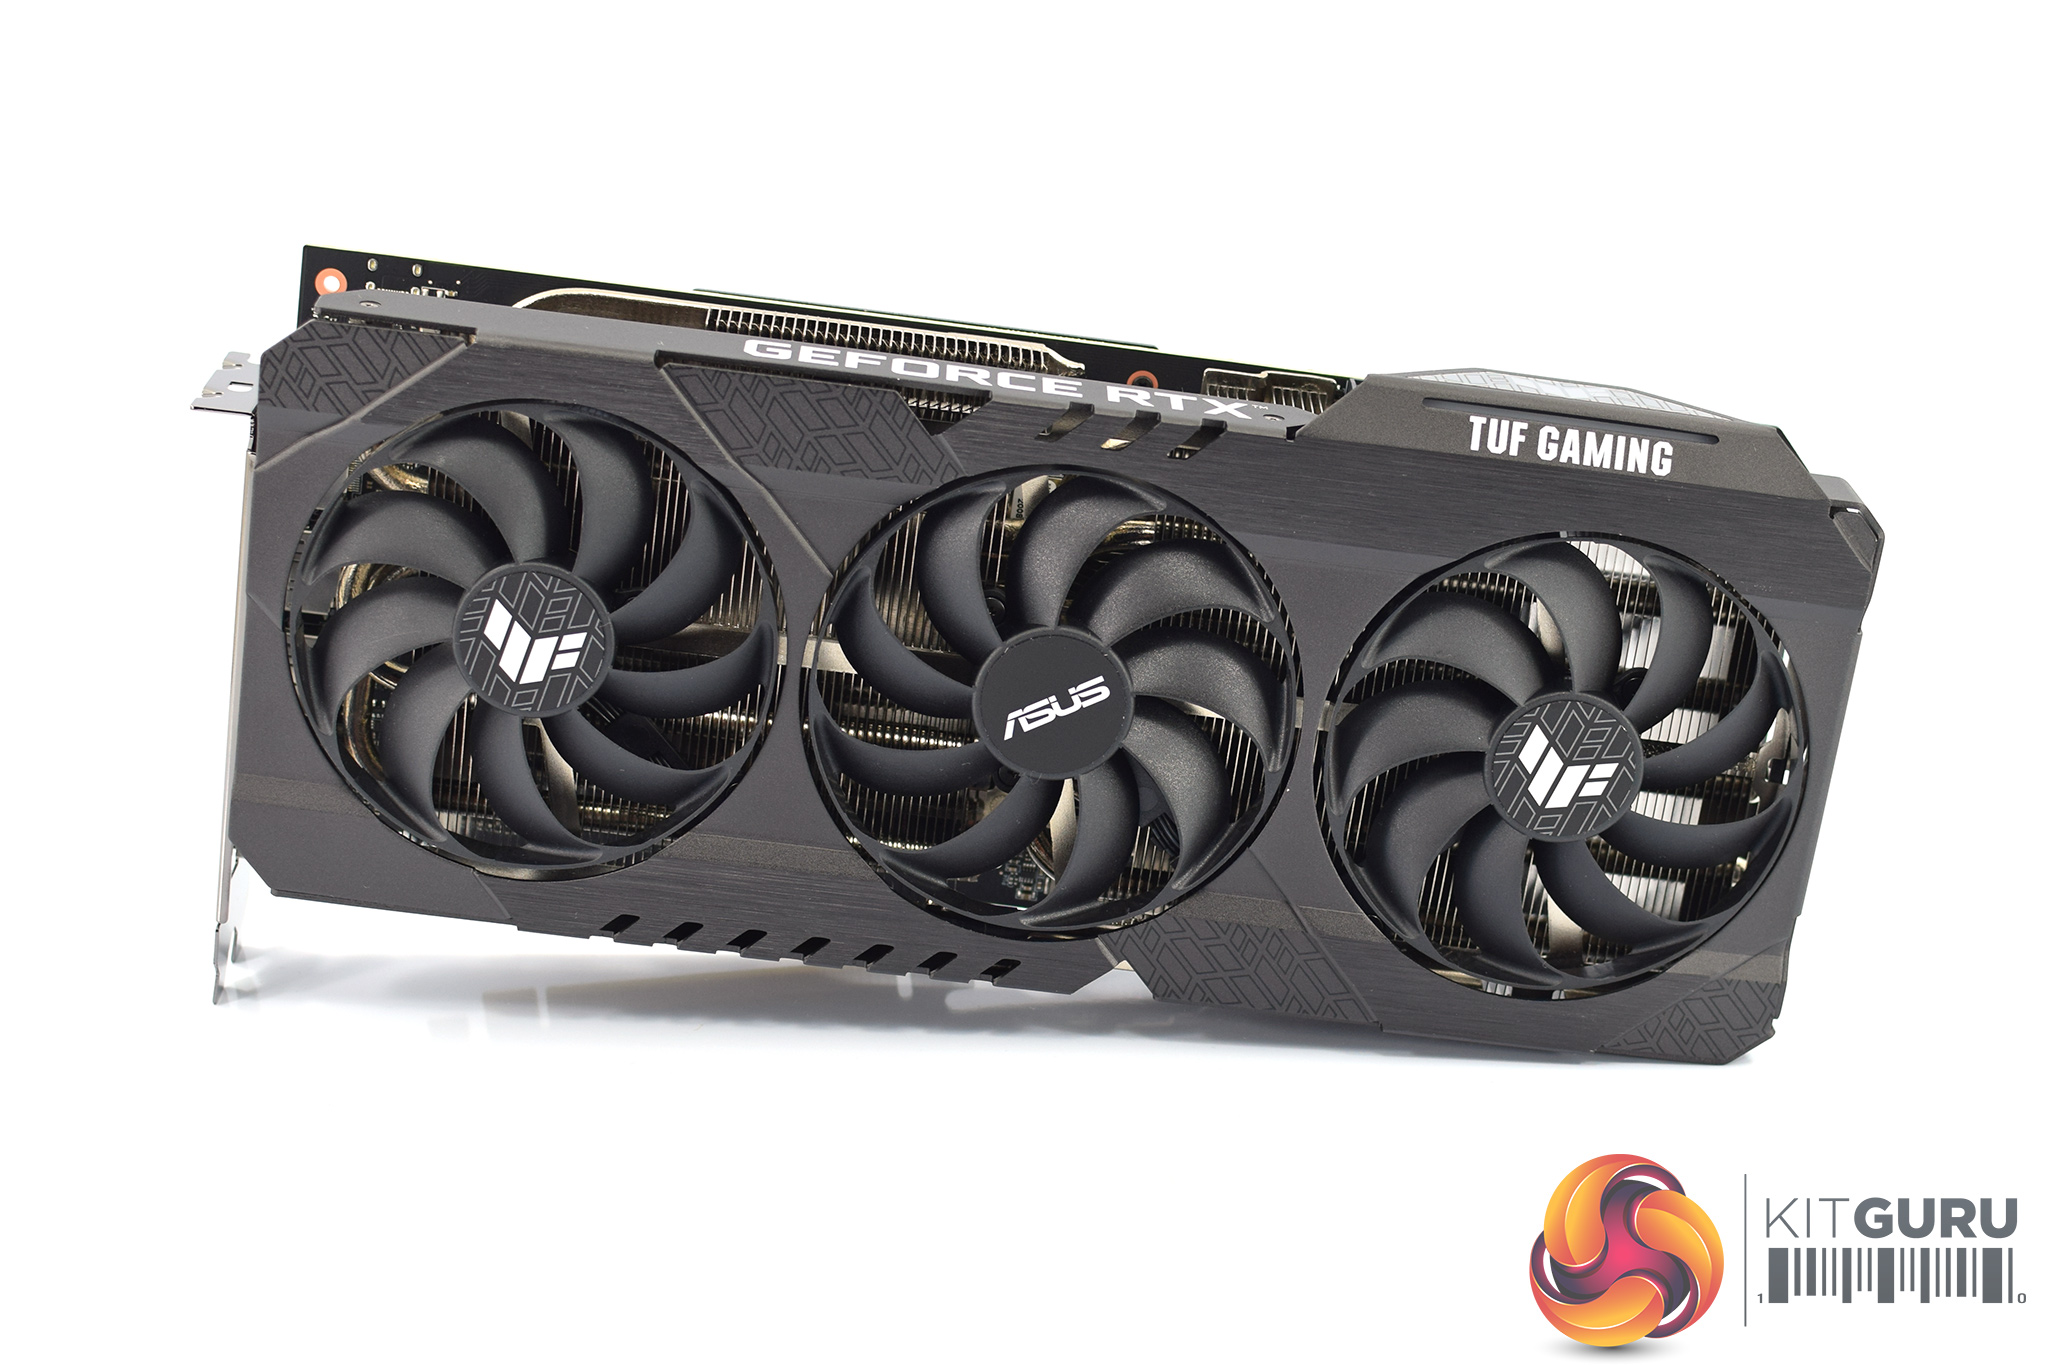
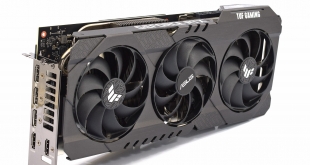
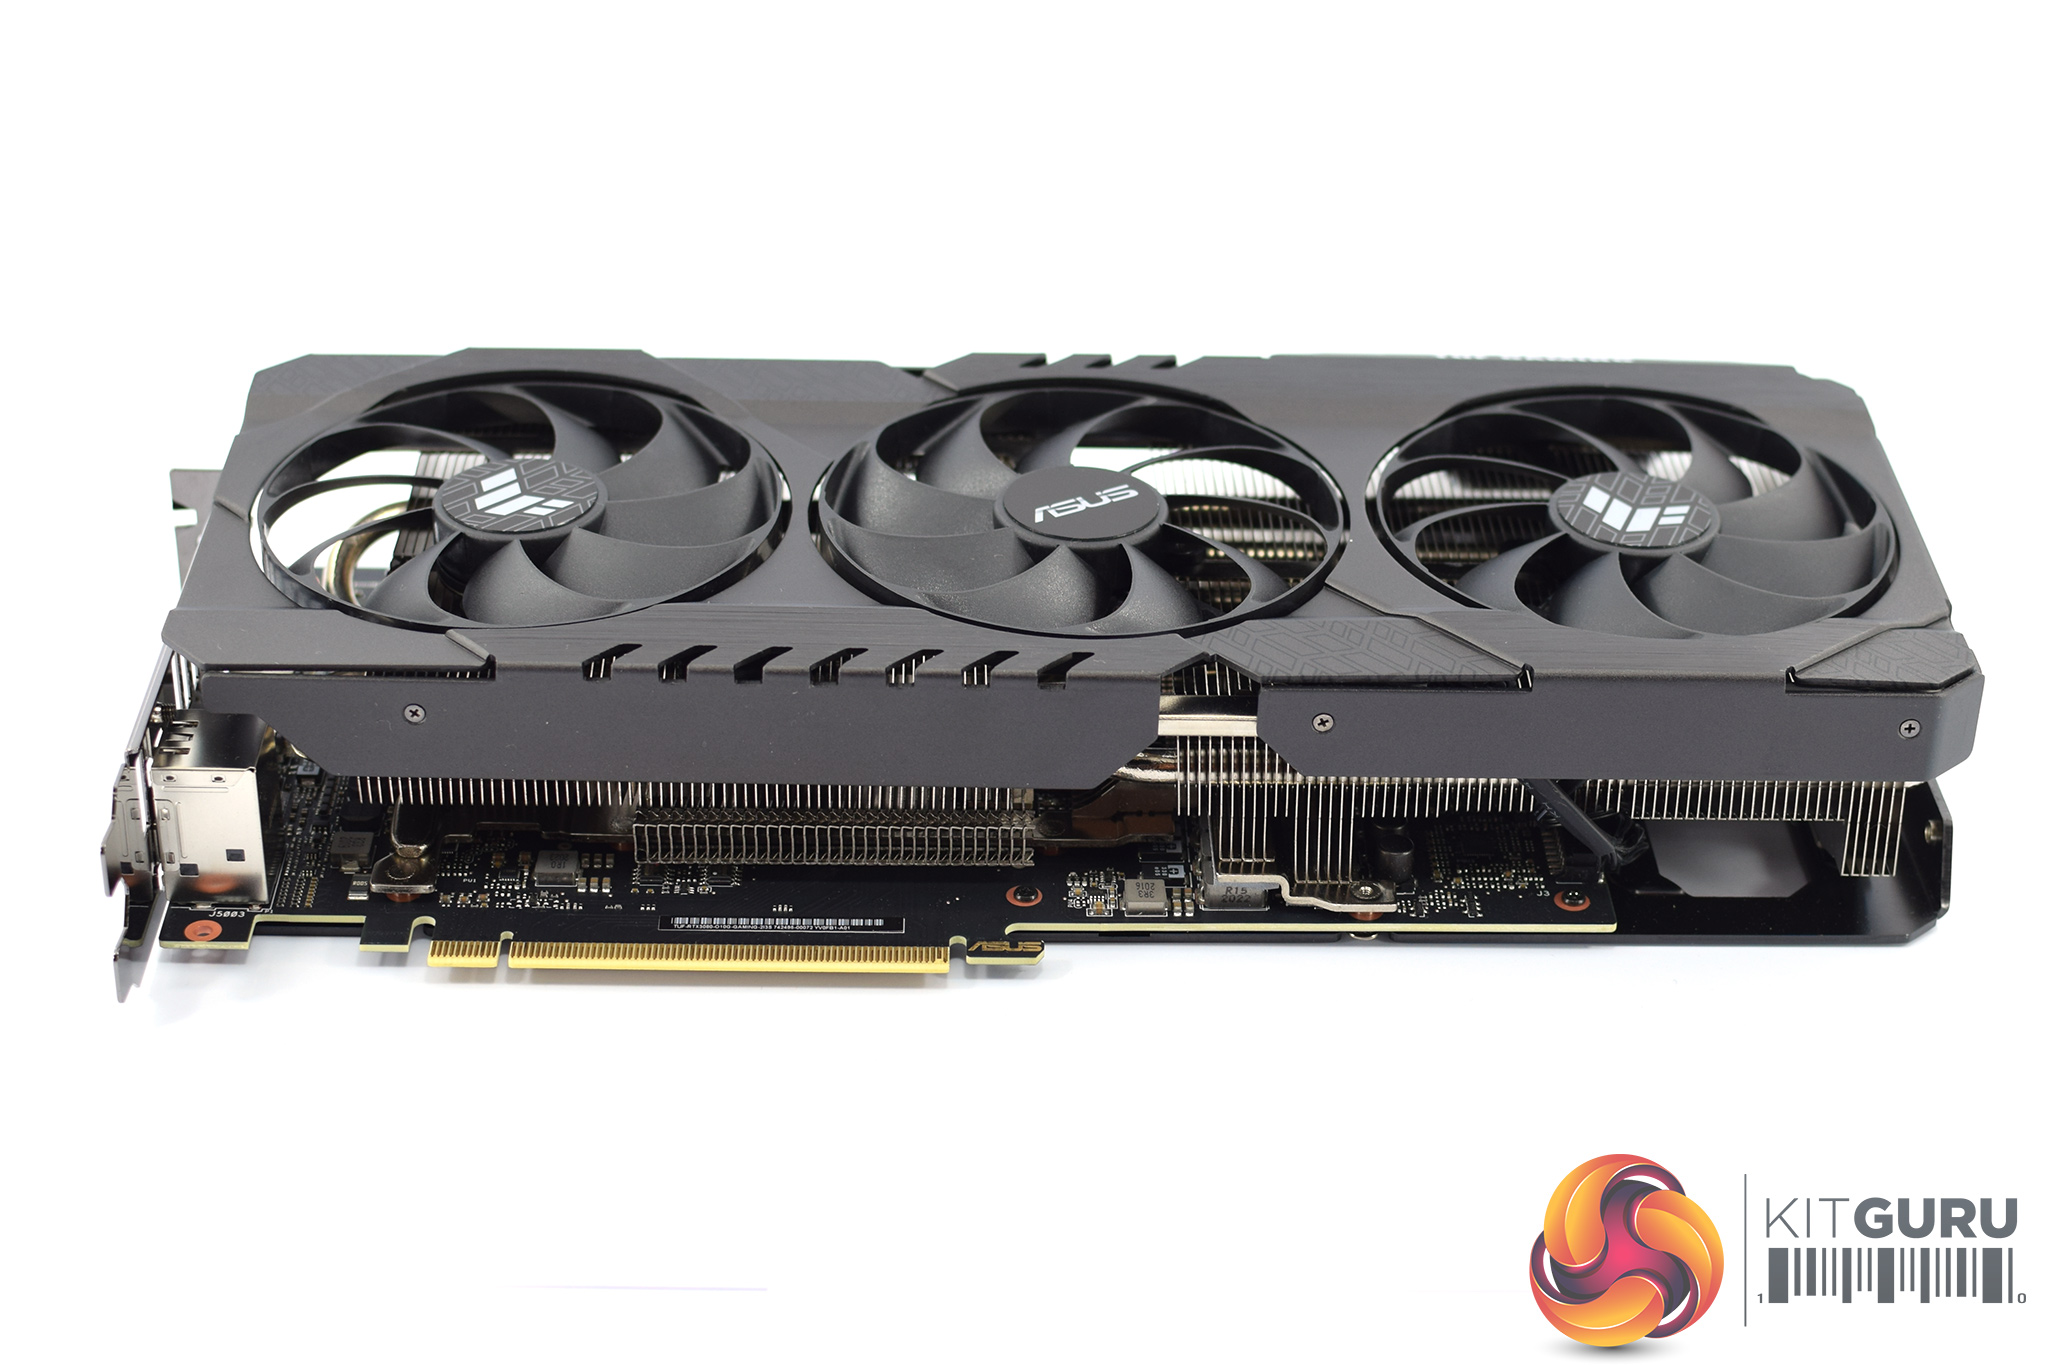
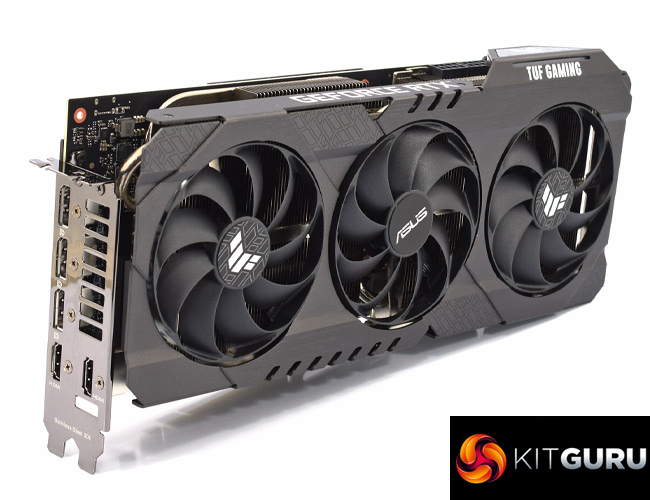
As for the graphics card itself, the TUF Gaming creates a positive first impression thanks to its all-aluminium shroud. This isn't something we typically see from AIB cards, and while it may not have the same sleek appearance as the Founders Edition (though that is obviously subjective), it feels very solid and premium in the hand. It's a definite plus-point for the TUF considering the majority of its rivals use plastic shrouds.
Moving onto the three fans, these see the return of ASUS' Axial-tech fan design that debuted with the RTX 20-series cards. Now, however, ASUS claims to have improved these further, as the company says the new design is both quieter and capable of delivering increased airflow compared to the previous generation of Axial-tech fans. Additionally, the central fan now spins in reverse relative to the outer fans, something we have seen from a number of Gigabyte graphics cards over the last couple of years, and this should reduce overall airflow turbulence.
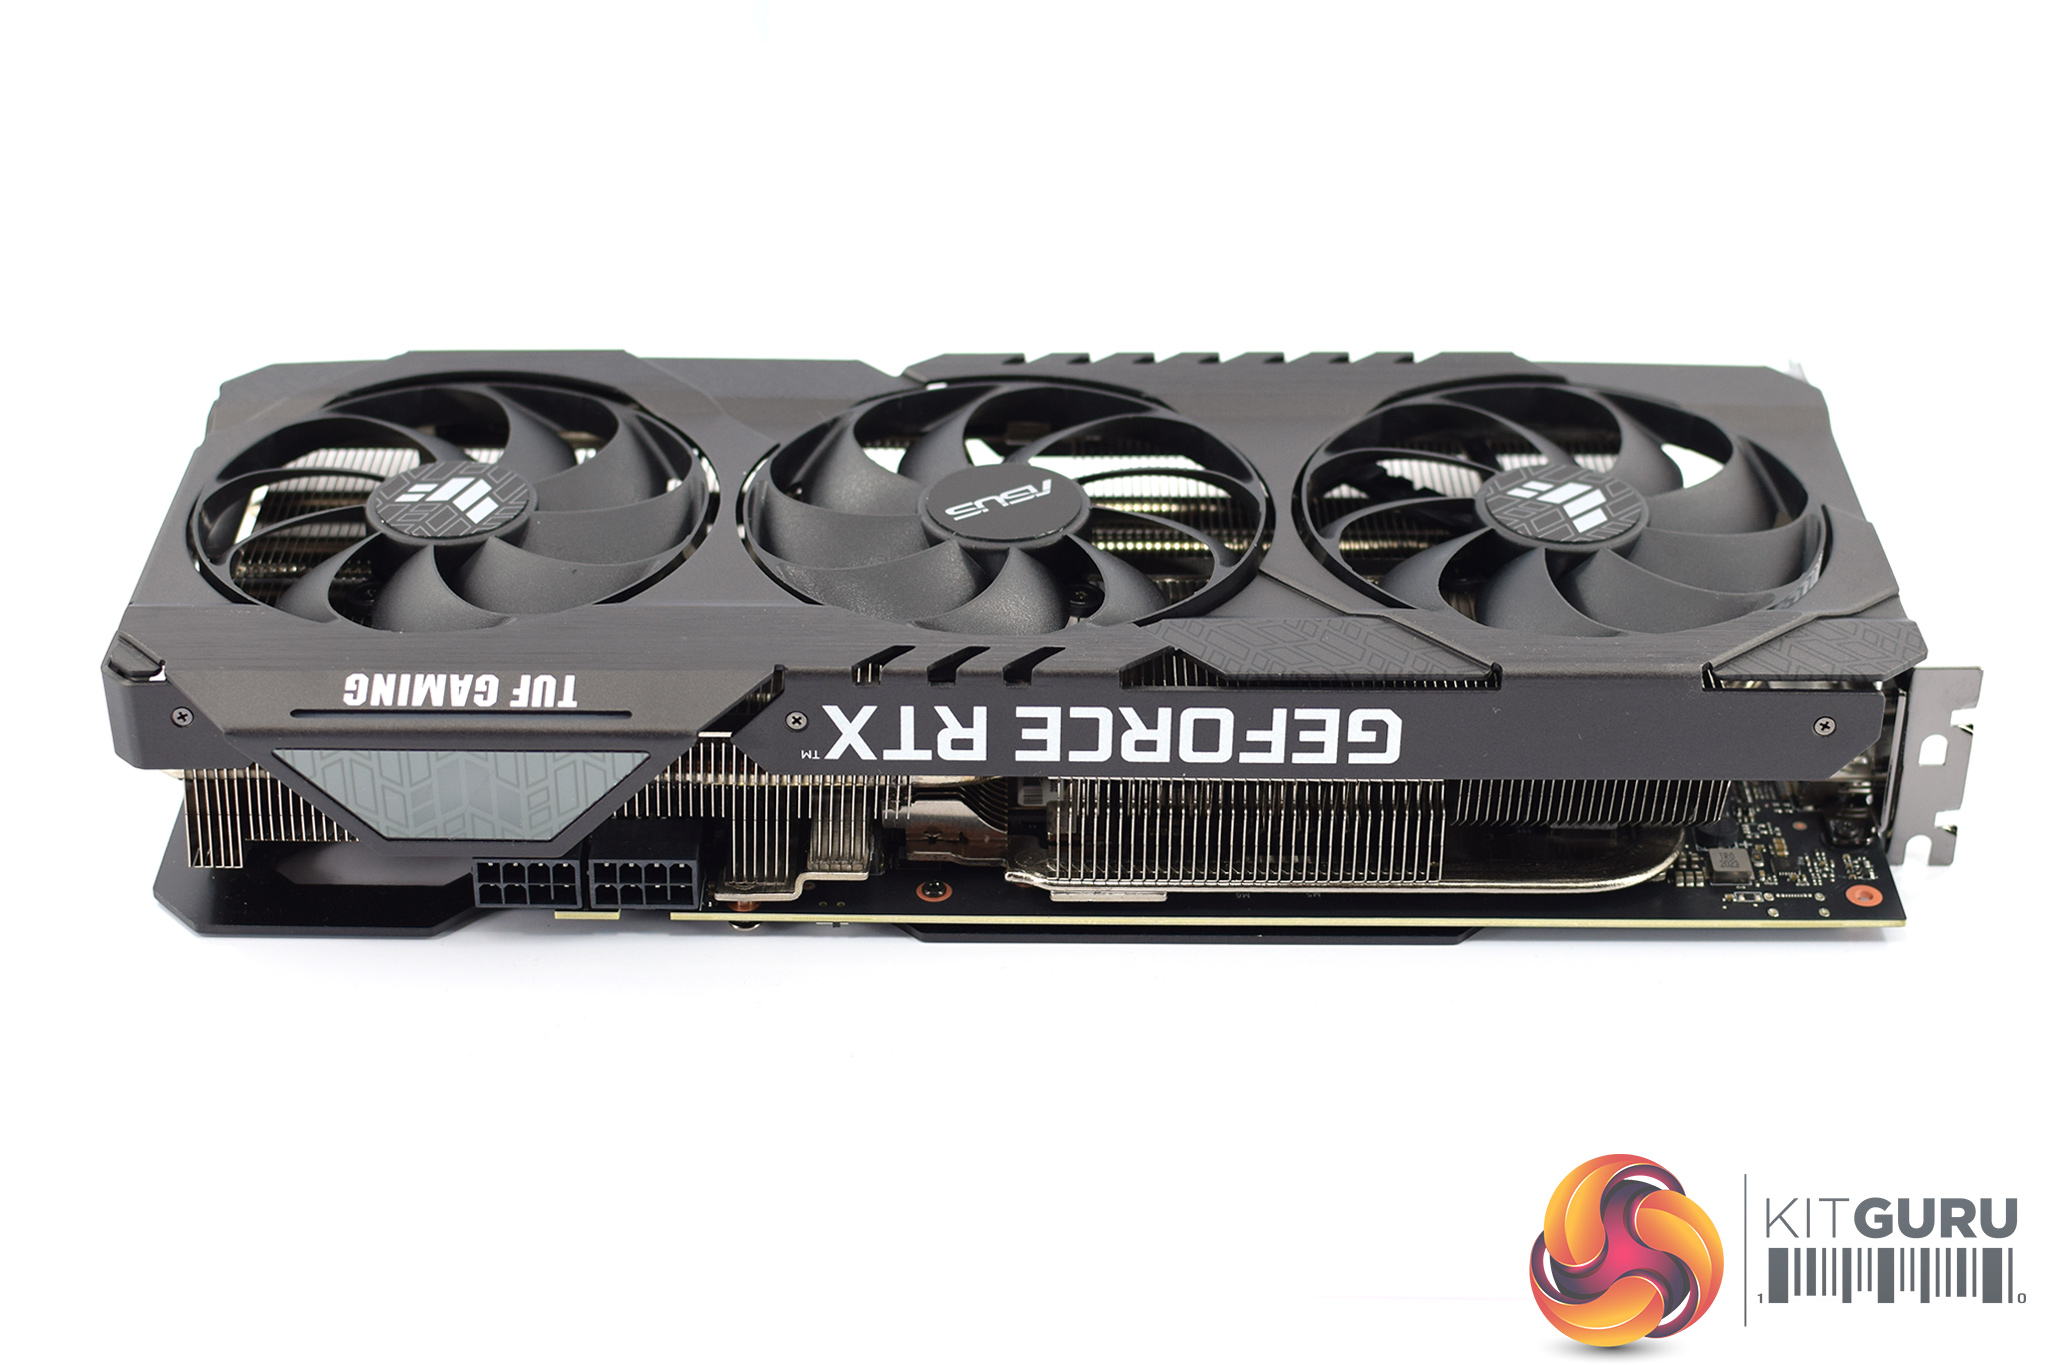
As with all the RTX 3080 cards we have tested, the TUF Gaming is a big unit. It measures in at 299.9 x 126.9 x 51.7mm, meaning it's a two-and-a-half slot design that is effectively 30cm long. As ever, do check this will actually fit in your case.
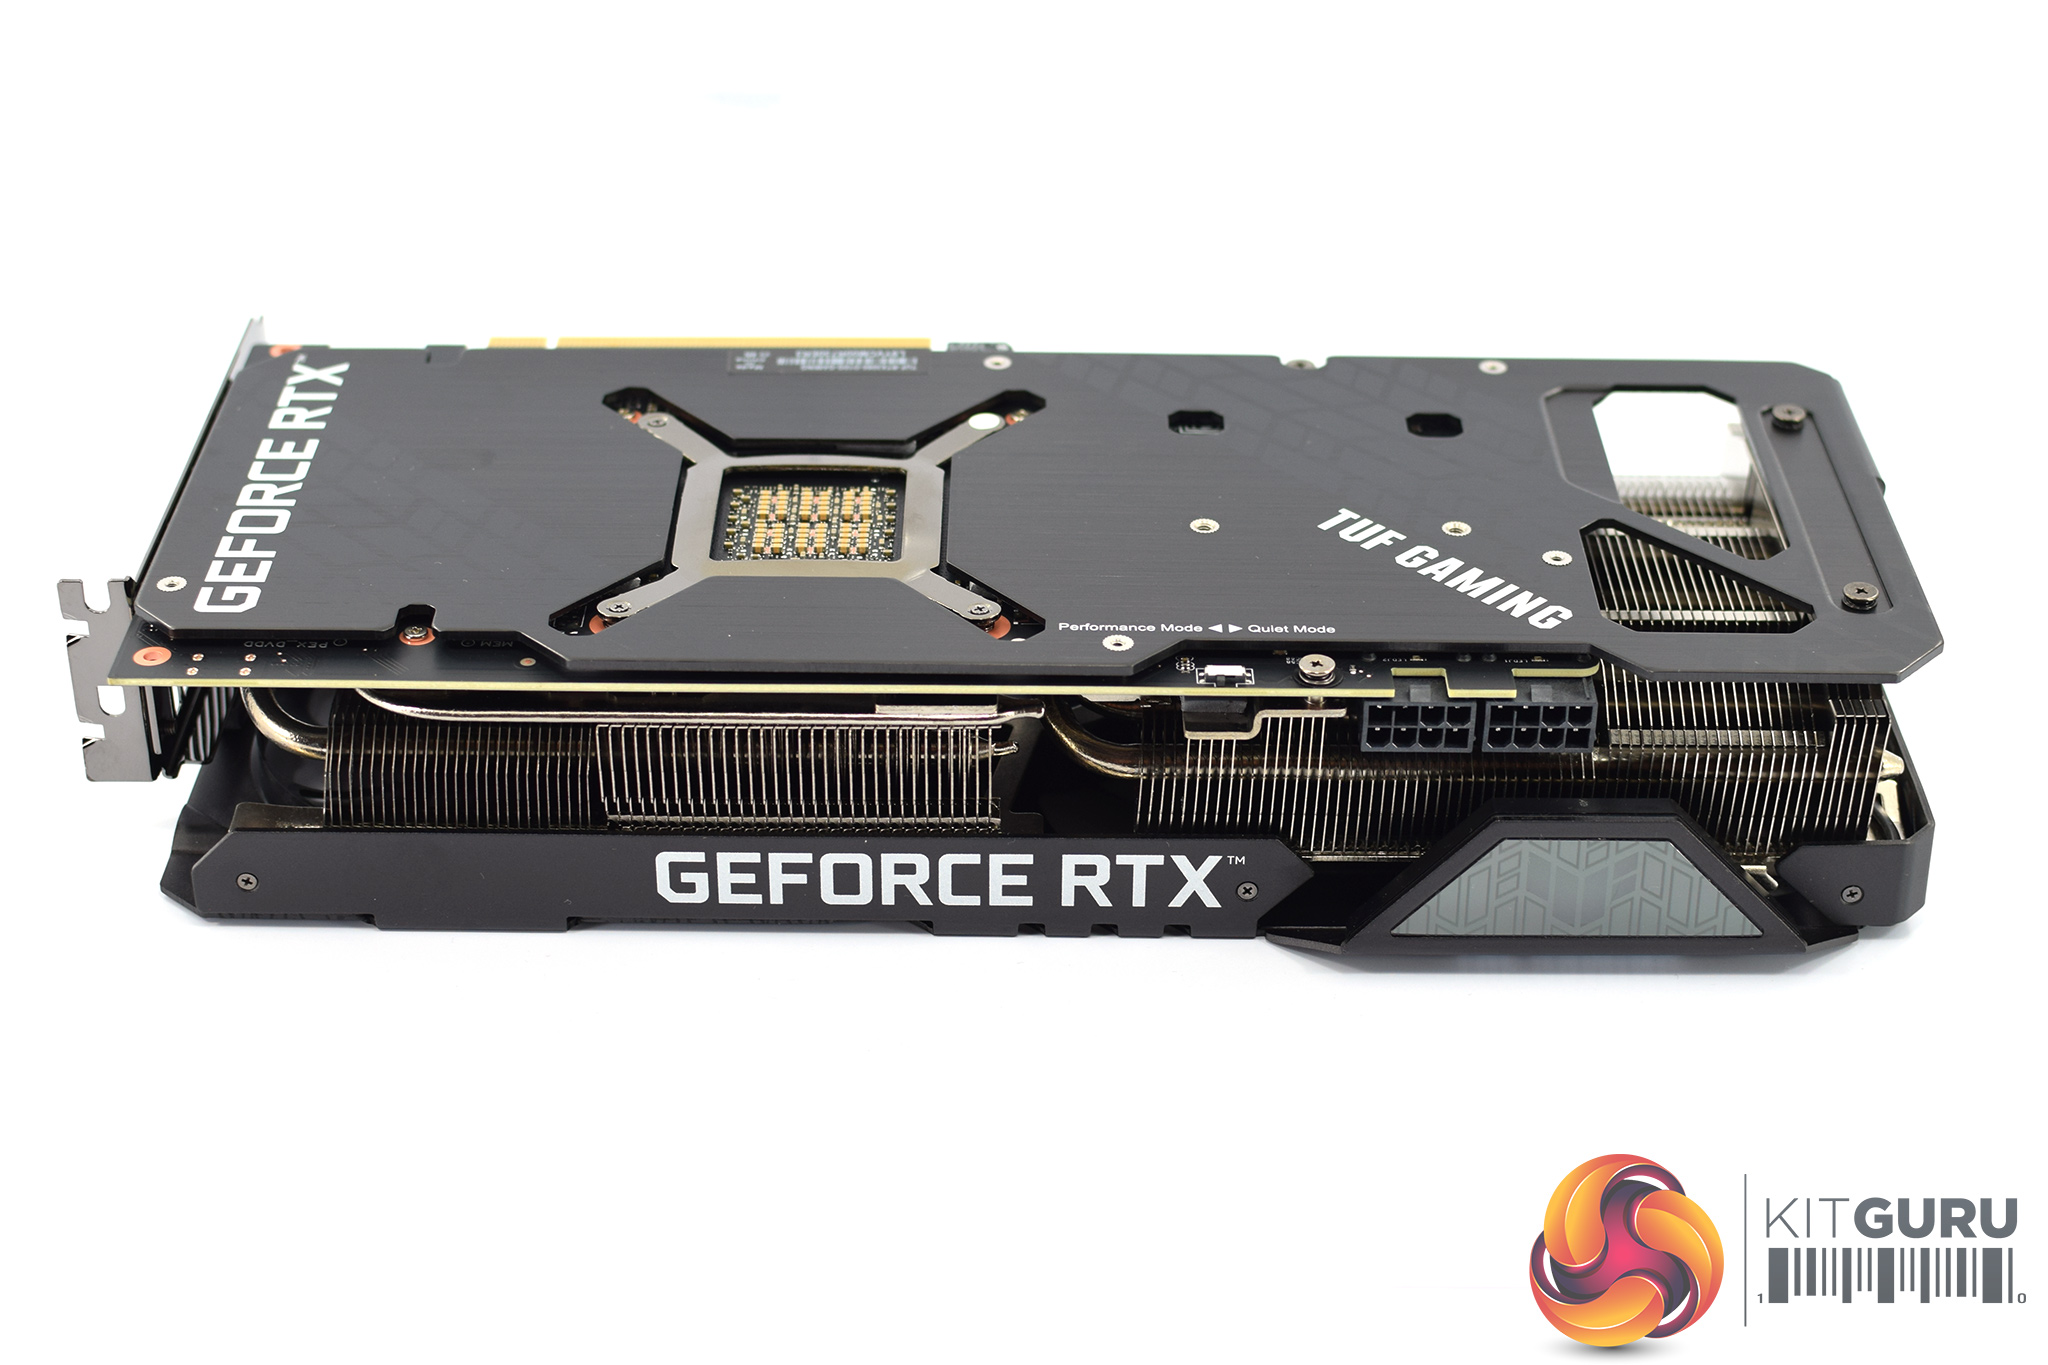
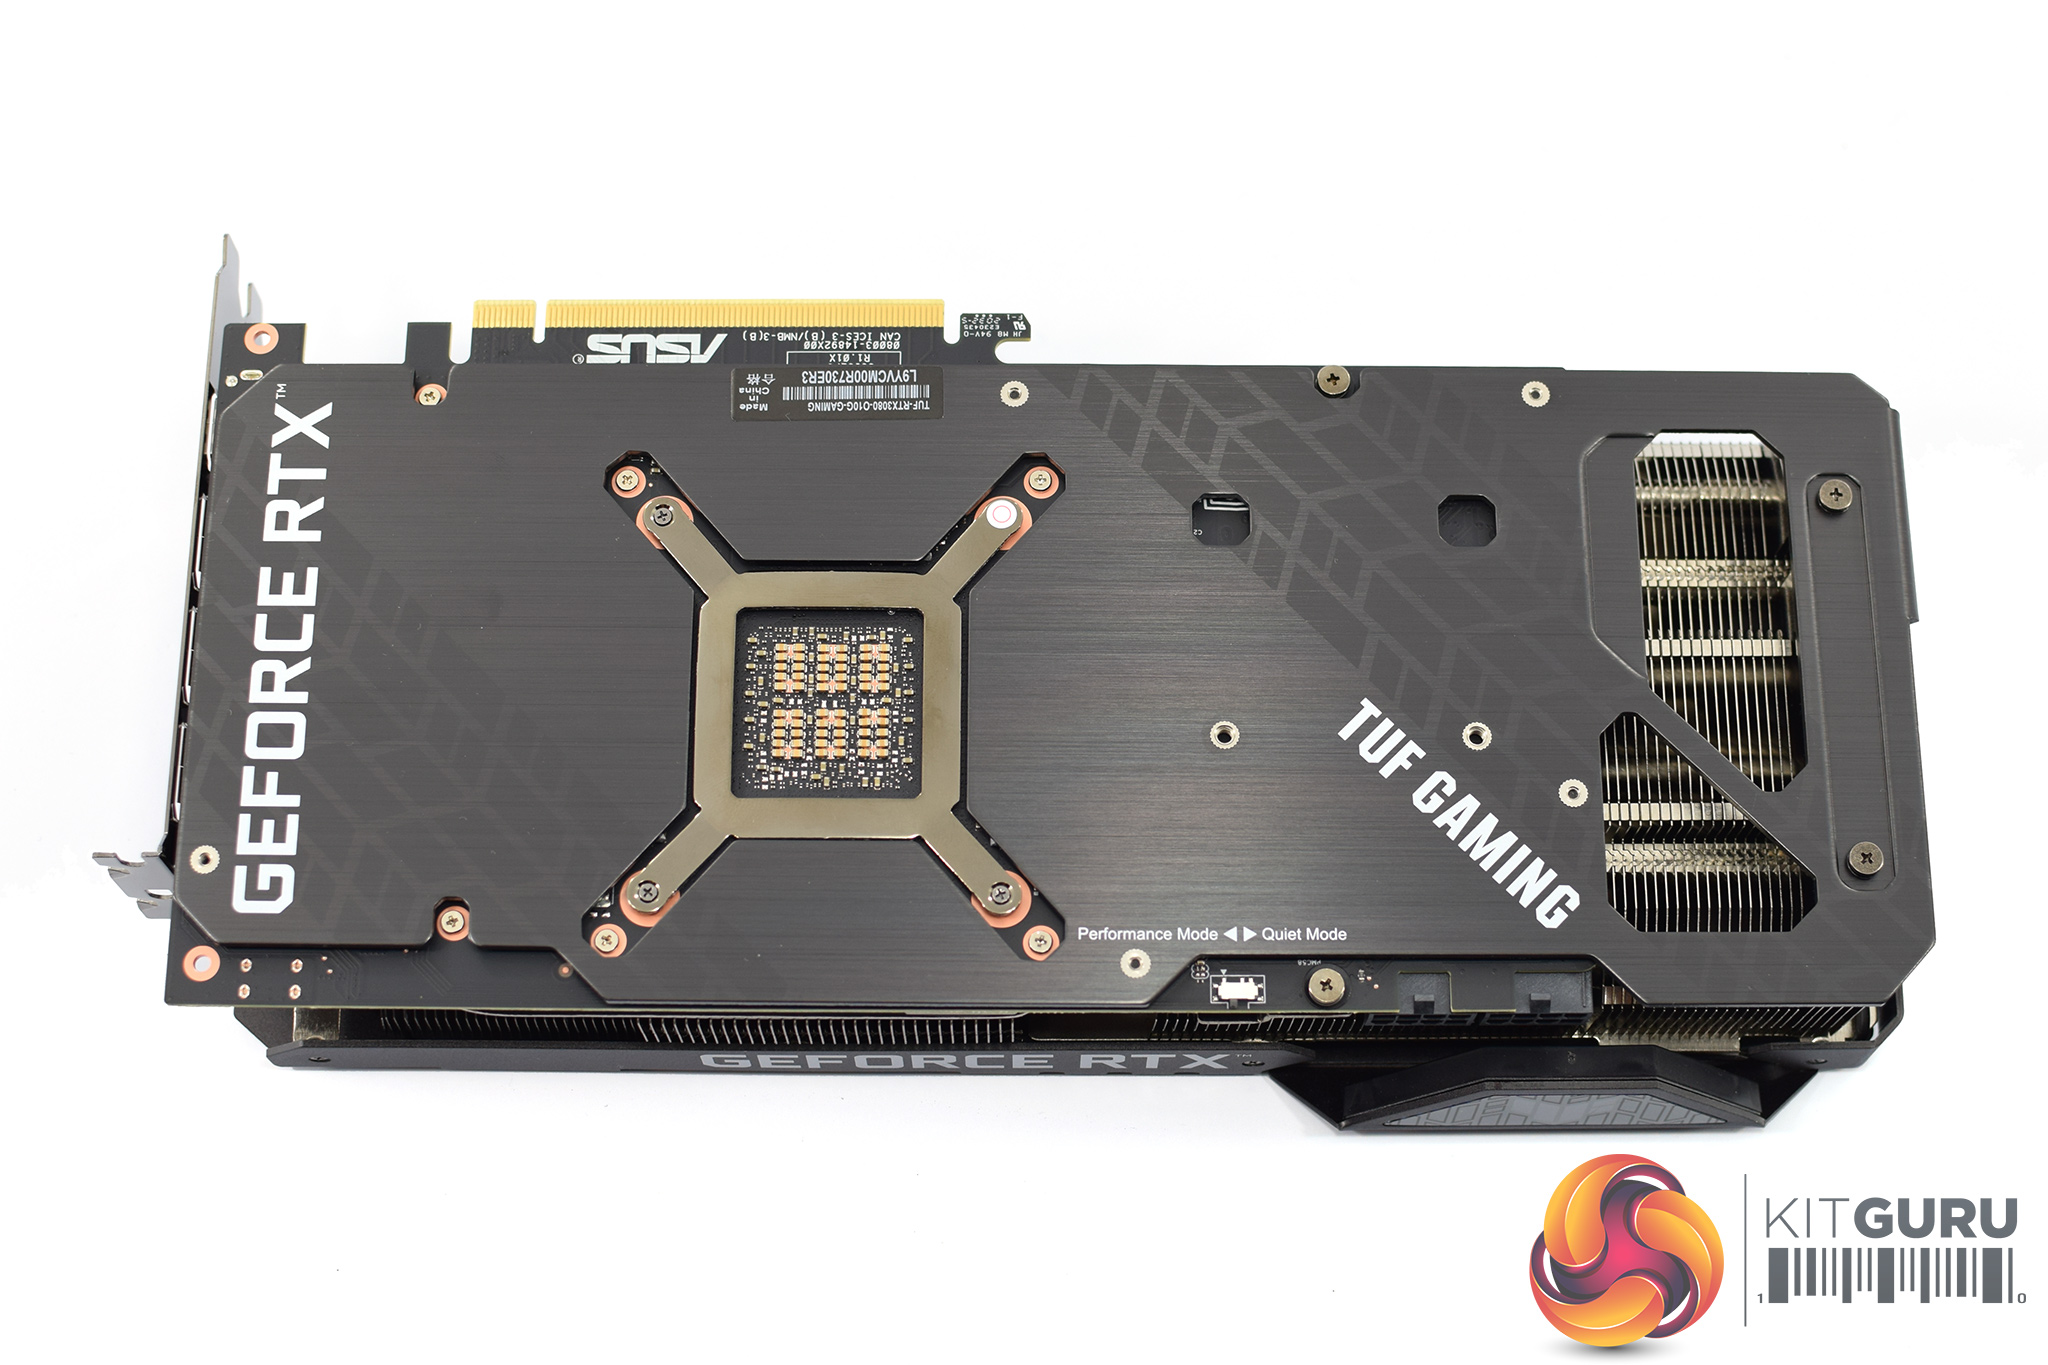
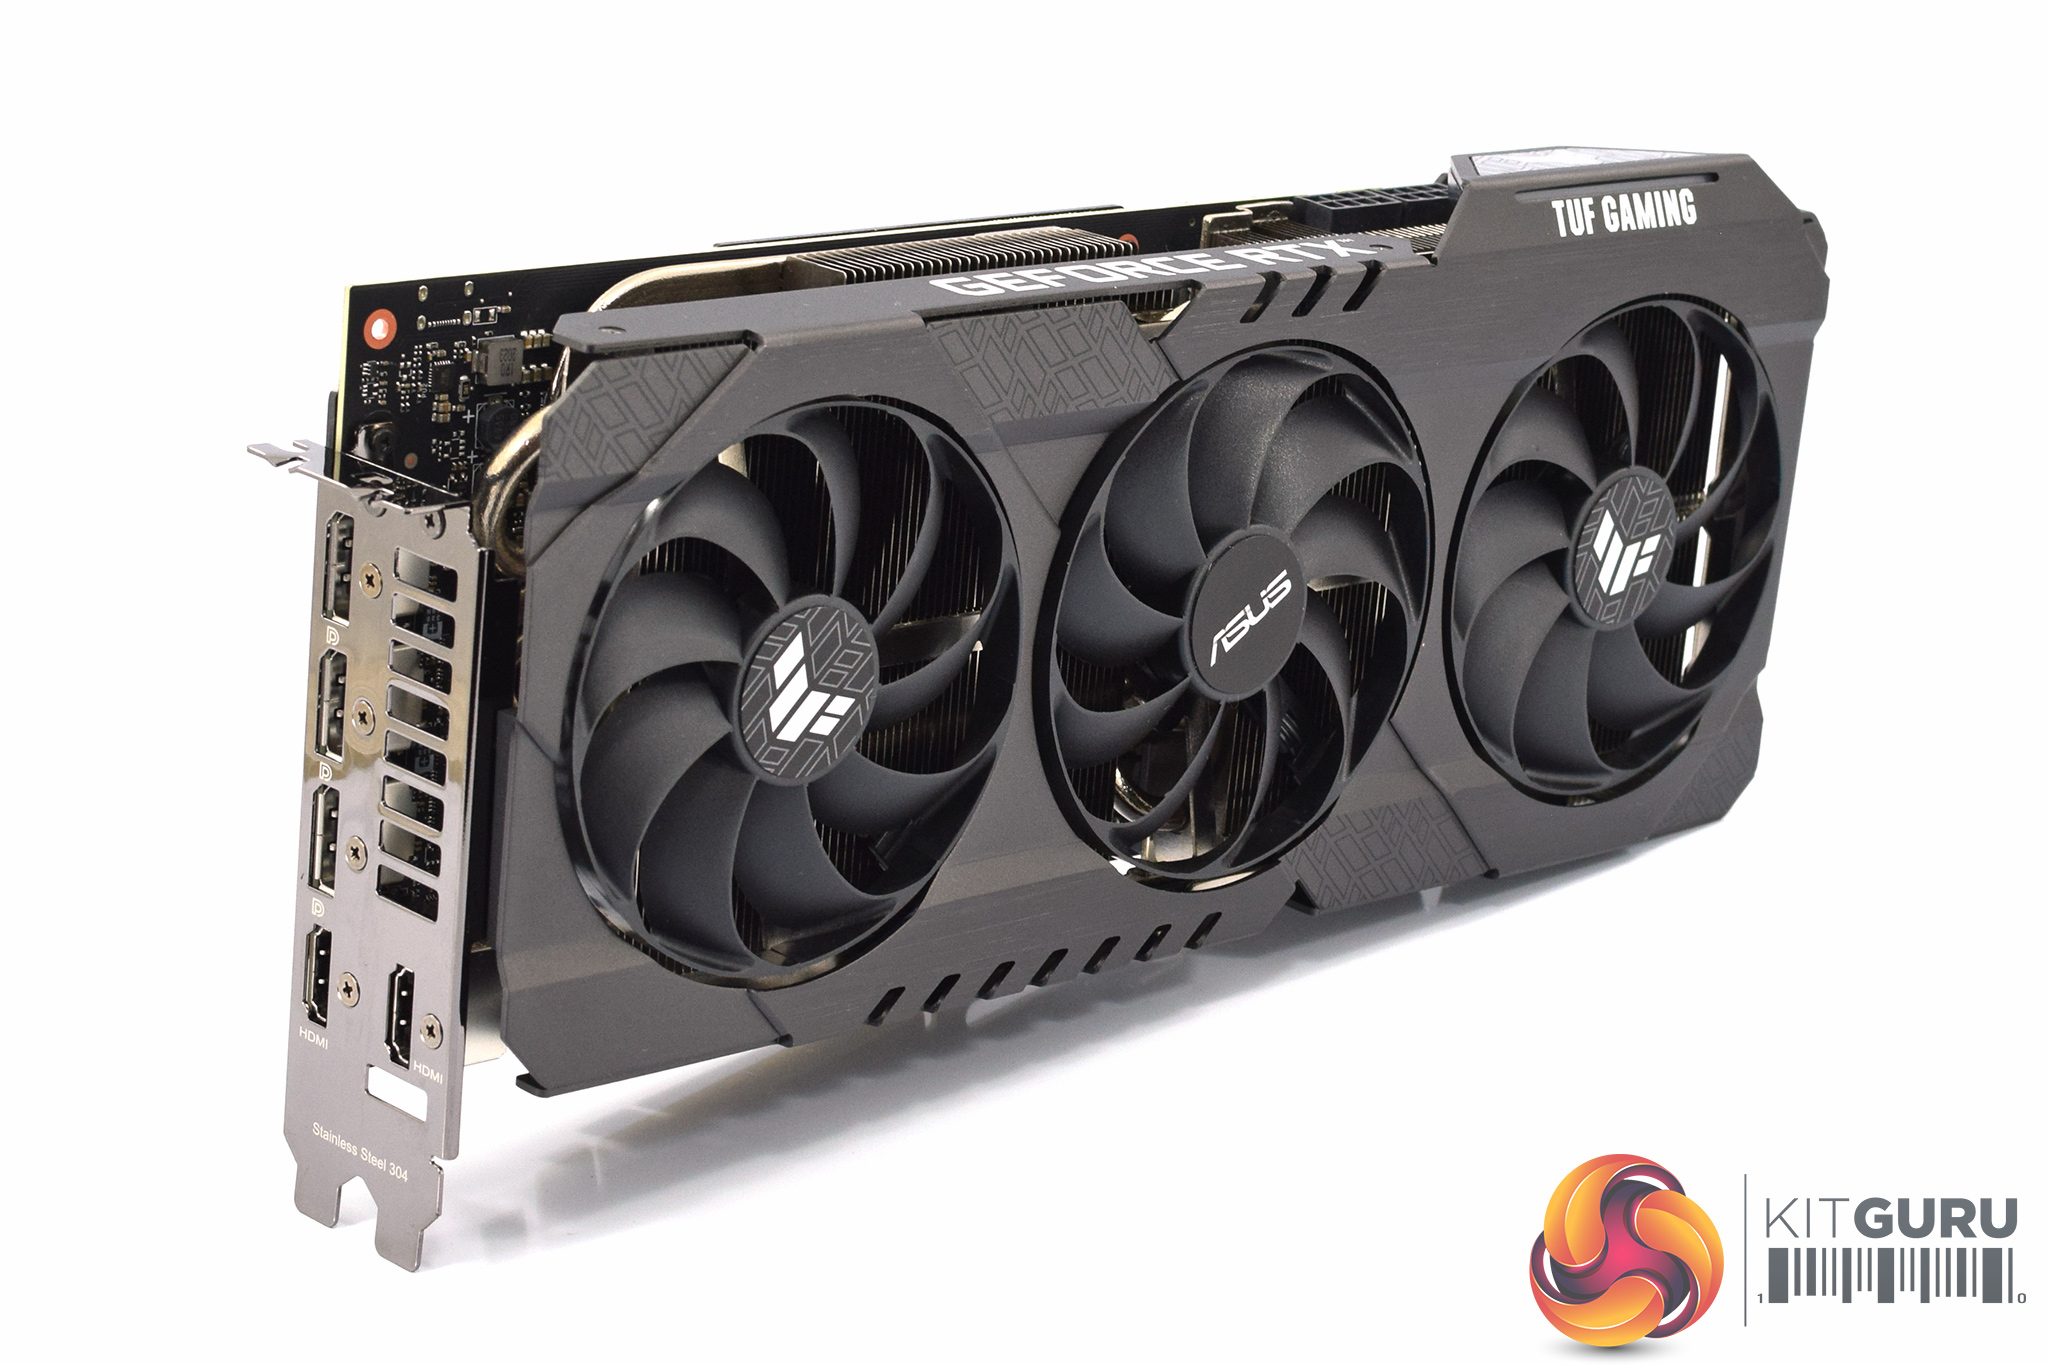
Over on the front side of the card, I am pleased to see the inclusion of a BIOS switch. This is usually reserved for the higher-end cards, like the ROG Strix, but it's a feature I value highly. By default, the card uses the Performance BIOS, but users can switch to the Quiet BIOS as well. We test both of these later in the review.
As for the backplate, this is a full-length design that is also made from aluminium. ASUS has added two cut-outs at the end of the card, to allow air to flow directly through the heatsink. Additionally, the company is keen to stress the inclusion of a GPU bracket, used to mount the heatsink to the GPU die. I see this as a direct response to the mounting pressure issues ASUS had with its last-gen coolers, as the company is clearly taking steps to ensure that doesn't happen again.
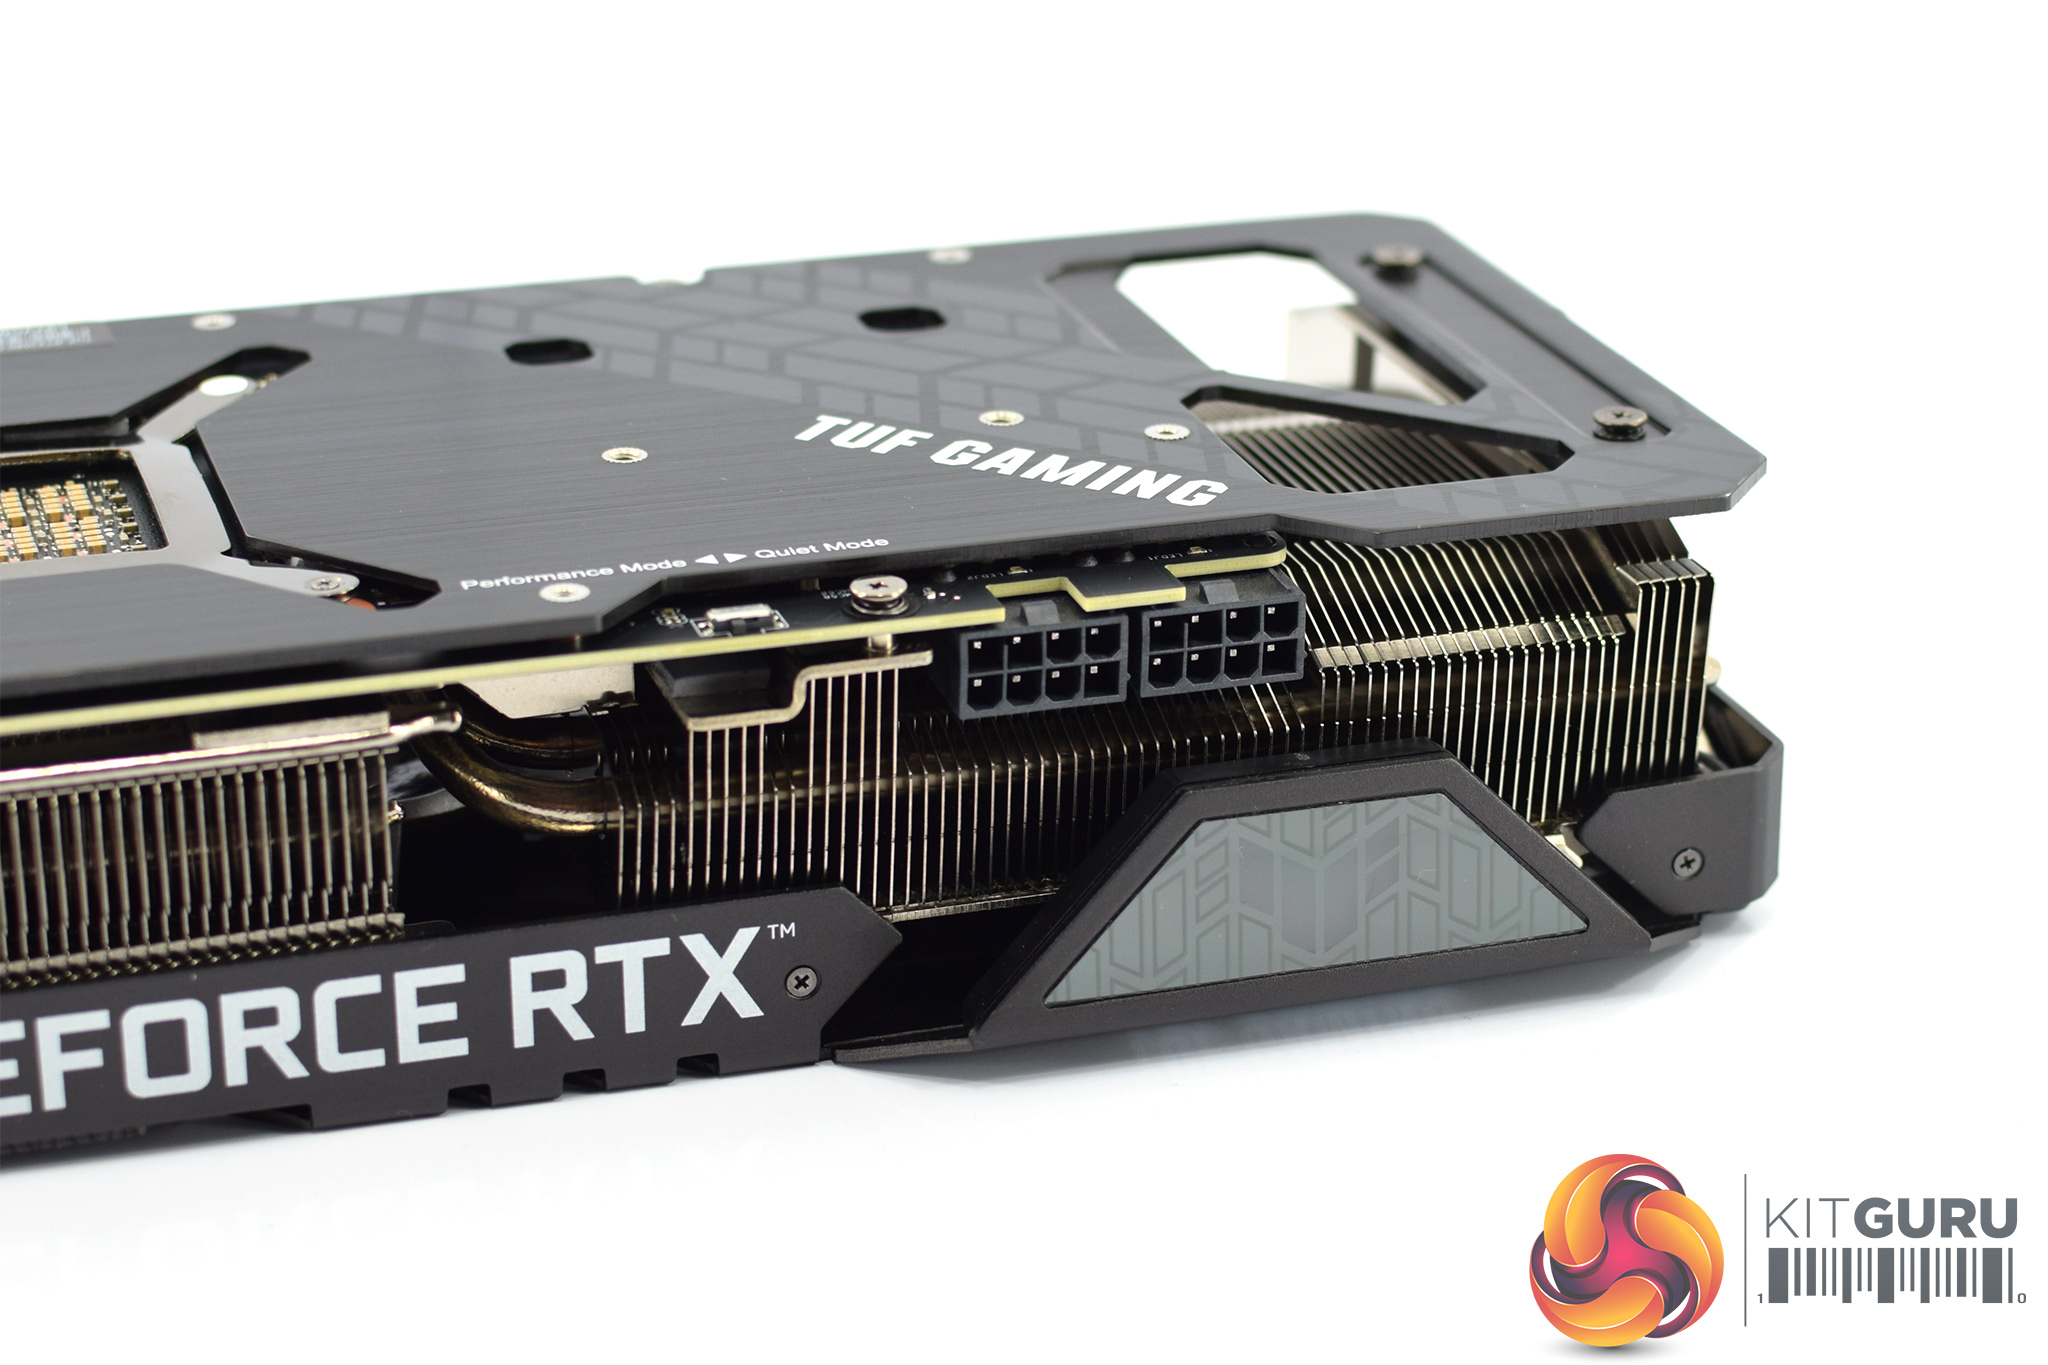
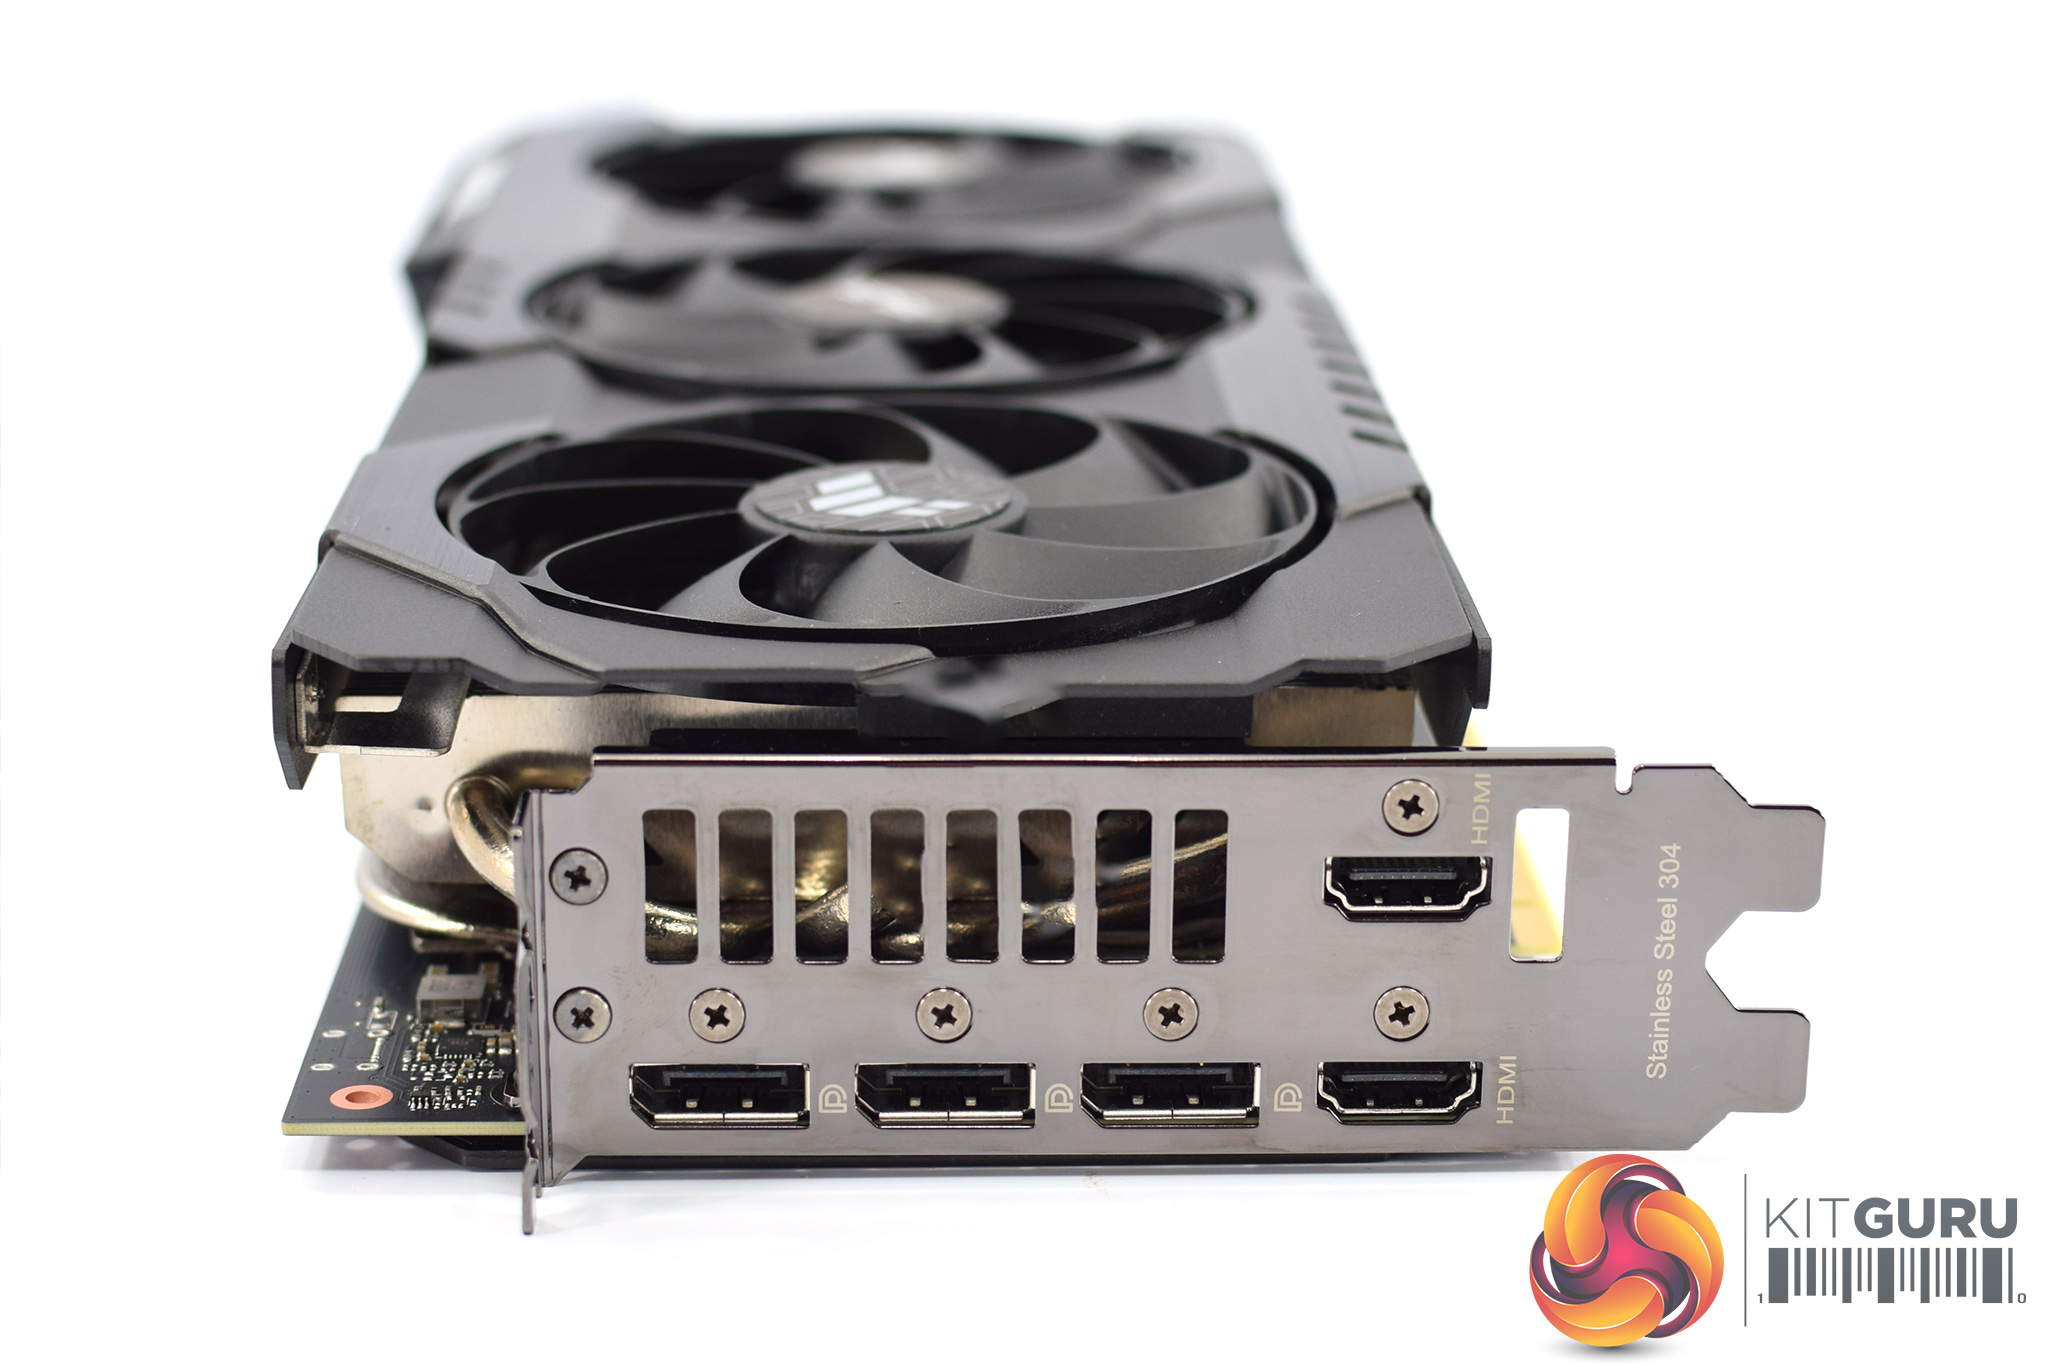
Elsewhere, the TUF Gaming requires 2x 8-pin power connectors, while we can see it has a total of five display outputs – 2x HDMI 2.1 ports, and then 3x DisplayPort 1.4a connectors.
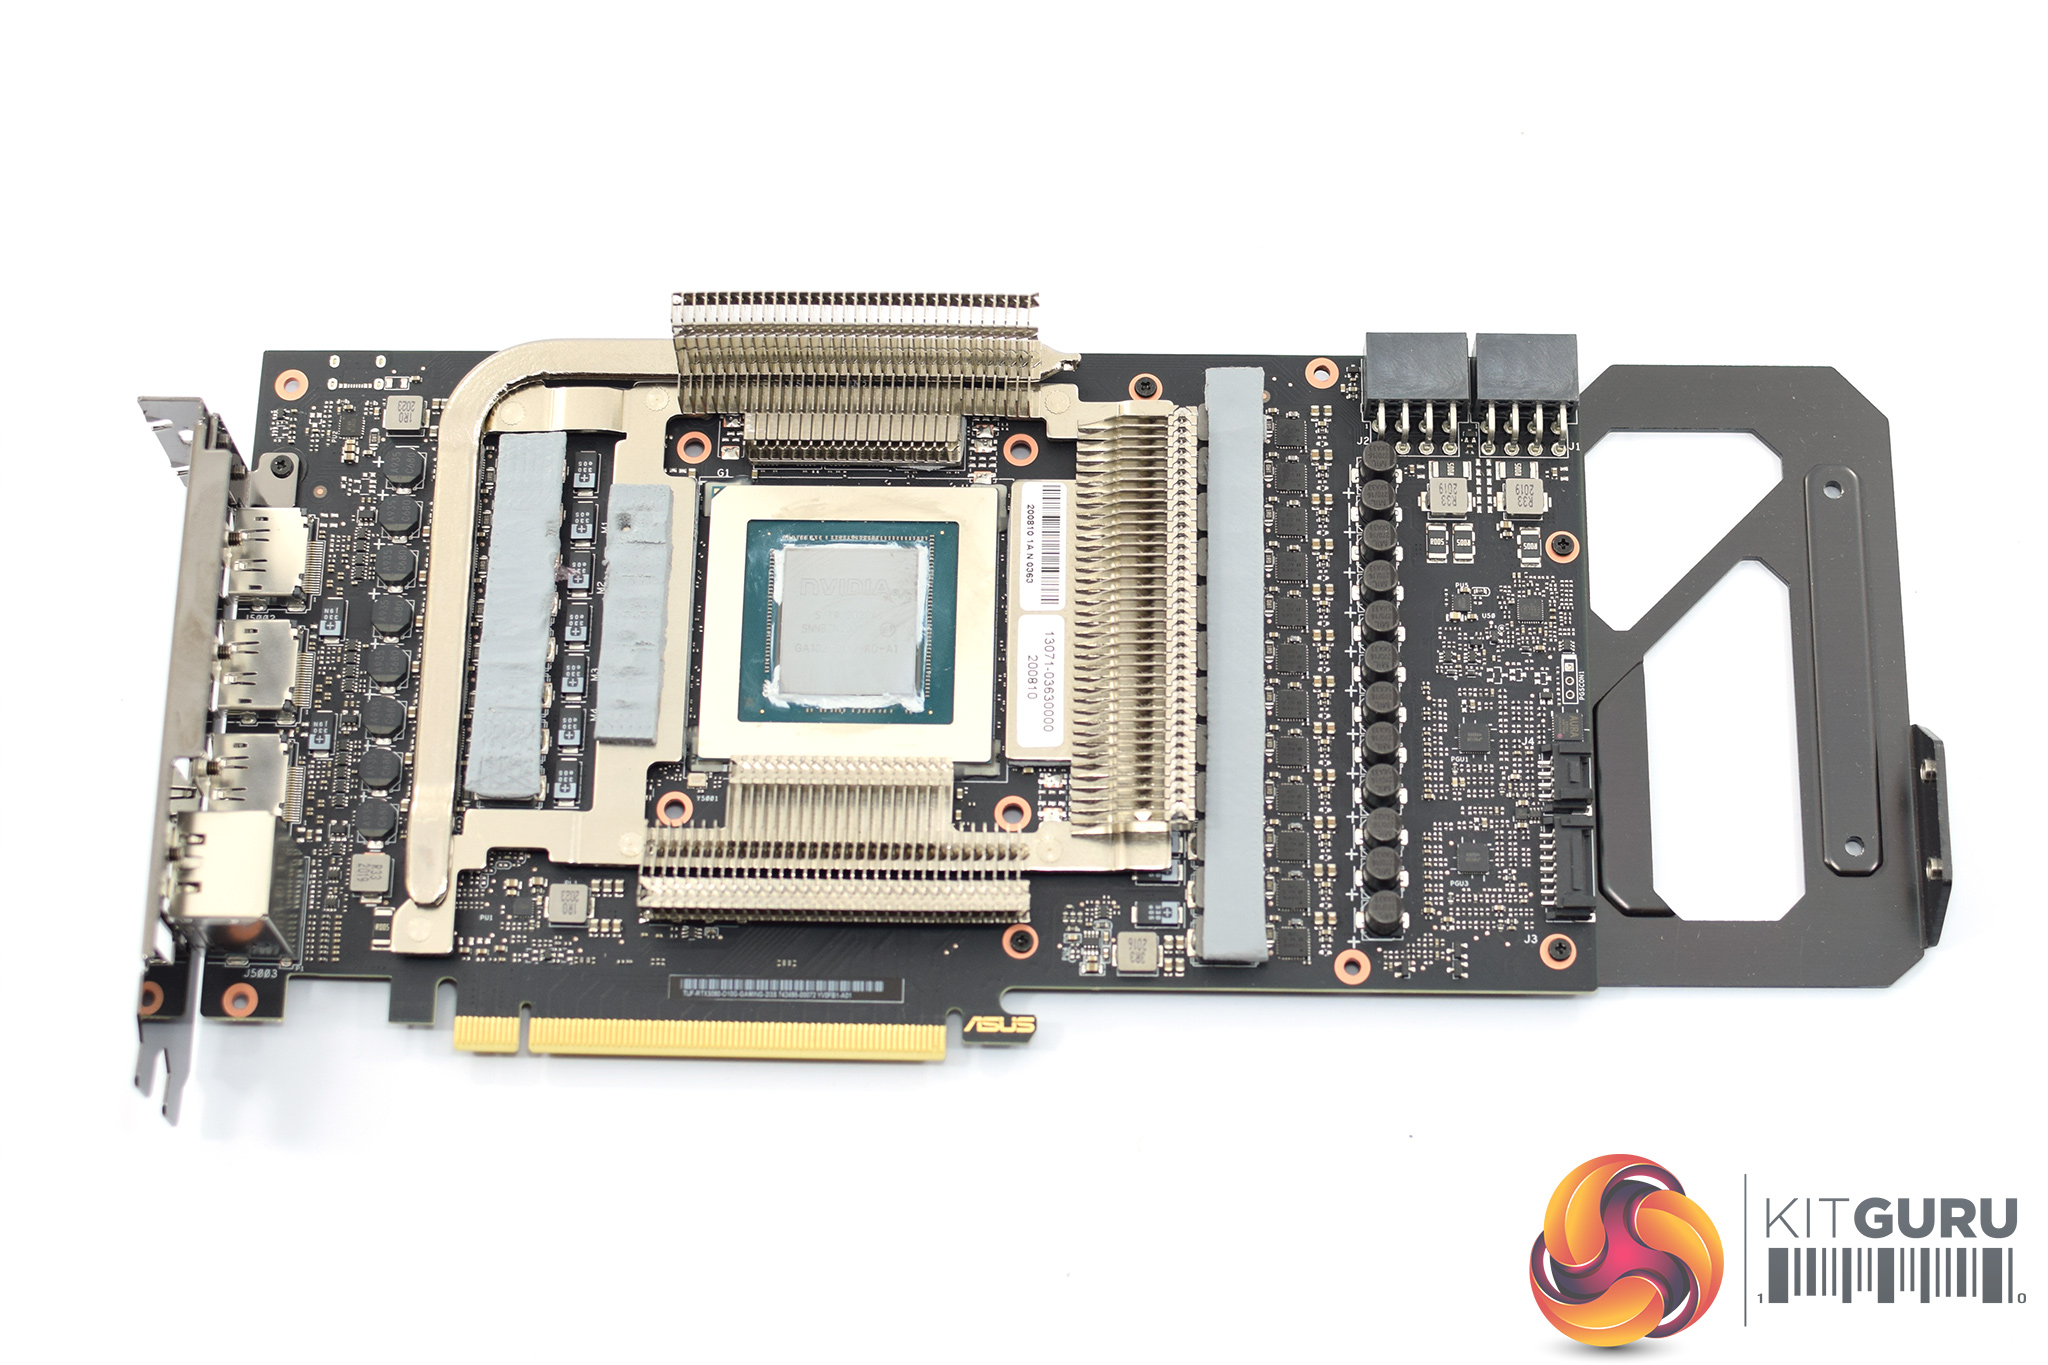
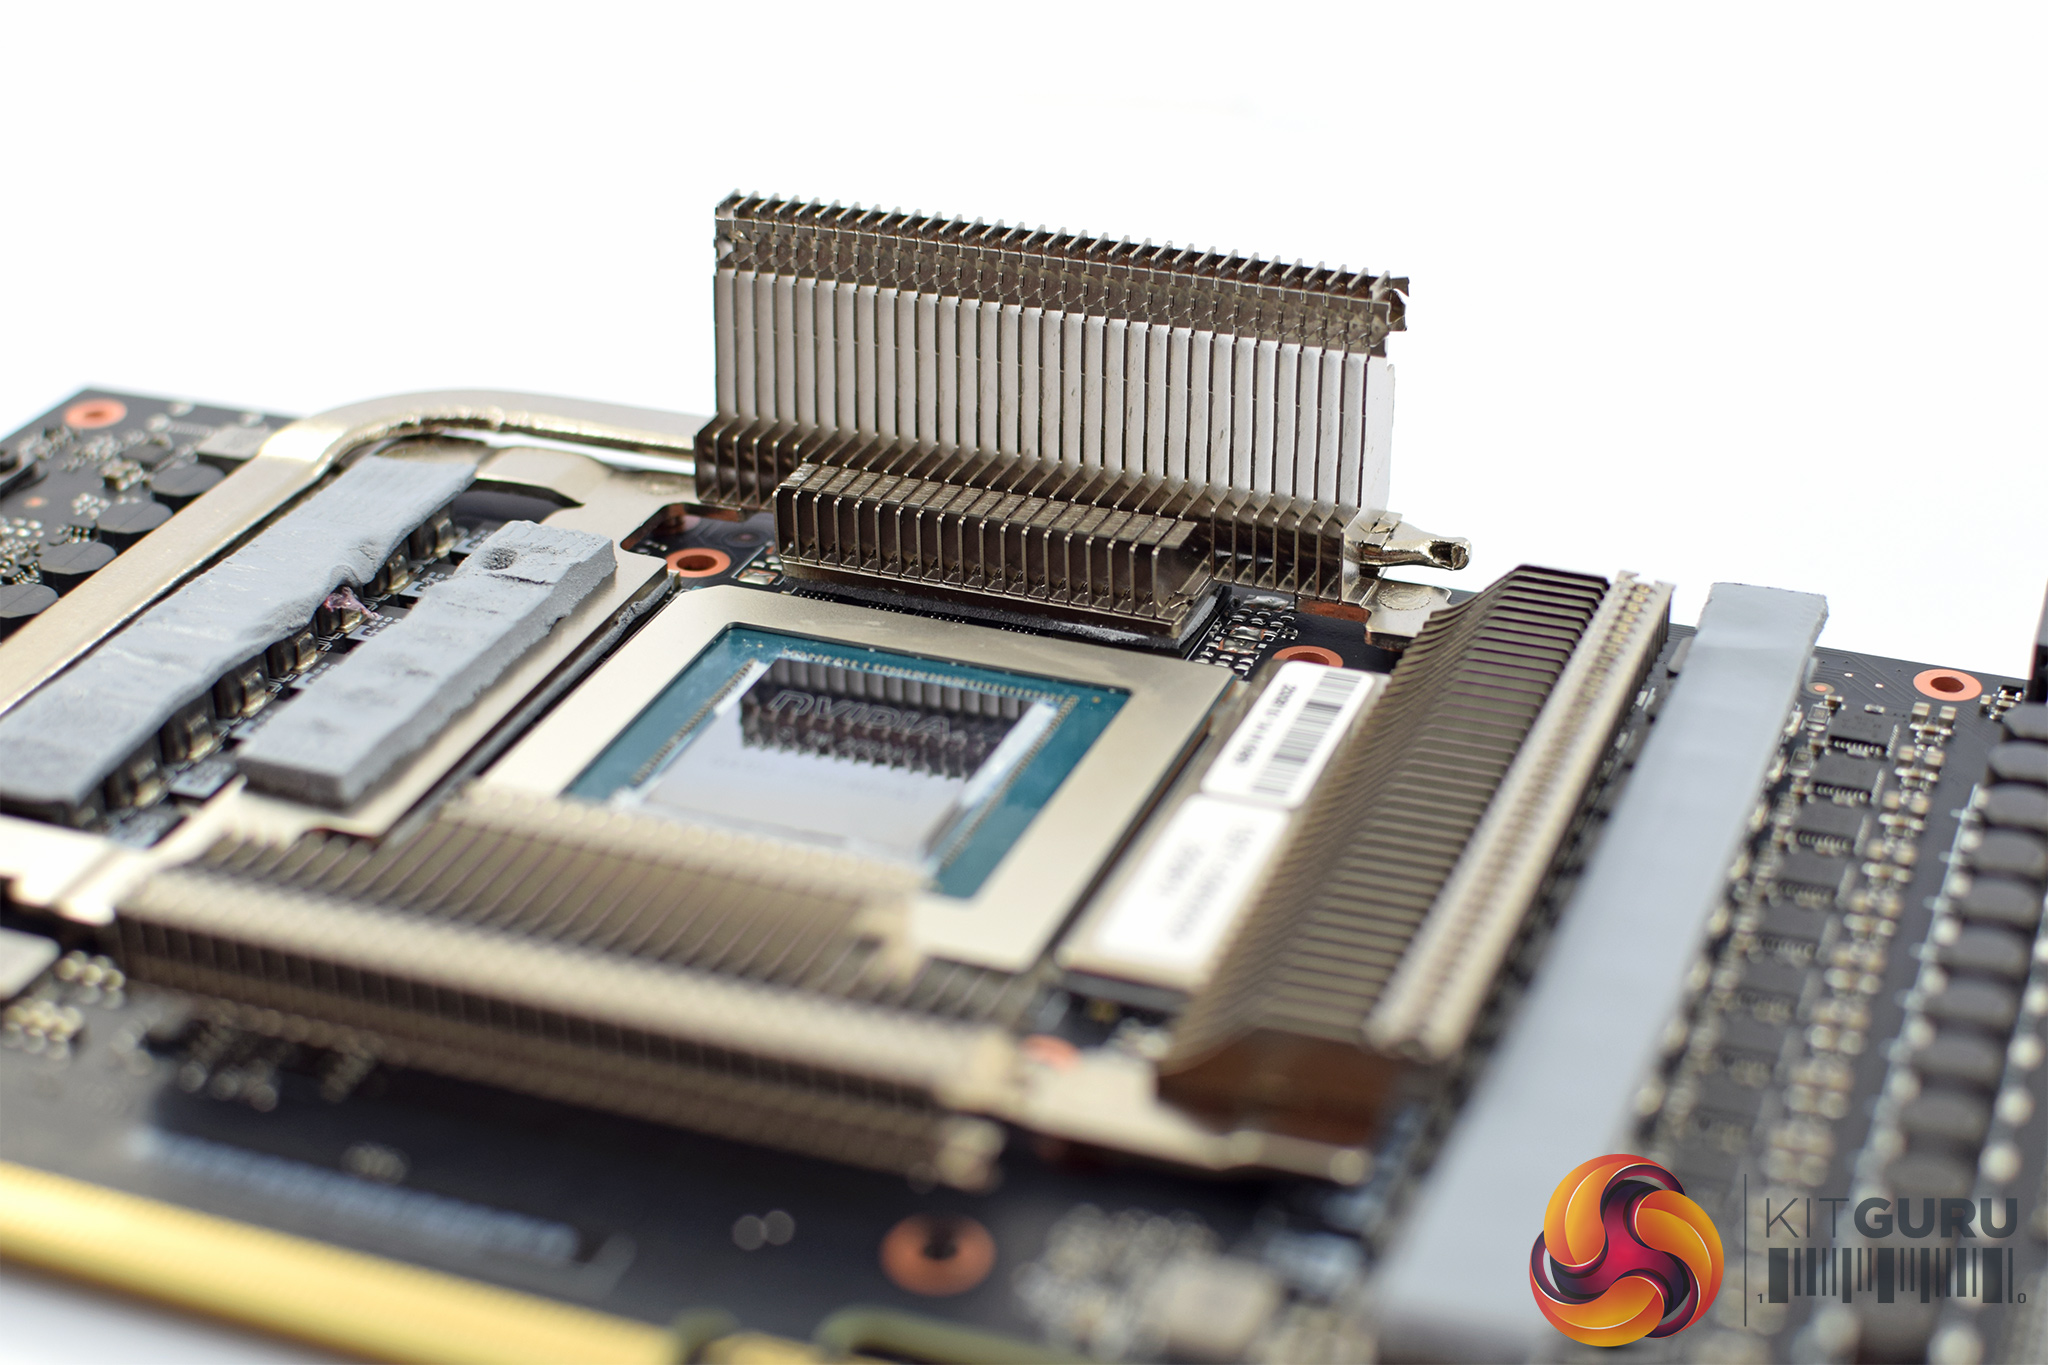
Once the primary heatsink has been removed from the PCB, we are greeted by a secondary heatsink that sits on top of the memory, which even incorporates a single heatpipe. Again, I see this very much as a direct response to some of the memory cooling issues that we previously criticised ASUS for, so it is good to see the company has taken direct steps to improve things.
Unfortunately, the thermal pads used underneath this heatsink proved very delicate, and I was unable to remove the secondary heatsink without completely ripping the pads, which is why we don't have any images of the PCB completely ‘naked'. Still, we were able to spot that ASUS is using a 20-stage power delivery solution, split in a 16+4 configuration. ASUS is using Vishay SiC641A power stages, rated for 55A continuous current, 70A 10ms peak, and 100A 10μs peak.
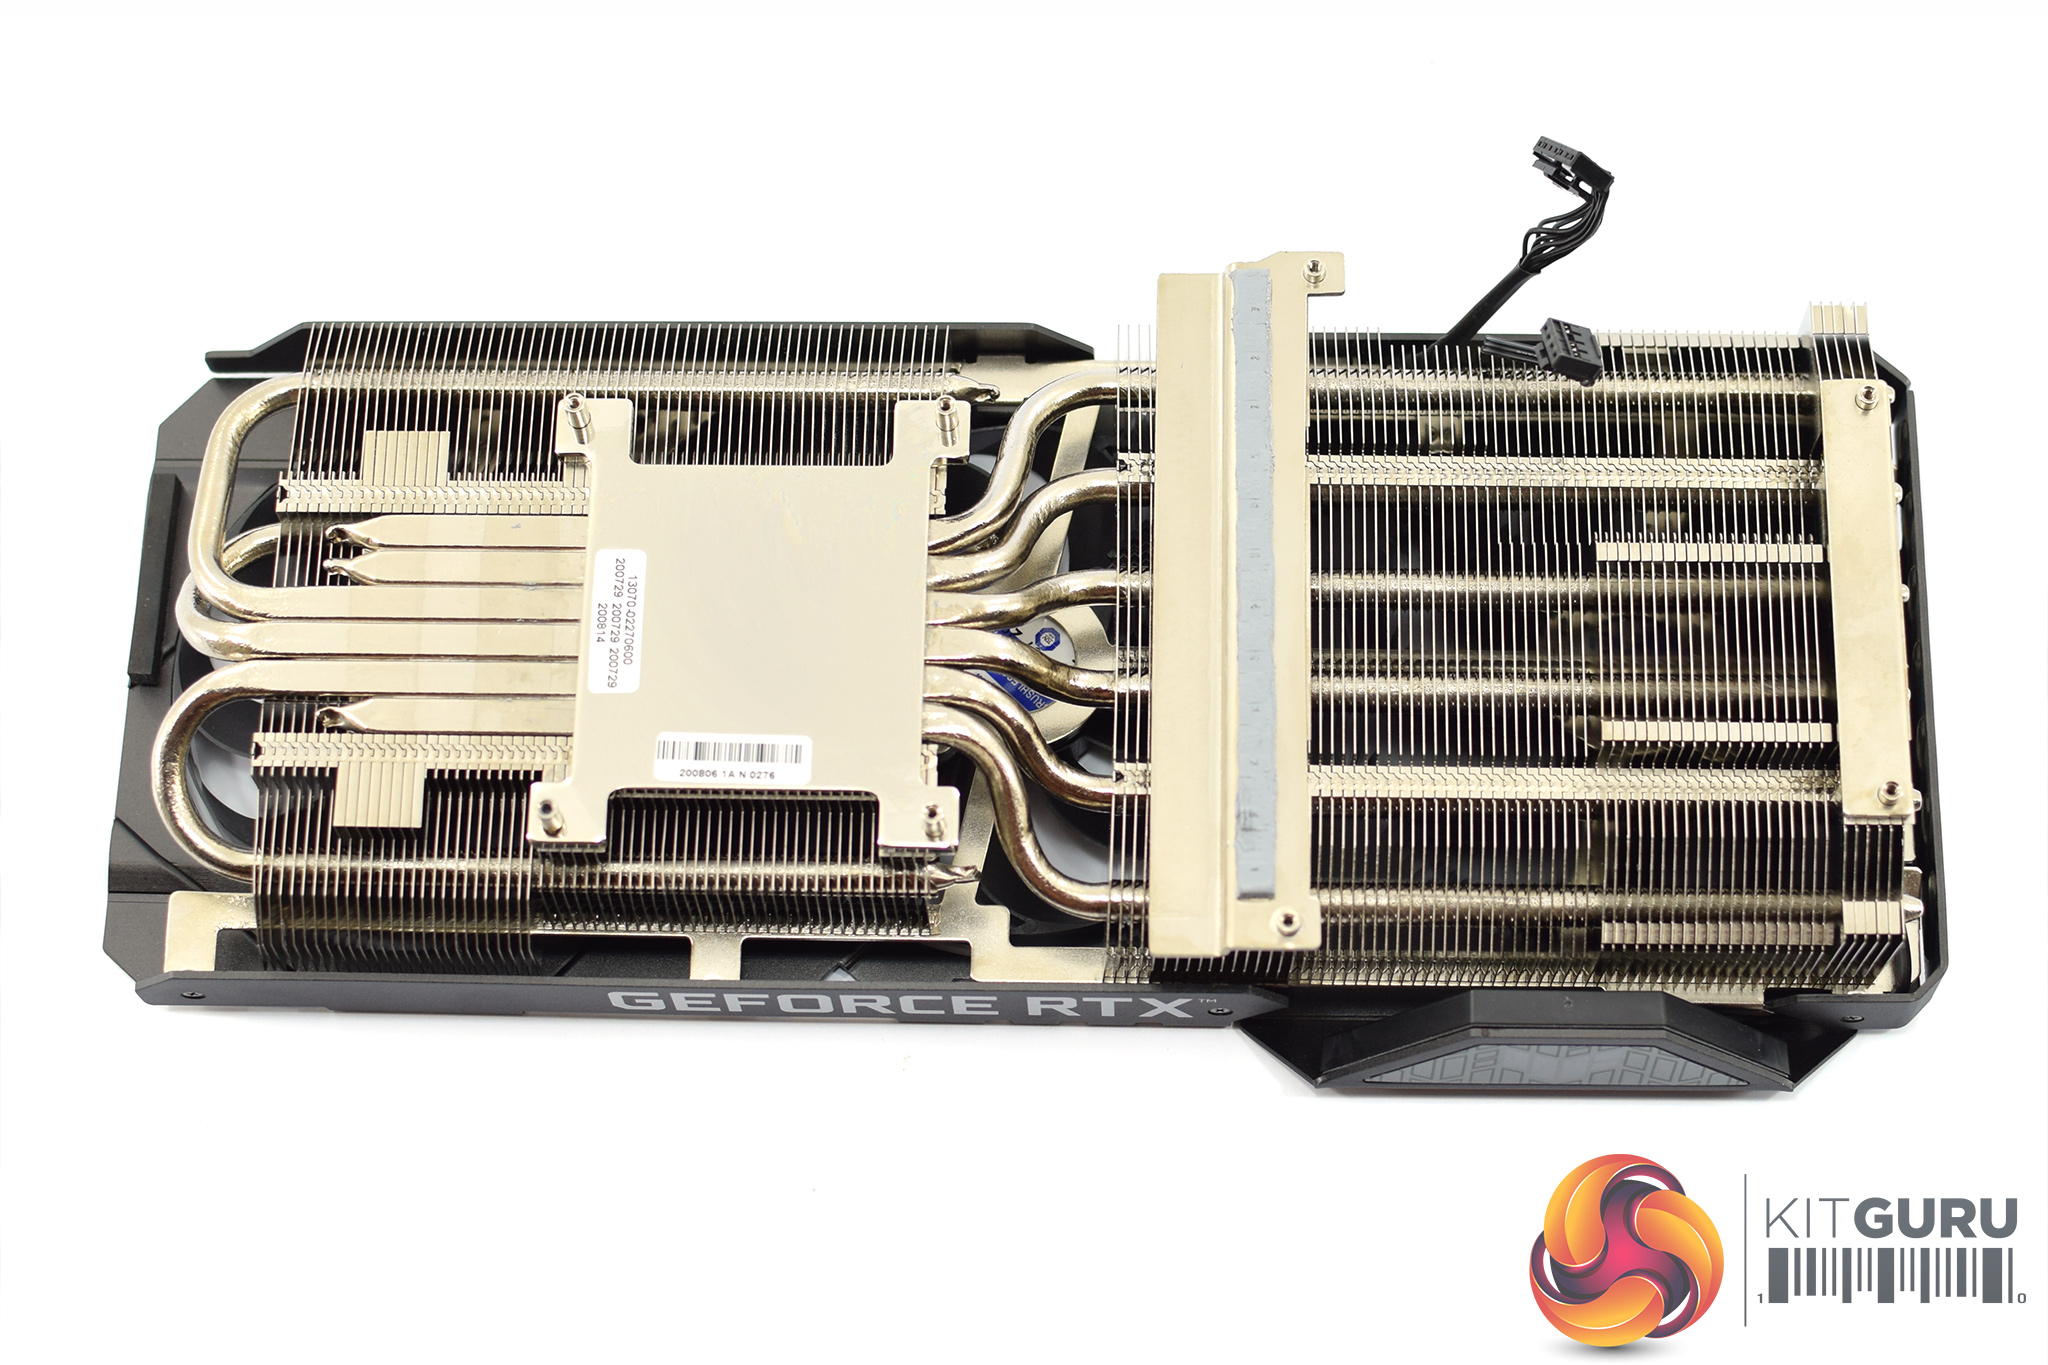
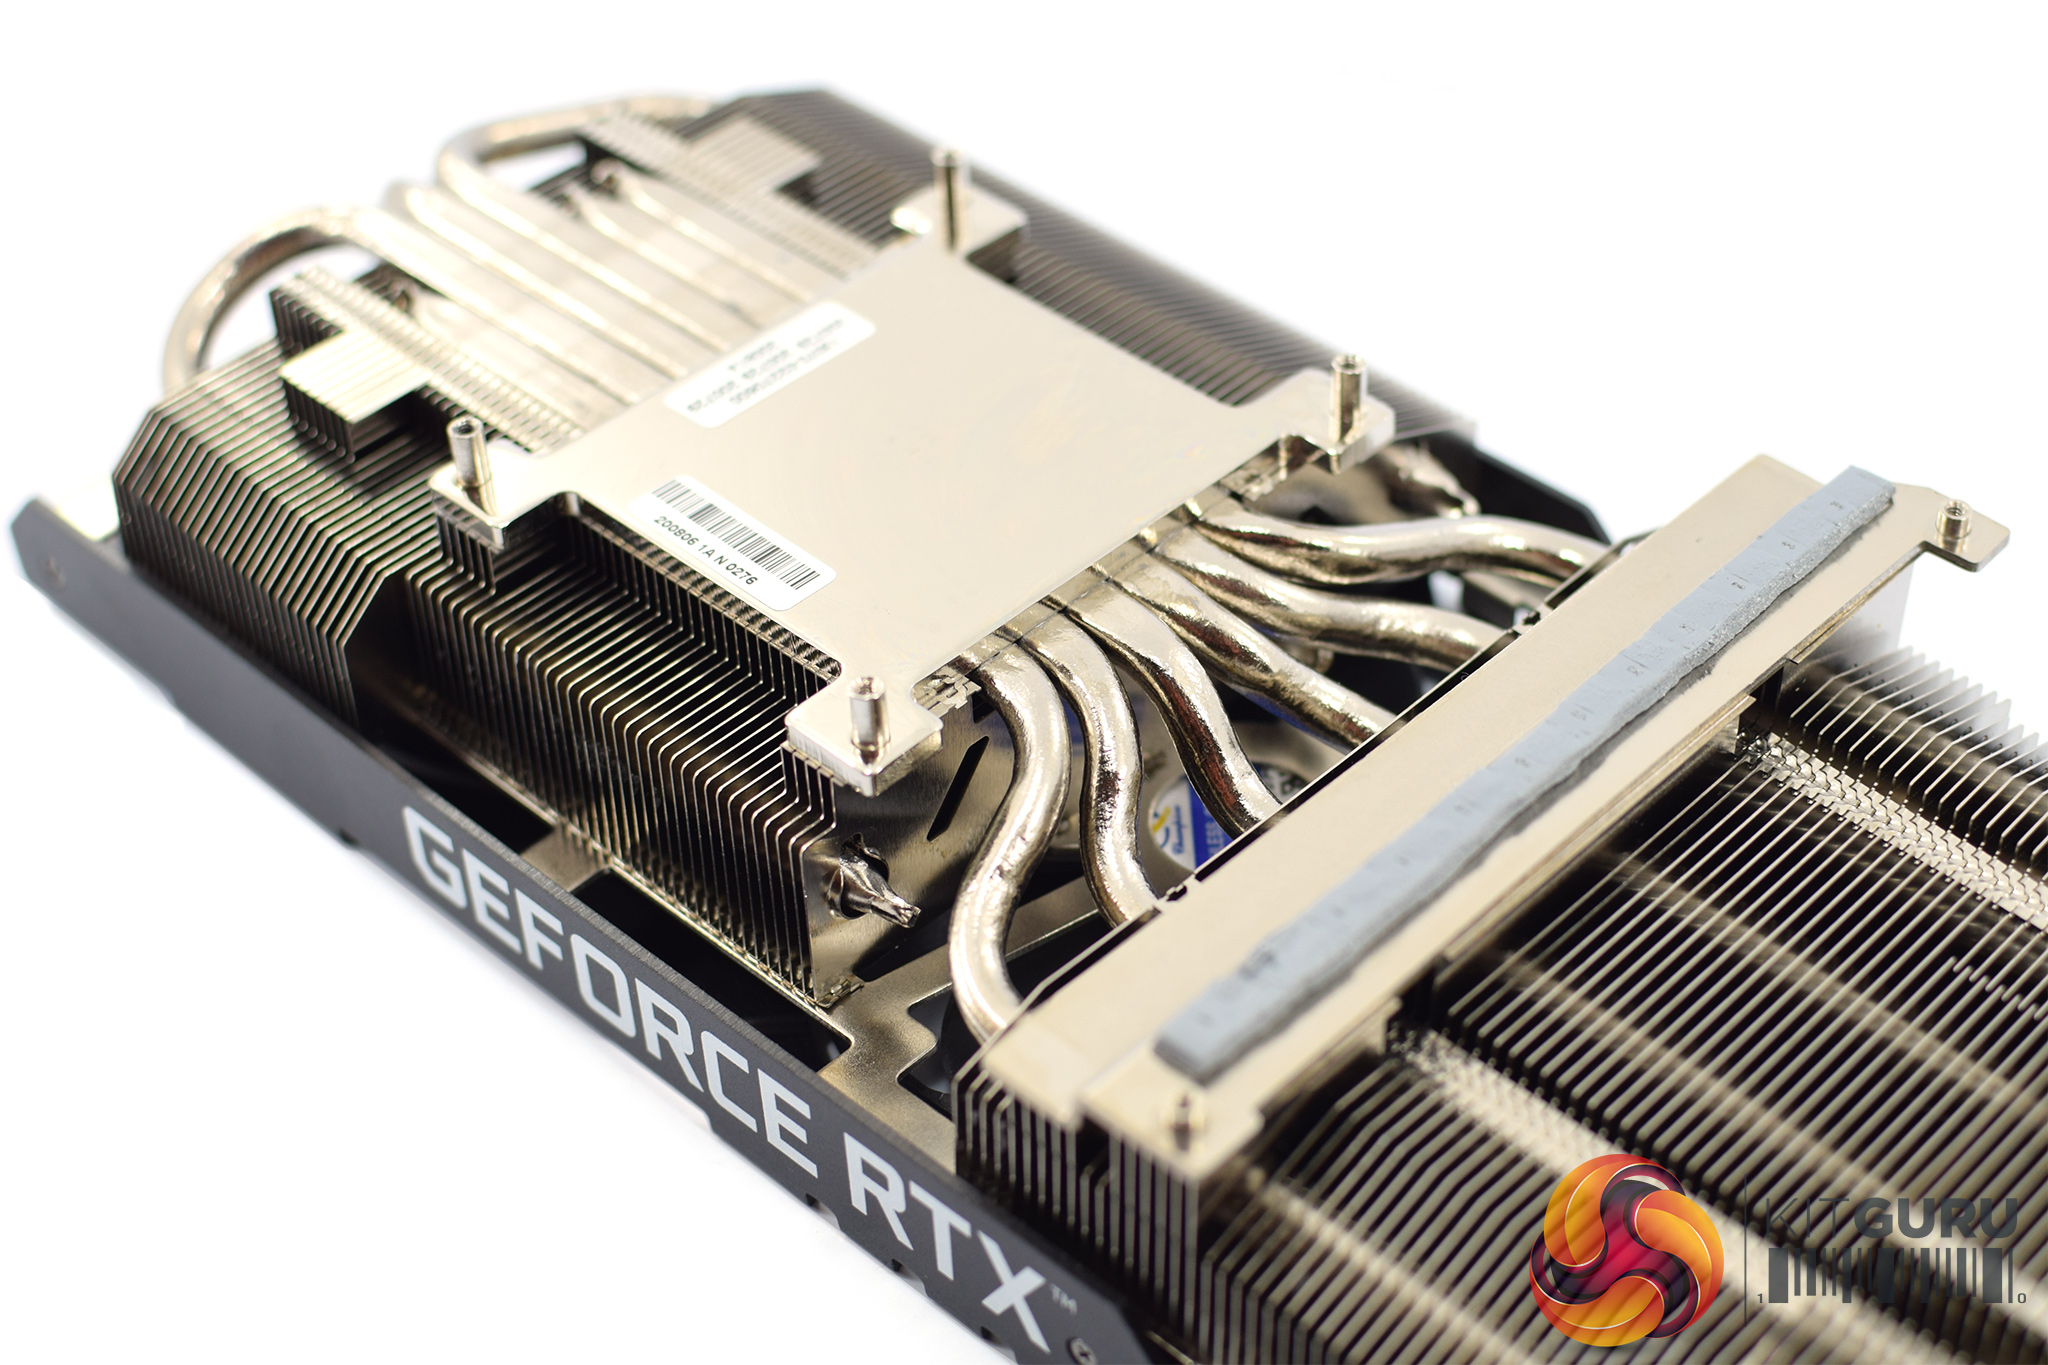
As for the heatsink, this makes use of two fin stacks, connected by 6x 6mm nickel-plated heatpipes. The GPU die contacts with its own dedicated baseplate, while there is an additional plate for the VRM.
Driver Notes
- All Nvidia GPUs (except RTX 3000) were benchmarked with the 452.06 driver.
- RTX 3080 was benchmarked with the 456.16 driver supplied to press.
- RTX 3090 was benchmarked with 456.38 public driver.
- All AMD GPUs were benchmarked with the Adrenalin 20.8.2 driver.
All of our game testing was conducted using the default Performance BIOS. We also tested the Quiet BIOS when looking at thermals, acoustics, power draw, and clock speed under load.
Test System
We test using the a custom built system from PCSpecialist, based on Intel's latest Comet Lake-S platform. You can read more about it over HERE, and configure your own system from PCSpecialist HERE.
| CPU |
Intel Core i9-10900K
Overclocked to 5.1GHz on all cores |
| Motherboard |
ASUS ROG Maximus XII Hero Wi-Fi
|
| Memory |
Corsair Vengeance DDR4 3600MHz (4 X 8GB)
CL 18-22-22-42
|
| Graphics Card |
Varies
|
| System Drive |
500GB Samsung 970 Evo Plus M.2
|
| Games Drive | 2TB Samsung 860 QVO 2.5″ SSD |
| Chassis | Fractal Meshify S2 Blackout Tempered Glass |
| CPU Cooler |
Corsair H115i RGB Platinum Hydro Series
|
| Power Supply |
Corsair 1200W HX Series Modular 80 Plus Platinum
|
| Operating System |
Windows 10 2004
|
Comparison Graphics Cards List
- Gigabyte RTX 3090 Eagle OC 24GB
- MSI RTX 3090 Gaming X Trio 24GB
- Gigabyte RTX 3080 Eagle OC 10GB
- MSI RTX 3080 Gaming X Trio 10GB
- Nvidia RTX 3080 FE 10GB
- Nvidia RTX 2080 Ti FE 11GB
- Nvidia RTX 2080 Super FE 8GB
- Nvidia RTX 2080 FE 8GB
- Nvidia RTX 2070 Super FE 8GB
- MSI RTX 2070 Armor 8GB
- Nvidia GTX 1080 Ti FE 11GB
- Gigabyte GTX 1080 G1 Gaming 8GB
- AMD Radeon VII 16GB
- AMD RX 5700 XT 8GB
- AMD RX 5700 8GB
- AMD RX Vega 64 8GB
Software and Games List
- 3DMark Fire Strike & Fire Strike Ultra (DX11 Synthetic)
- 3DMark Time Spy (DX12 Synthetic)
- 3DMark Port Royal (DXR Synthetic)
- Control (DX12)
- Death Stranding (DX12)
- The Division 2 (DX12)
- Far Cry New Dawn (DX11)
- Gears 5 (DX12)
- Ghost Recon: Breakpoint (Vulkan)
- Metro: Exodus (DX12)
- Middle Earth: Shadow of War (DX11)
- Red Dead Redemption 2 (Vulkan)
- Shadow of the Tomb Raider (DX12)
- Total War Saga: Troy (DX11)
We run each benchmark/game three times, and present mean averages in our graphs. We use OCAT to measure average frame rates as well as 1% low values across our three runs.
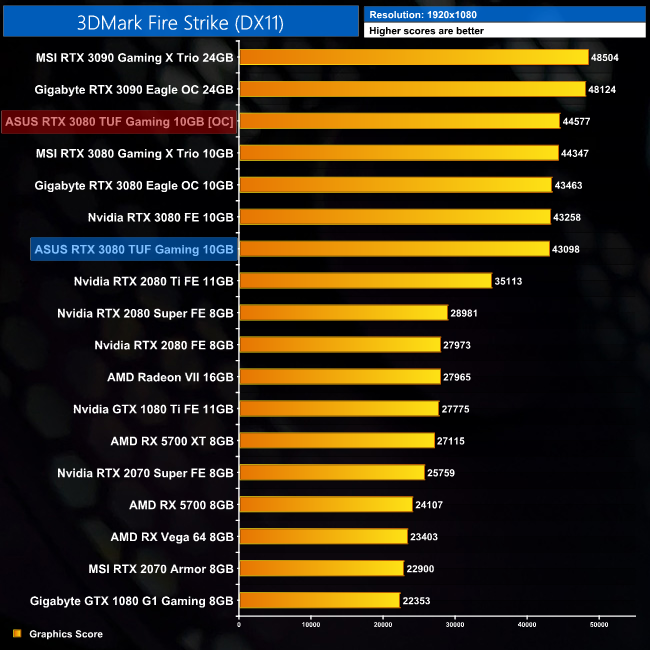
3DMark Fire Strike is a showcase DirectX 11 benchmark designed for today’s high-performance gaming PCs. It is our [FutureMark’s] most ambitious and technical benchmark ever, featuring real-time graphics rendered with detail and complexity far beyond what is found in other benchmarks and games today.
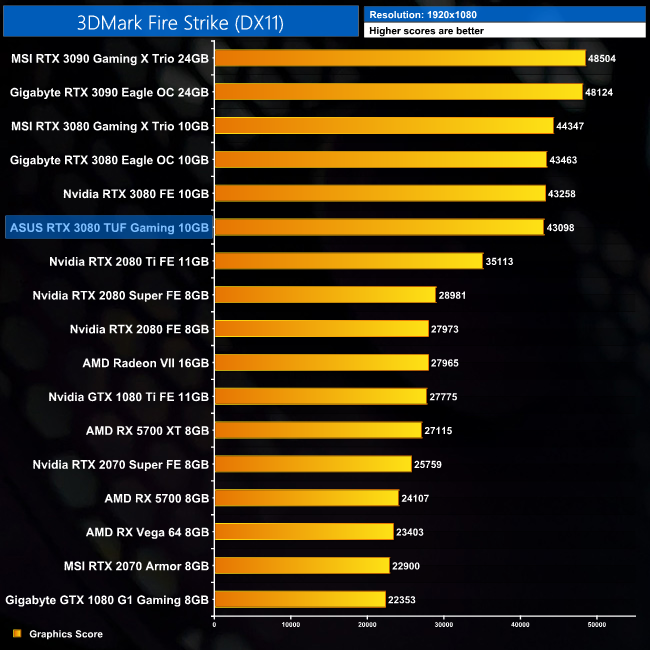
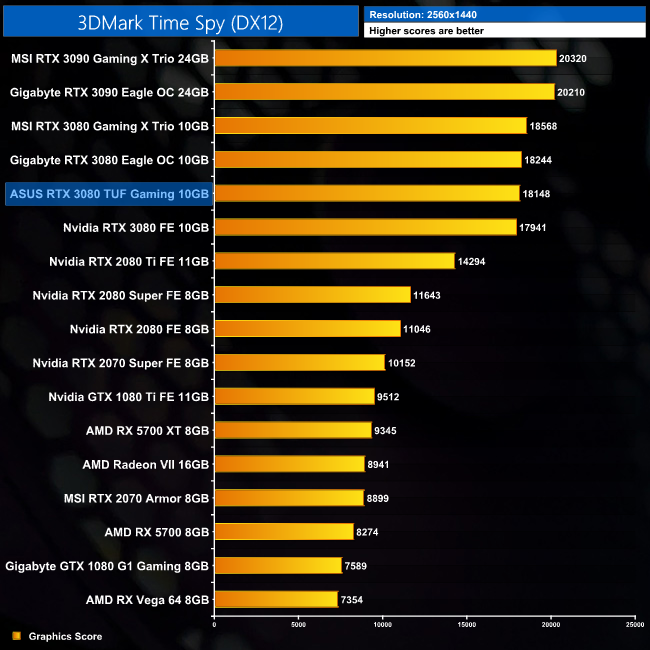
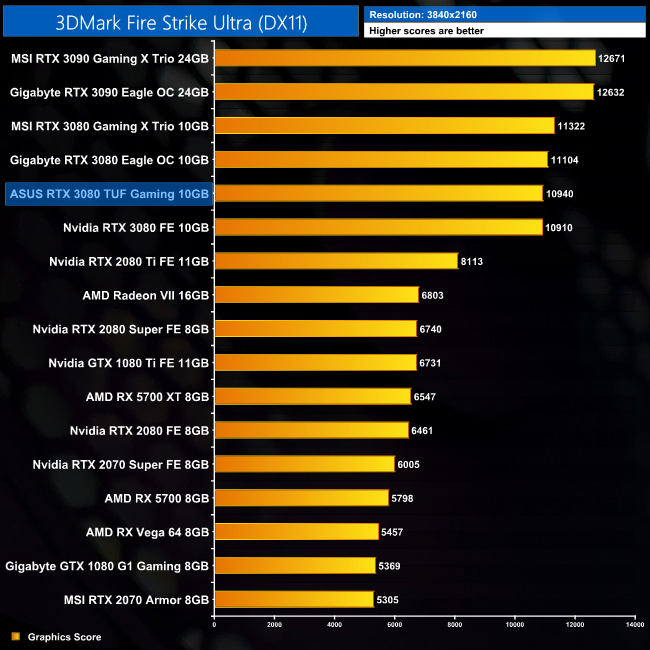
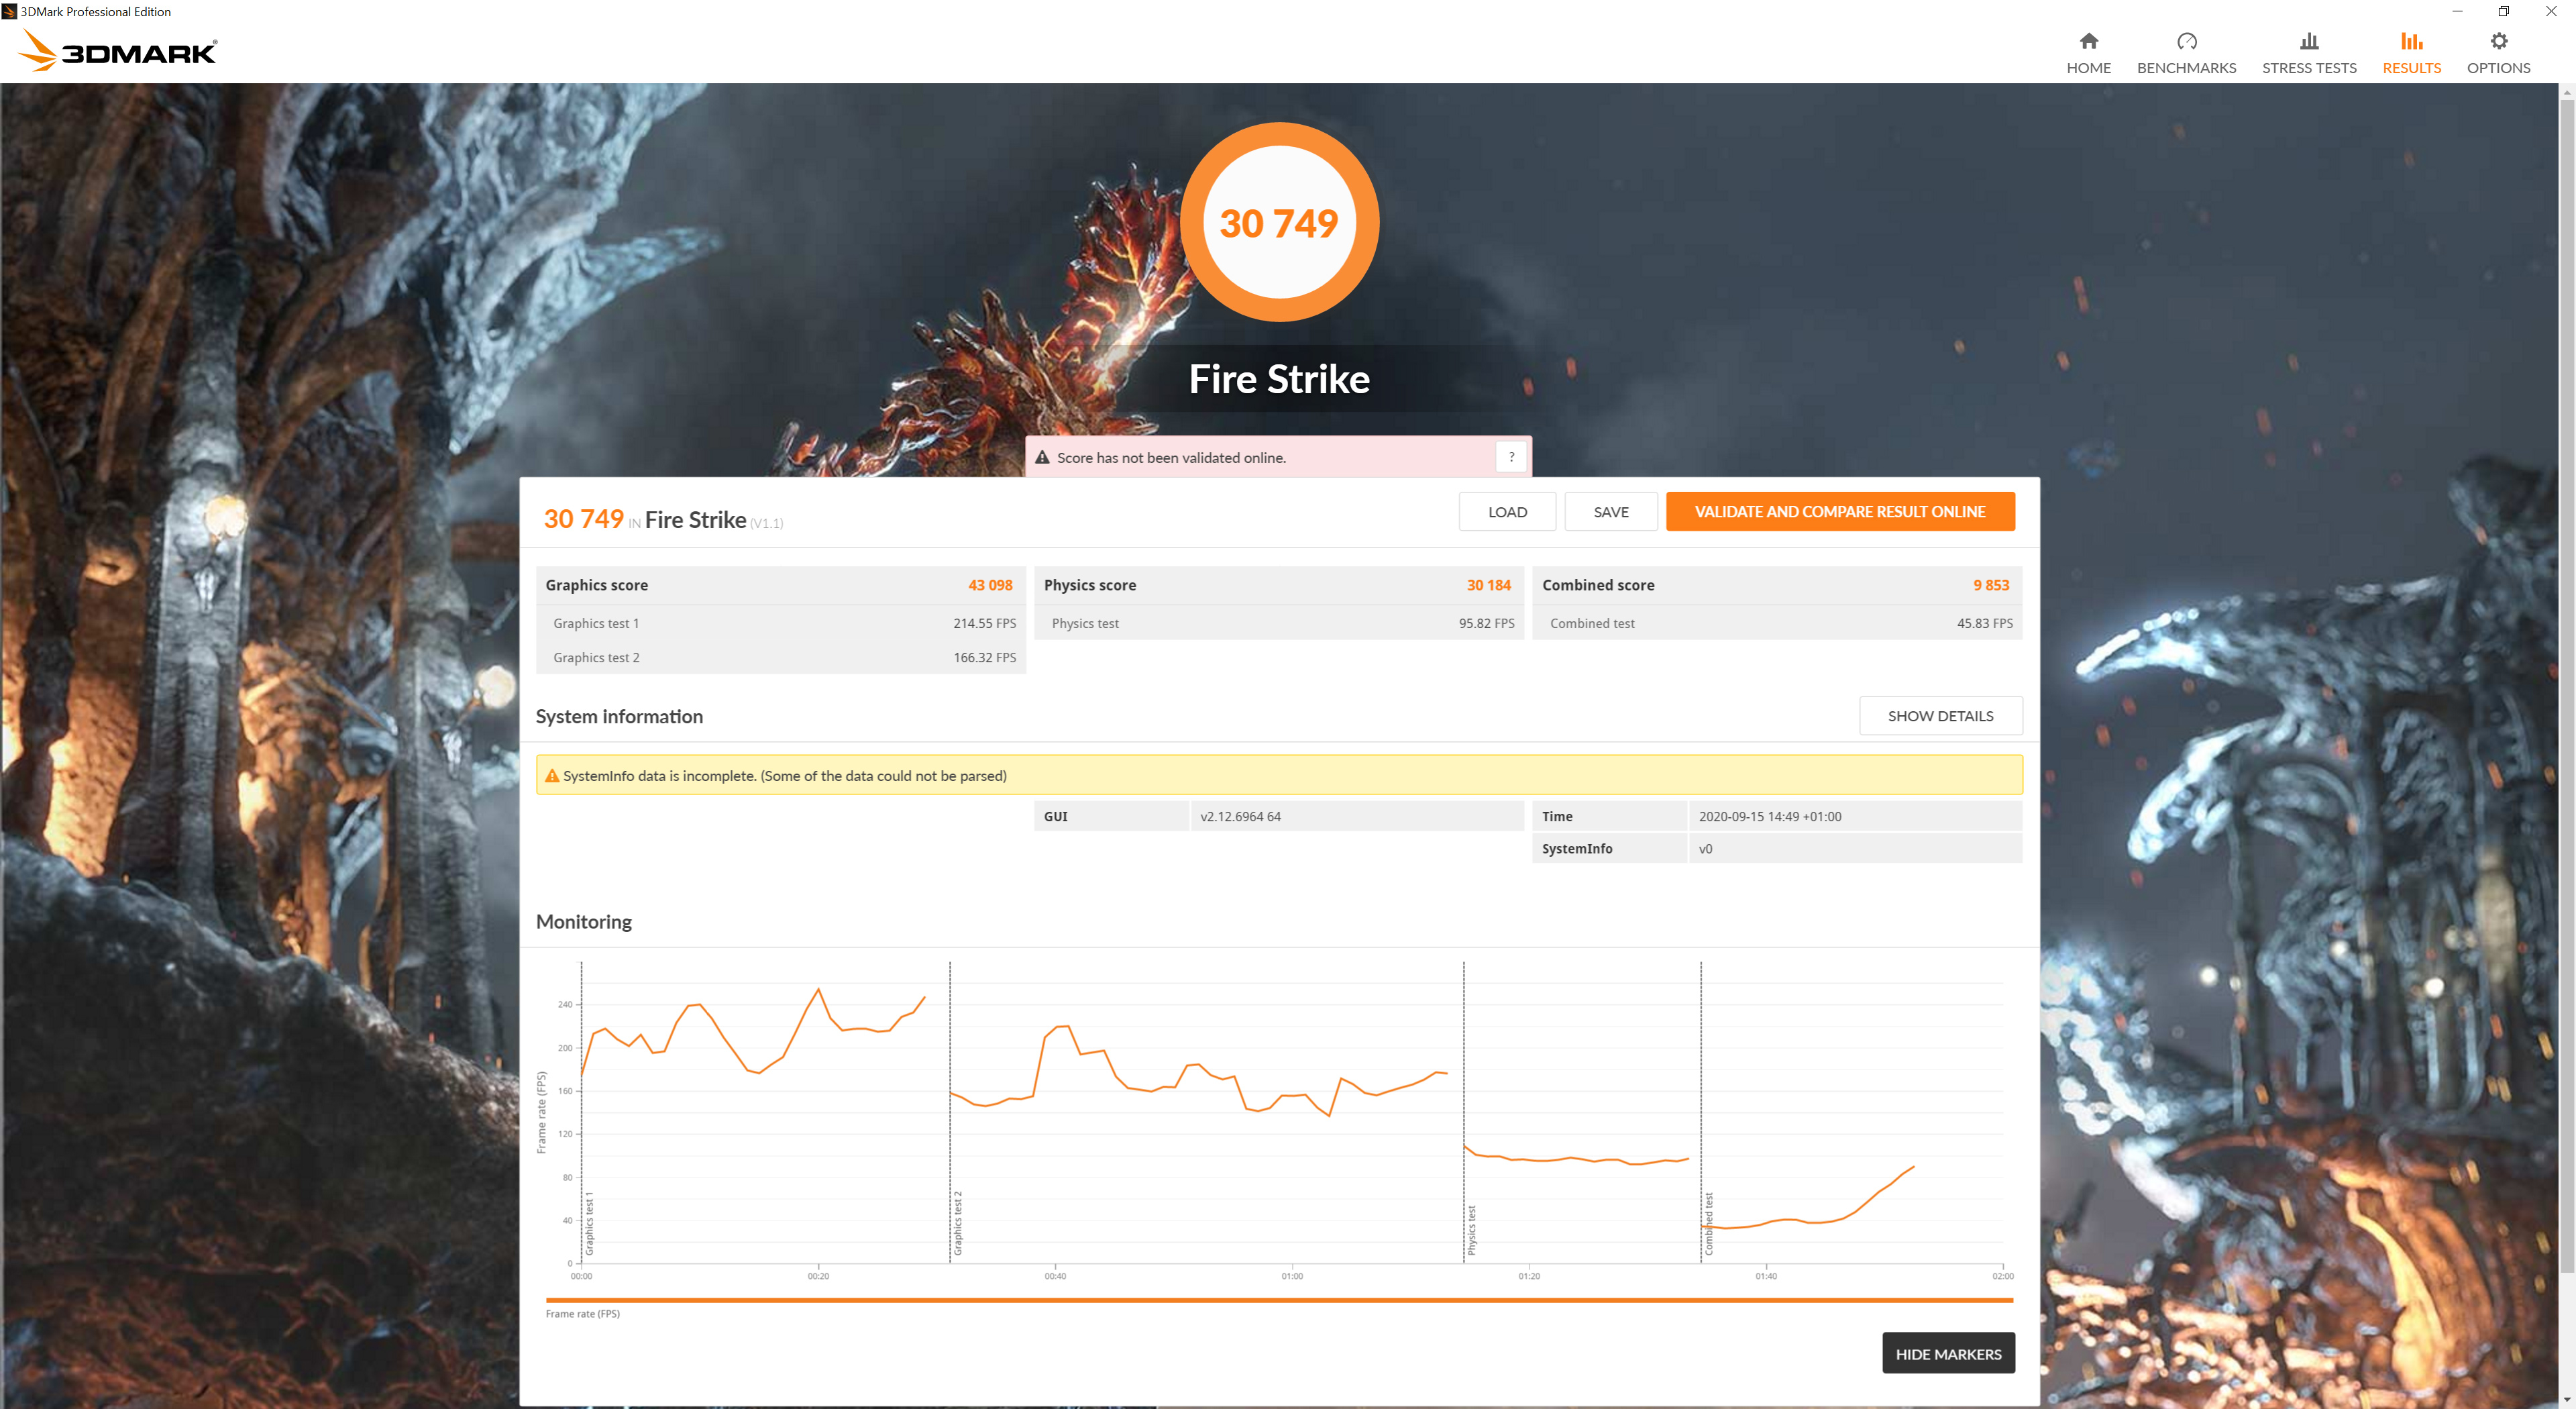
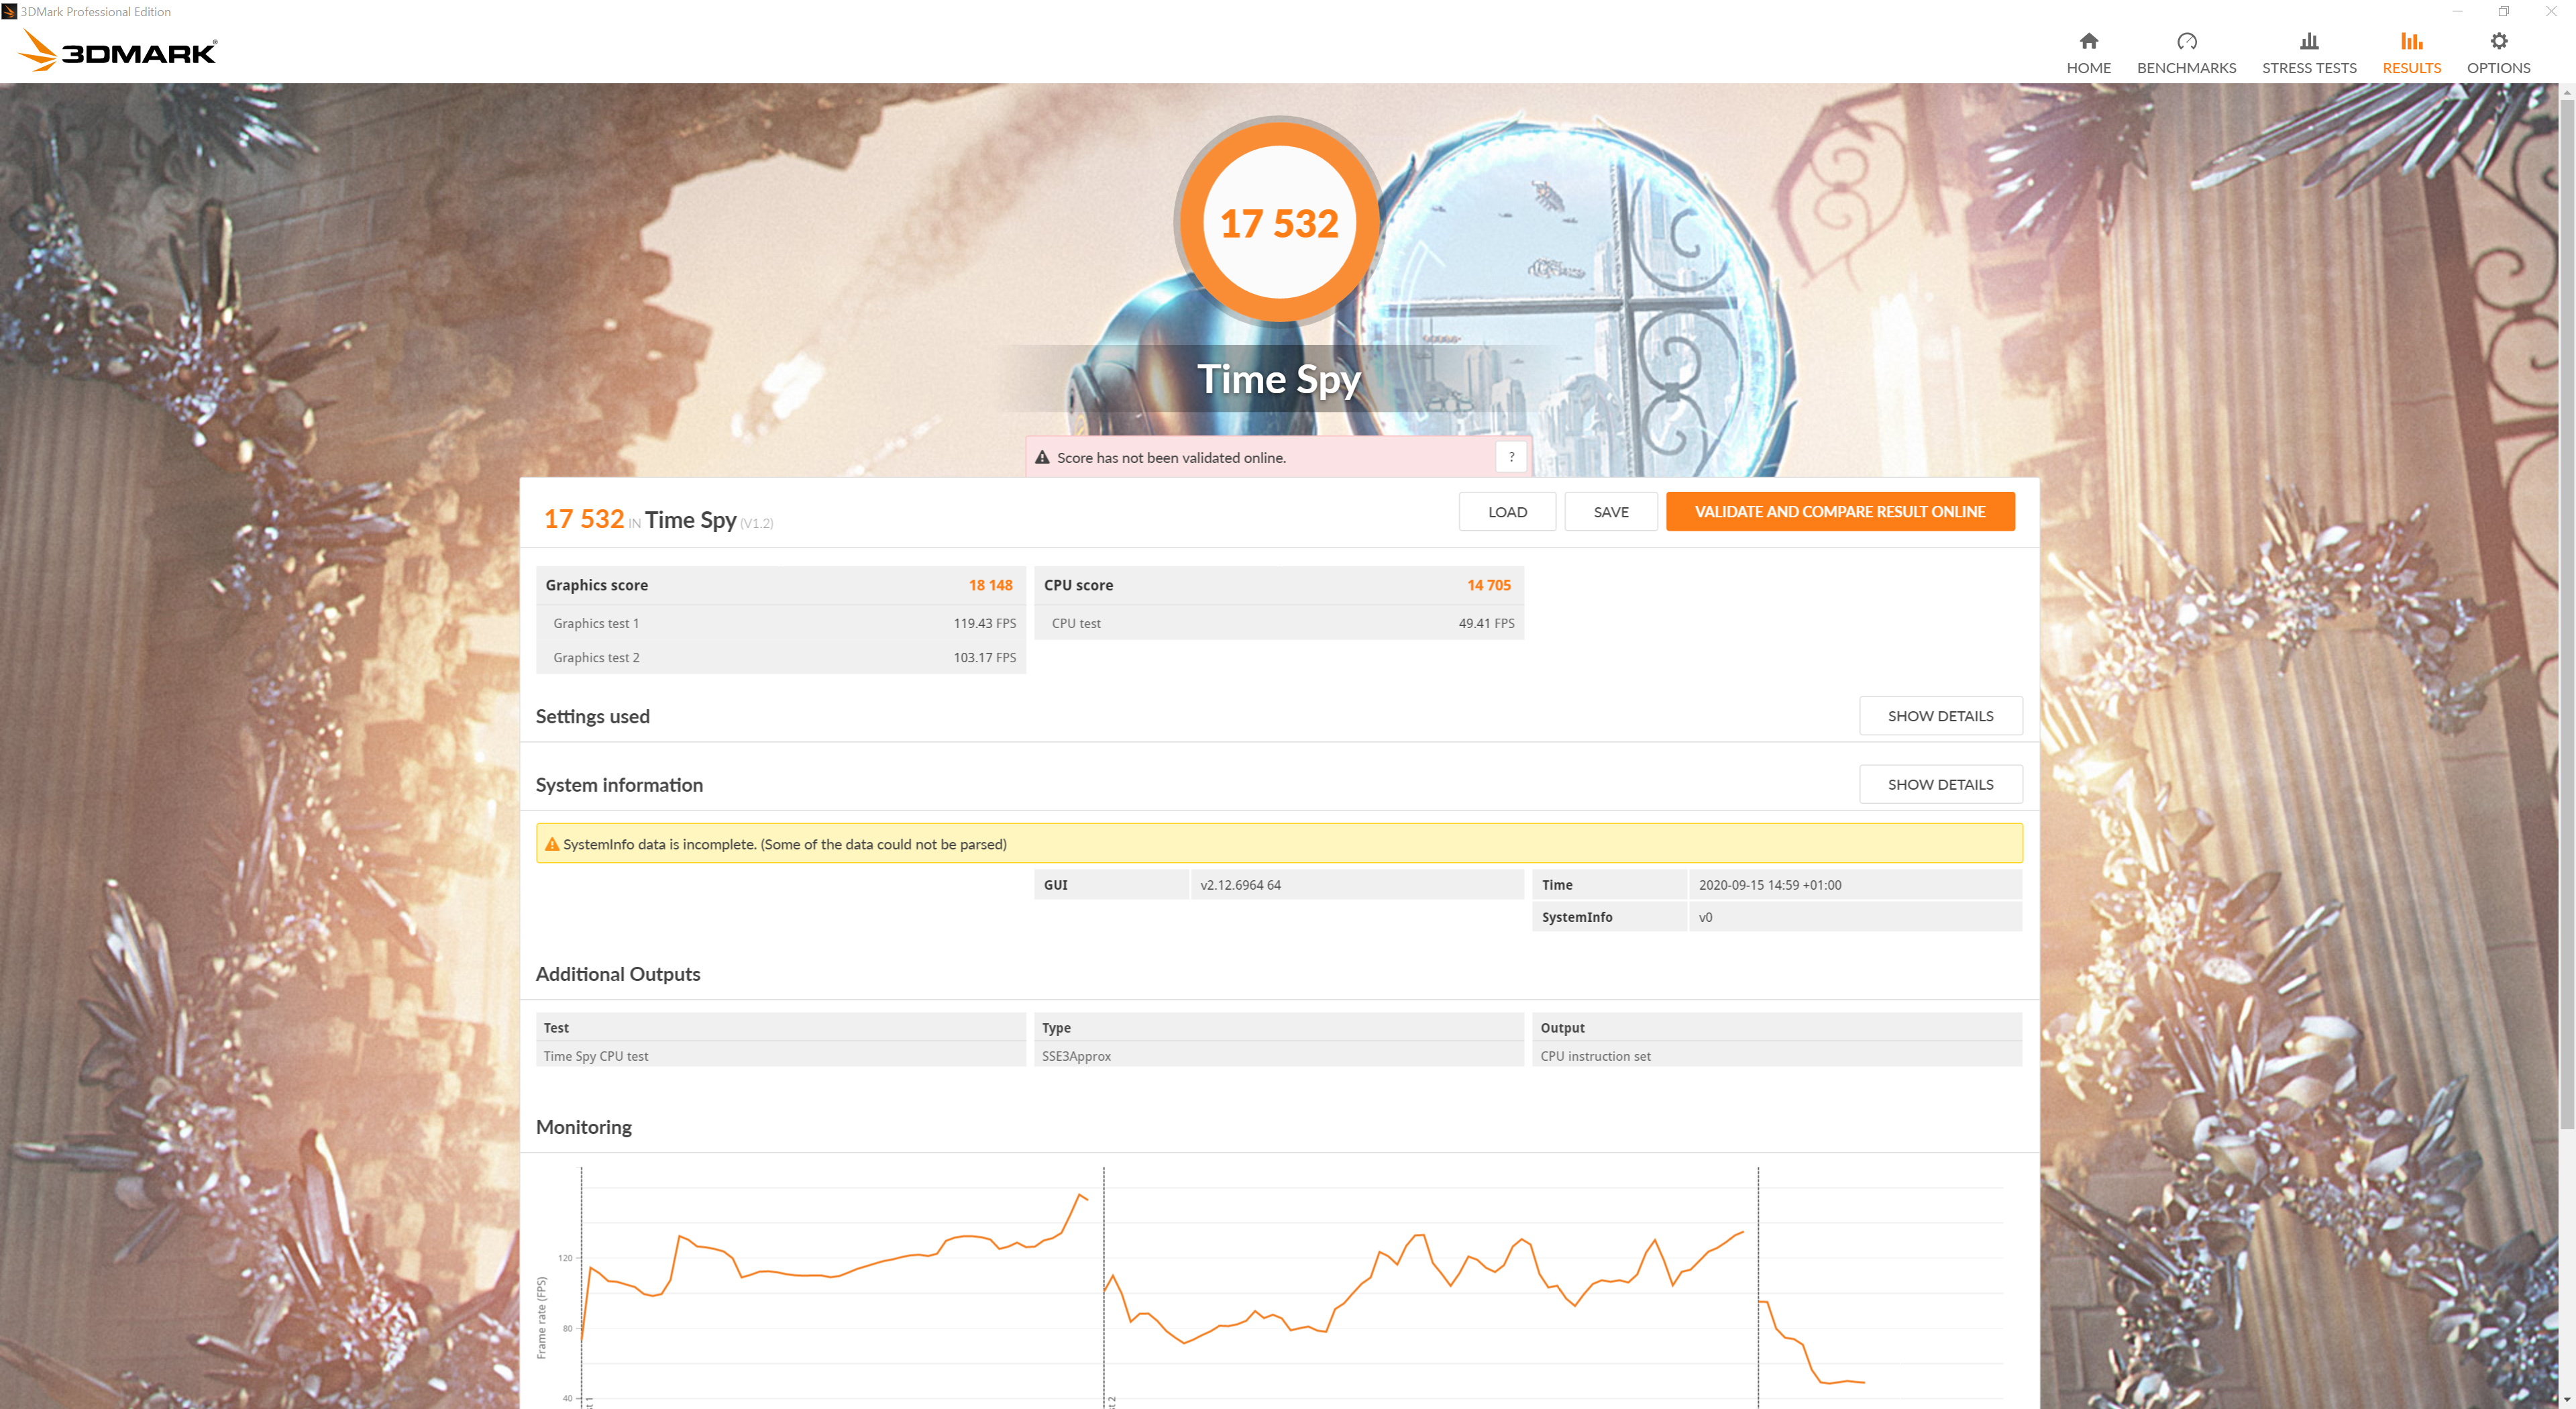
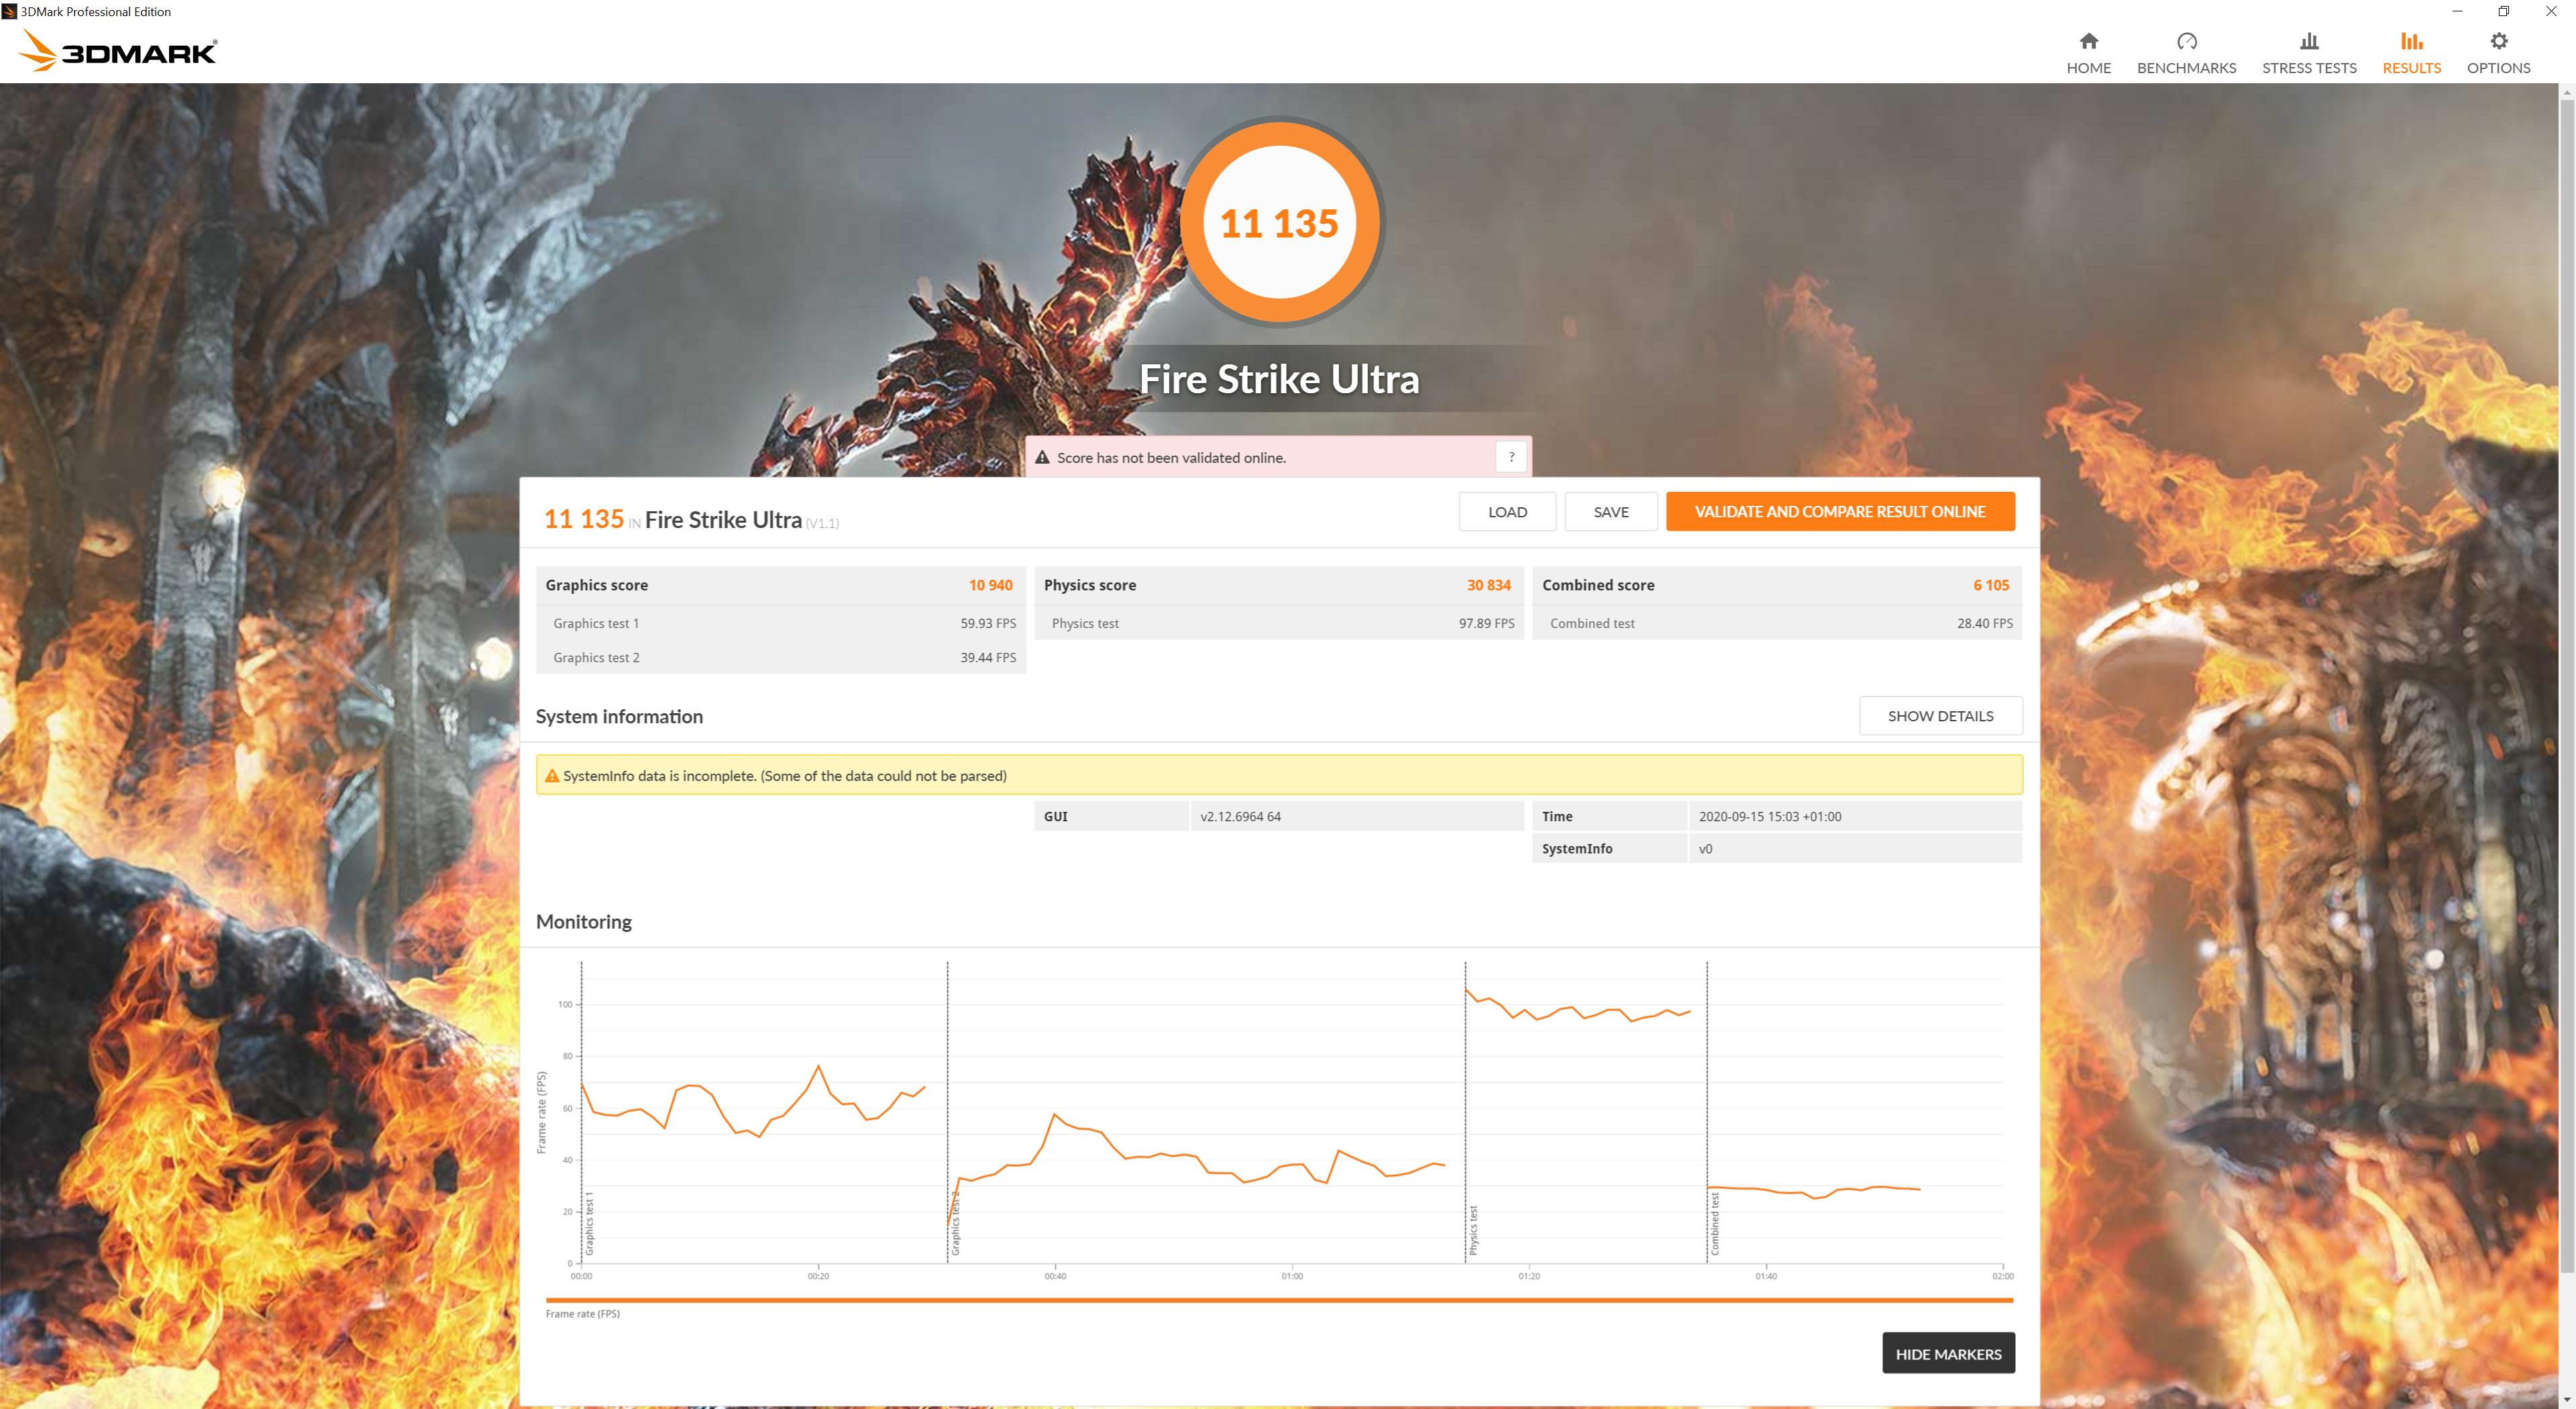
Kicking off with 3DMark, here the TUF Gaming performs very similarly to the Founders Edition, and it is actually marginally behind in Fire Strike. In Time Spy and Fire Strike Ultra, however, we do see the TUF just about edging ahead.
3DMark Port Royal is the world’s first dedicated real-time ray tracing benchmark for gamers. You can use Port Royal to test and compare the real-time ray tracing performance of any graphics card that supports Microsoft DirectX Raytracing. As well as benchmarking performance, 3DMark Port Royal provides a realistic and practical example of what to expect from ray tracing in upcoming games.
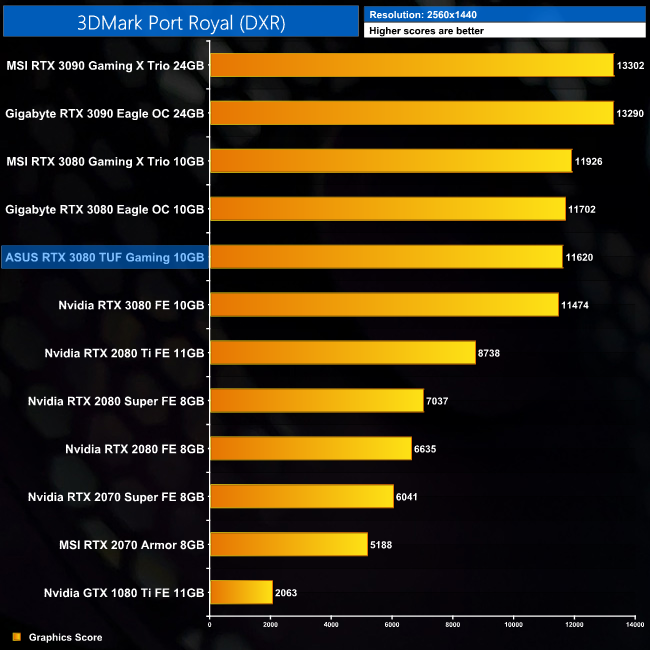
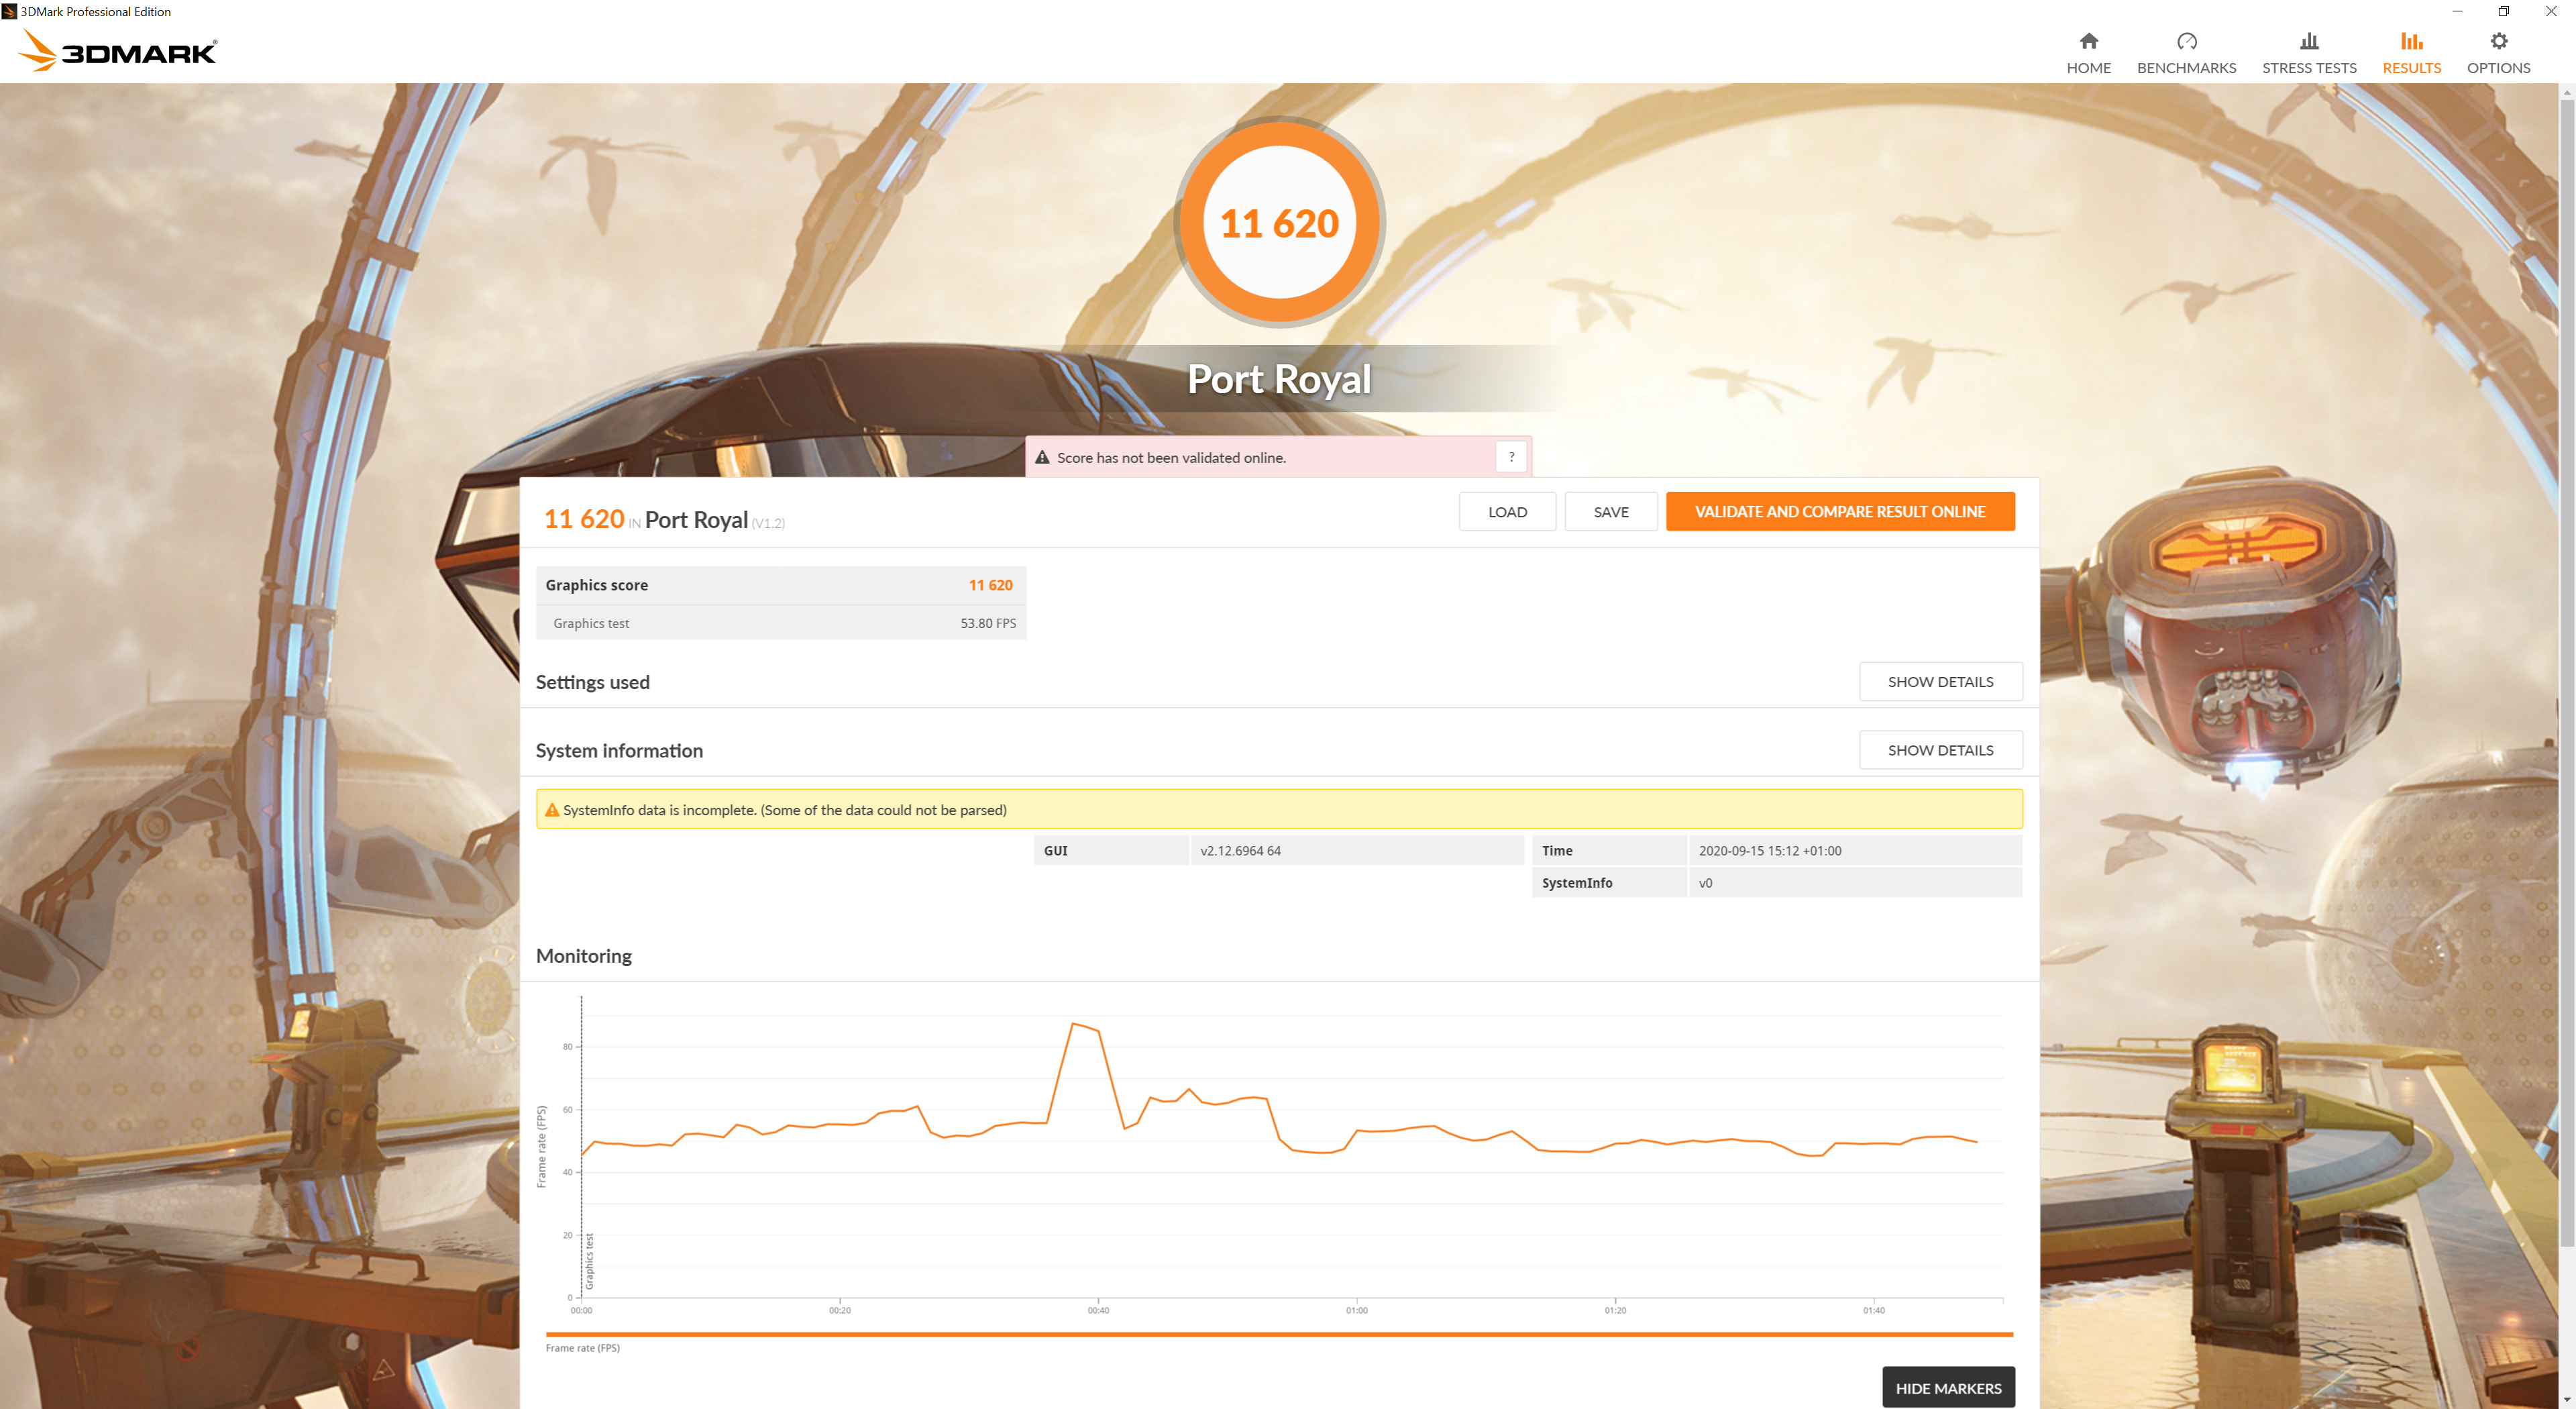
Things are again very close in Port Royal, as the TUF Gaming scores just 146 more points than the Founders Edition, barely a 1% difference.
Control is an action-adventure video game developed by Remedy Entertainment and published by 505 Games. Control was released on 27 August 2019 for Microsoft Windows, PlayStation 4, and Xbox One. (Wikipedia).
Engine: Northlight Engine. We test using the High preset, with 4x MSAA, DX12 API.
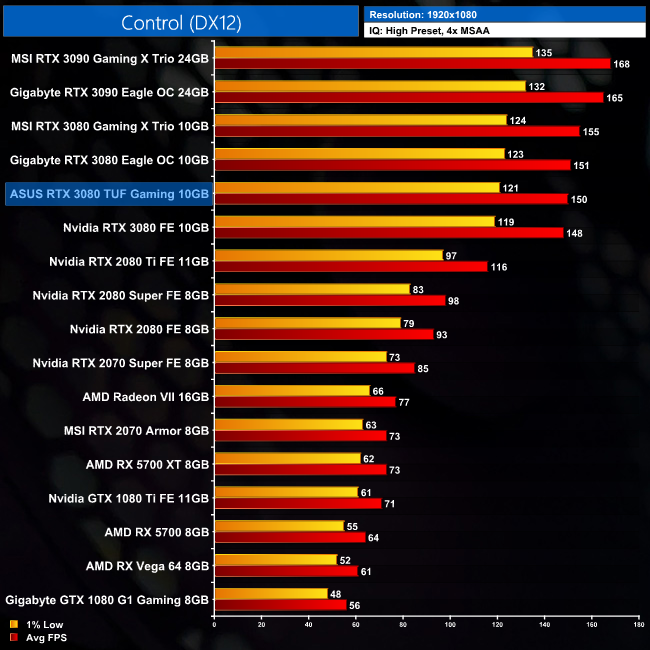
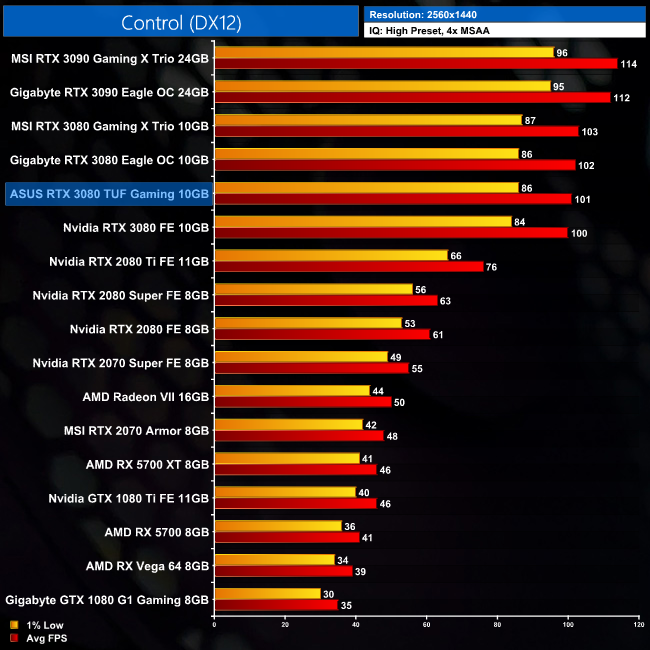
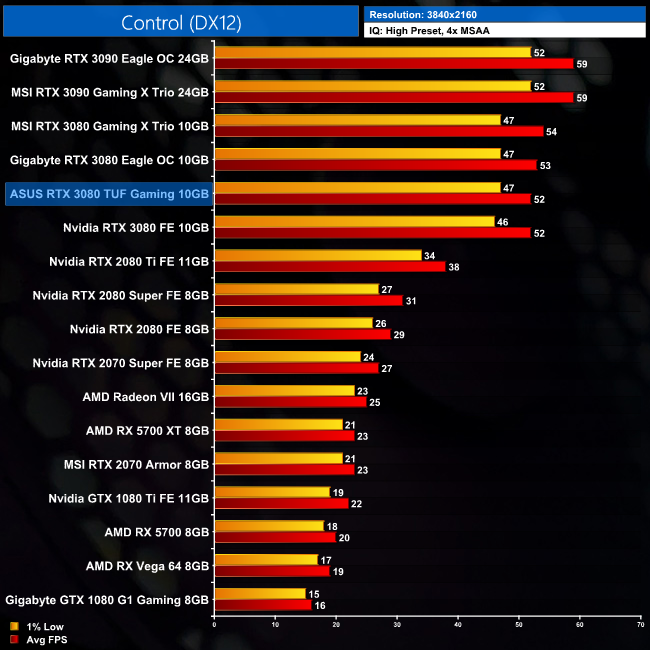
In Control, at 4K we can see the ASUS TUF Gaming RTX 3080 exactly matching the Founders Edition, hitting 52FPS on average. This means the TUF is 37% faster than the RTX 2080 Ti, but 4% slower than the MSI RTX 3080 Gaming X Trio.
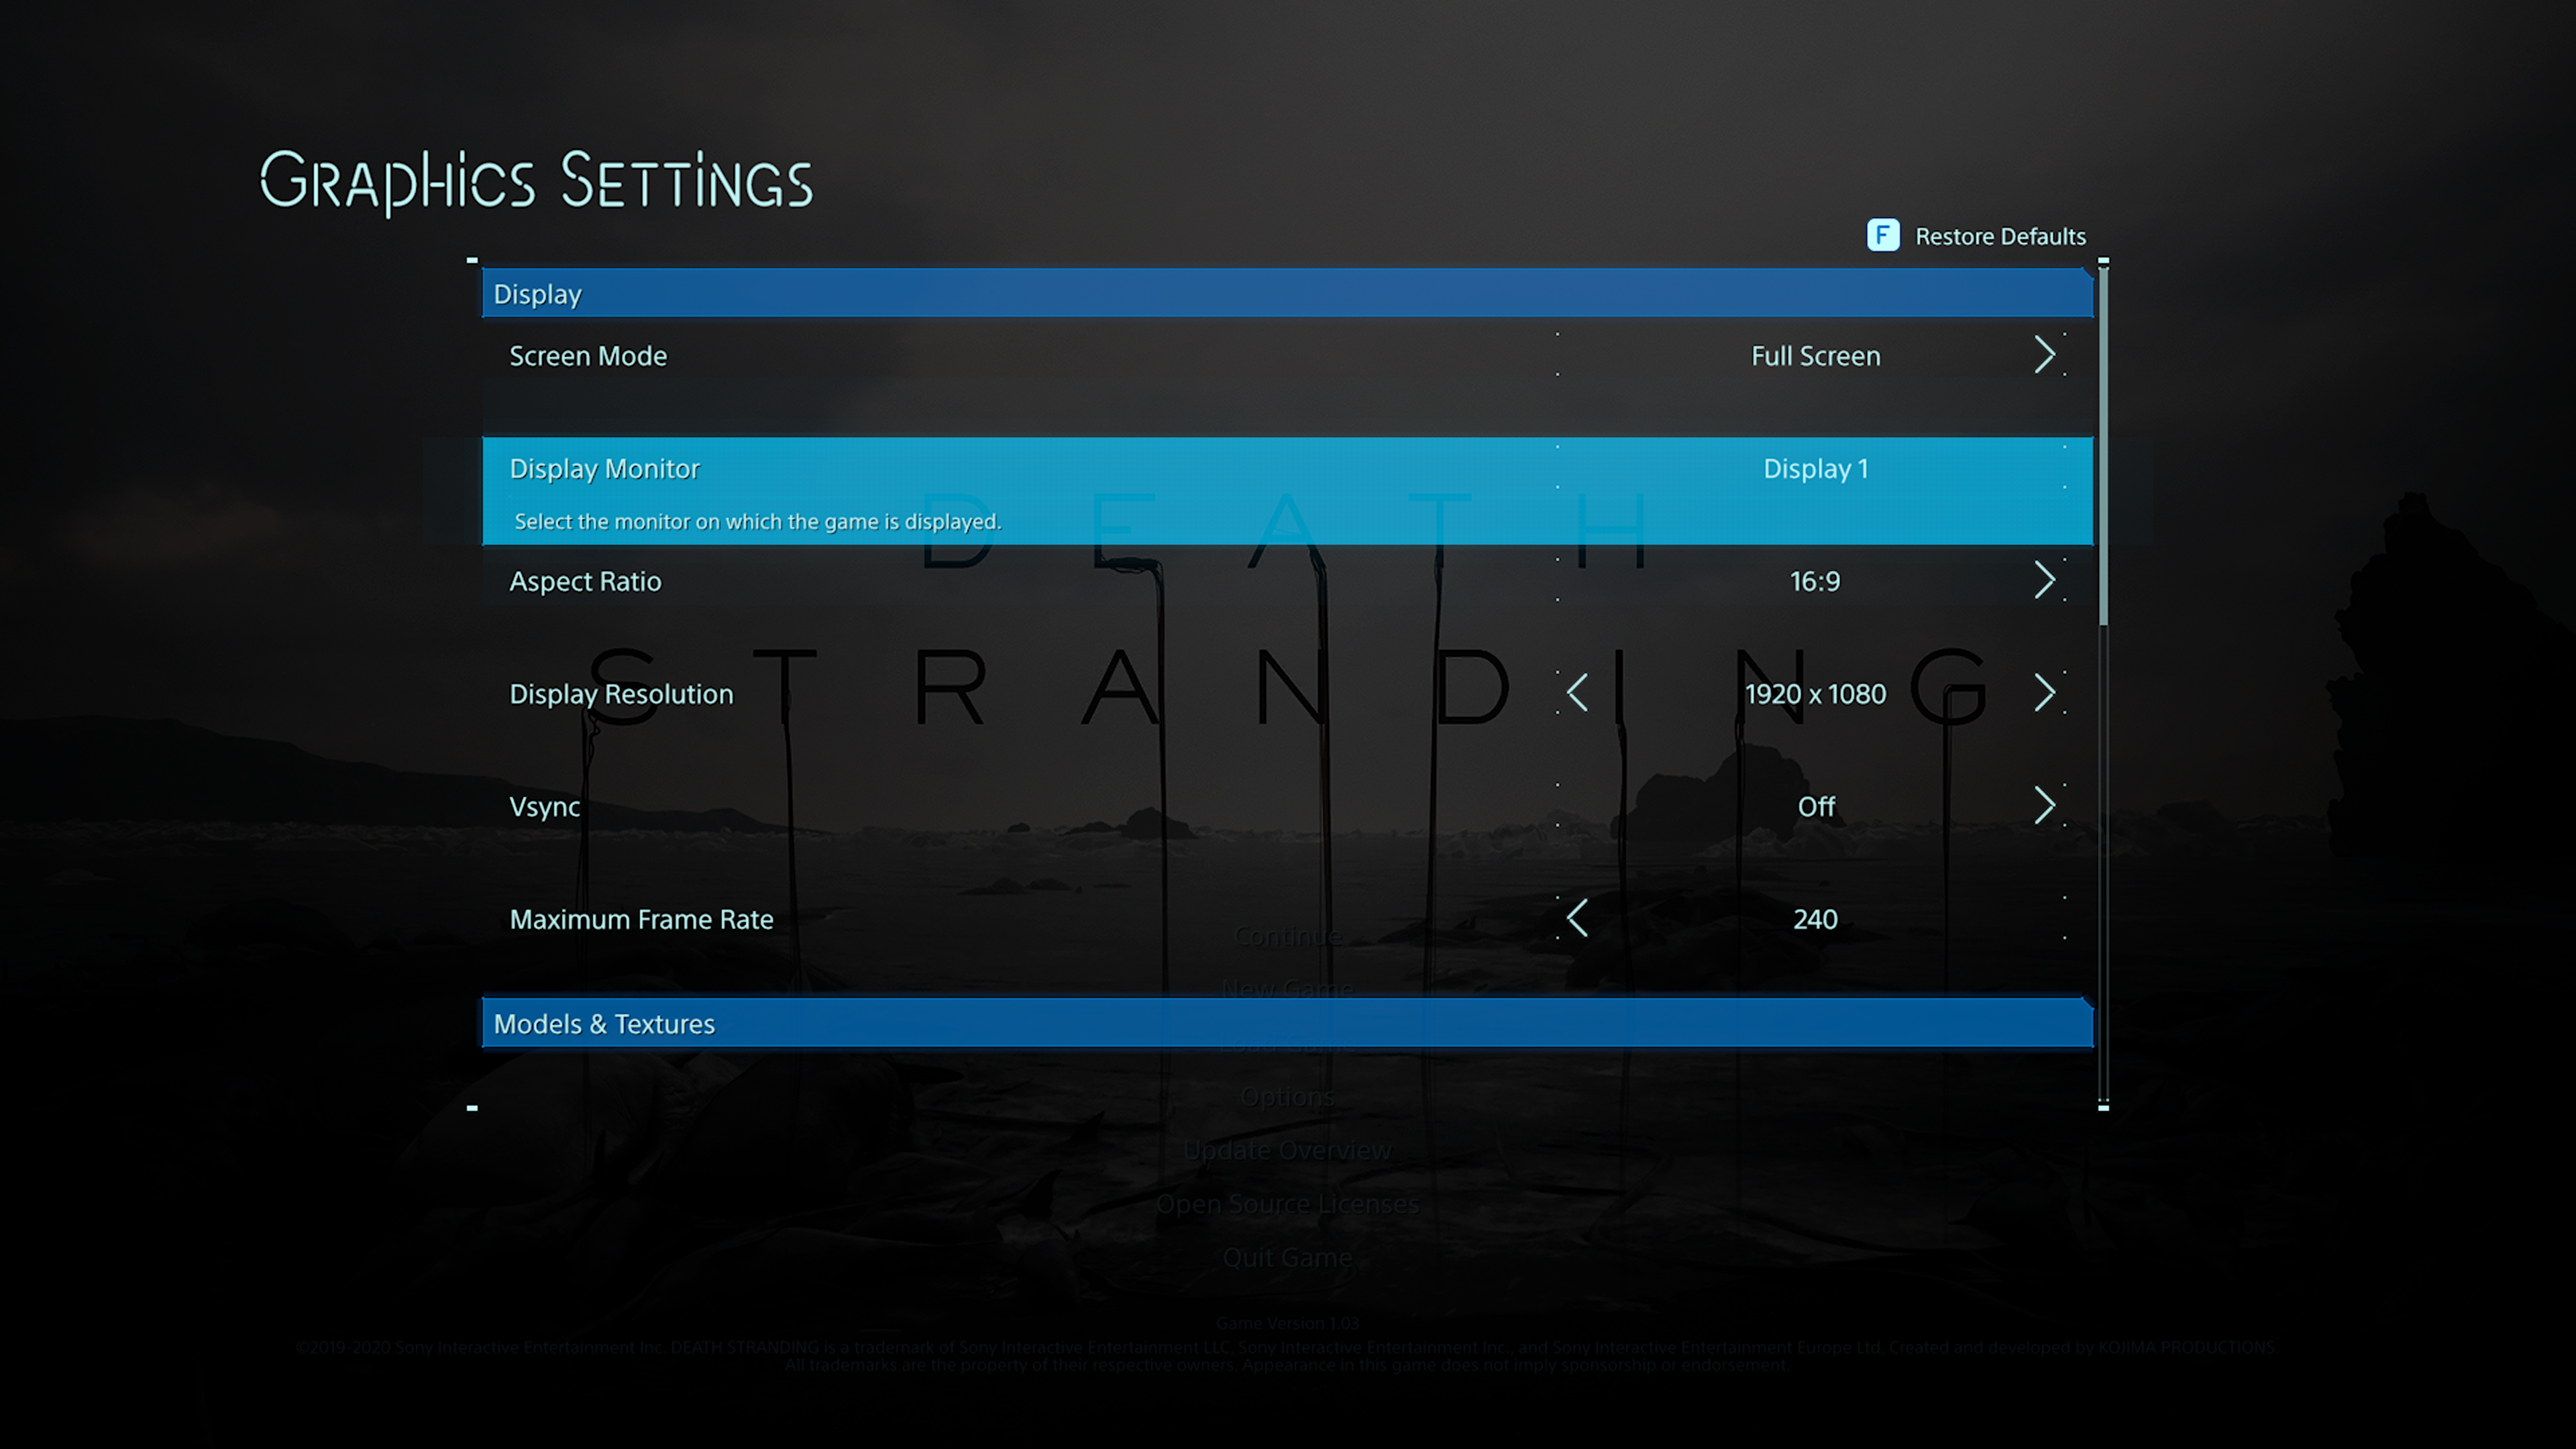
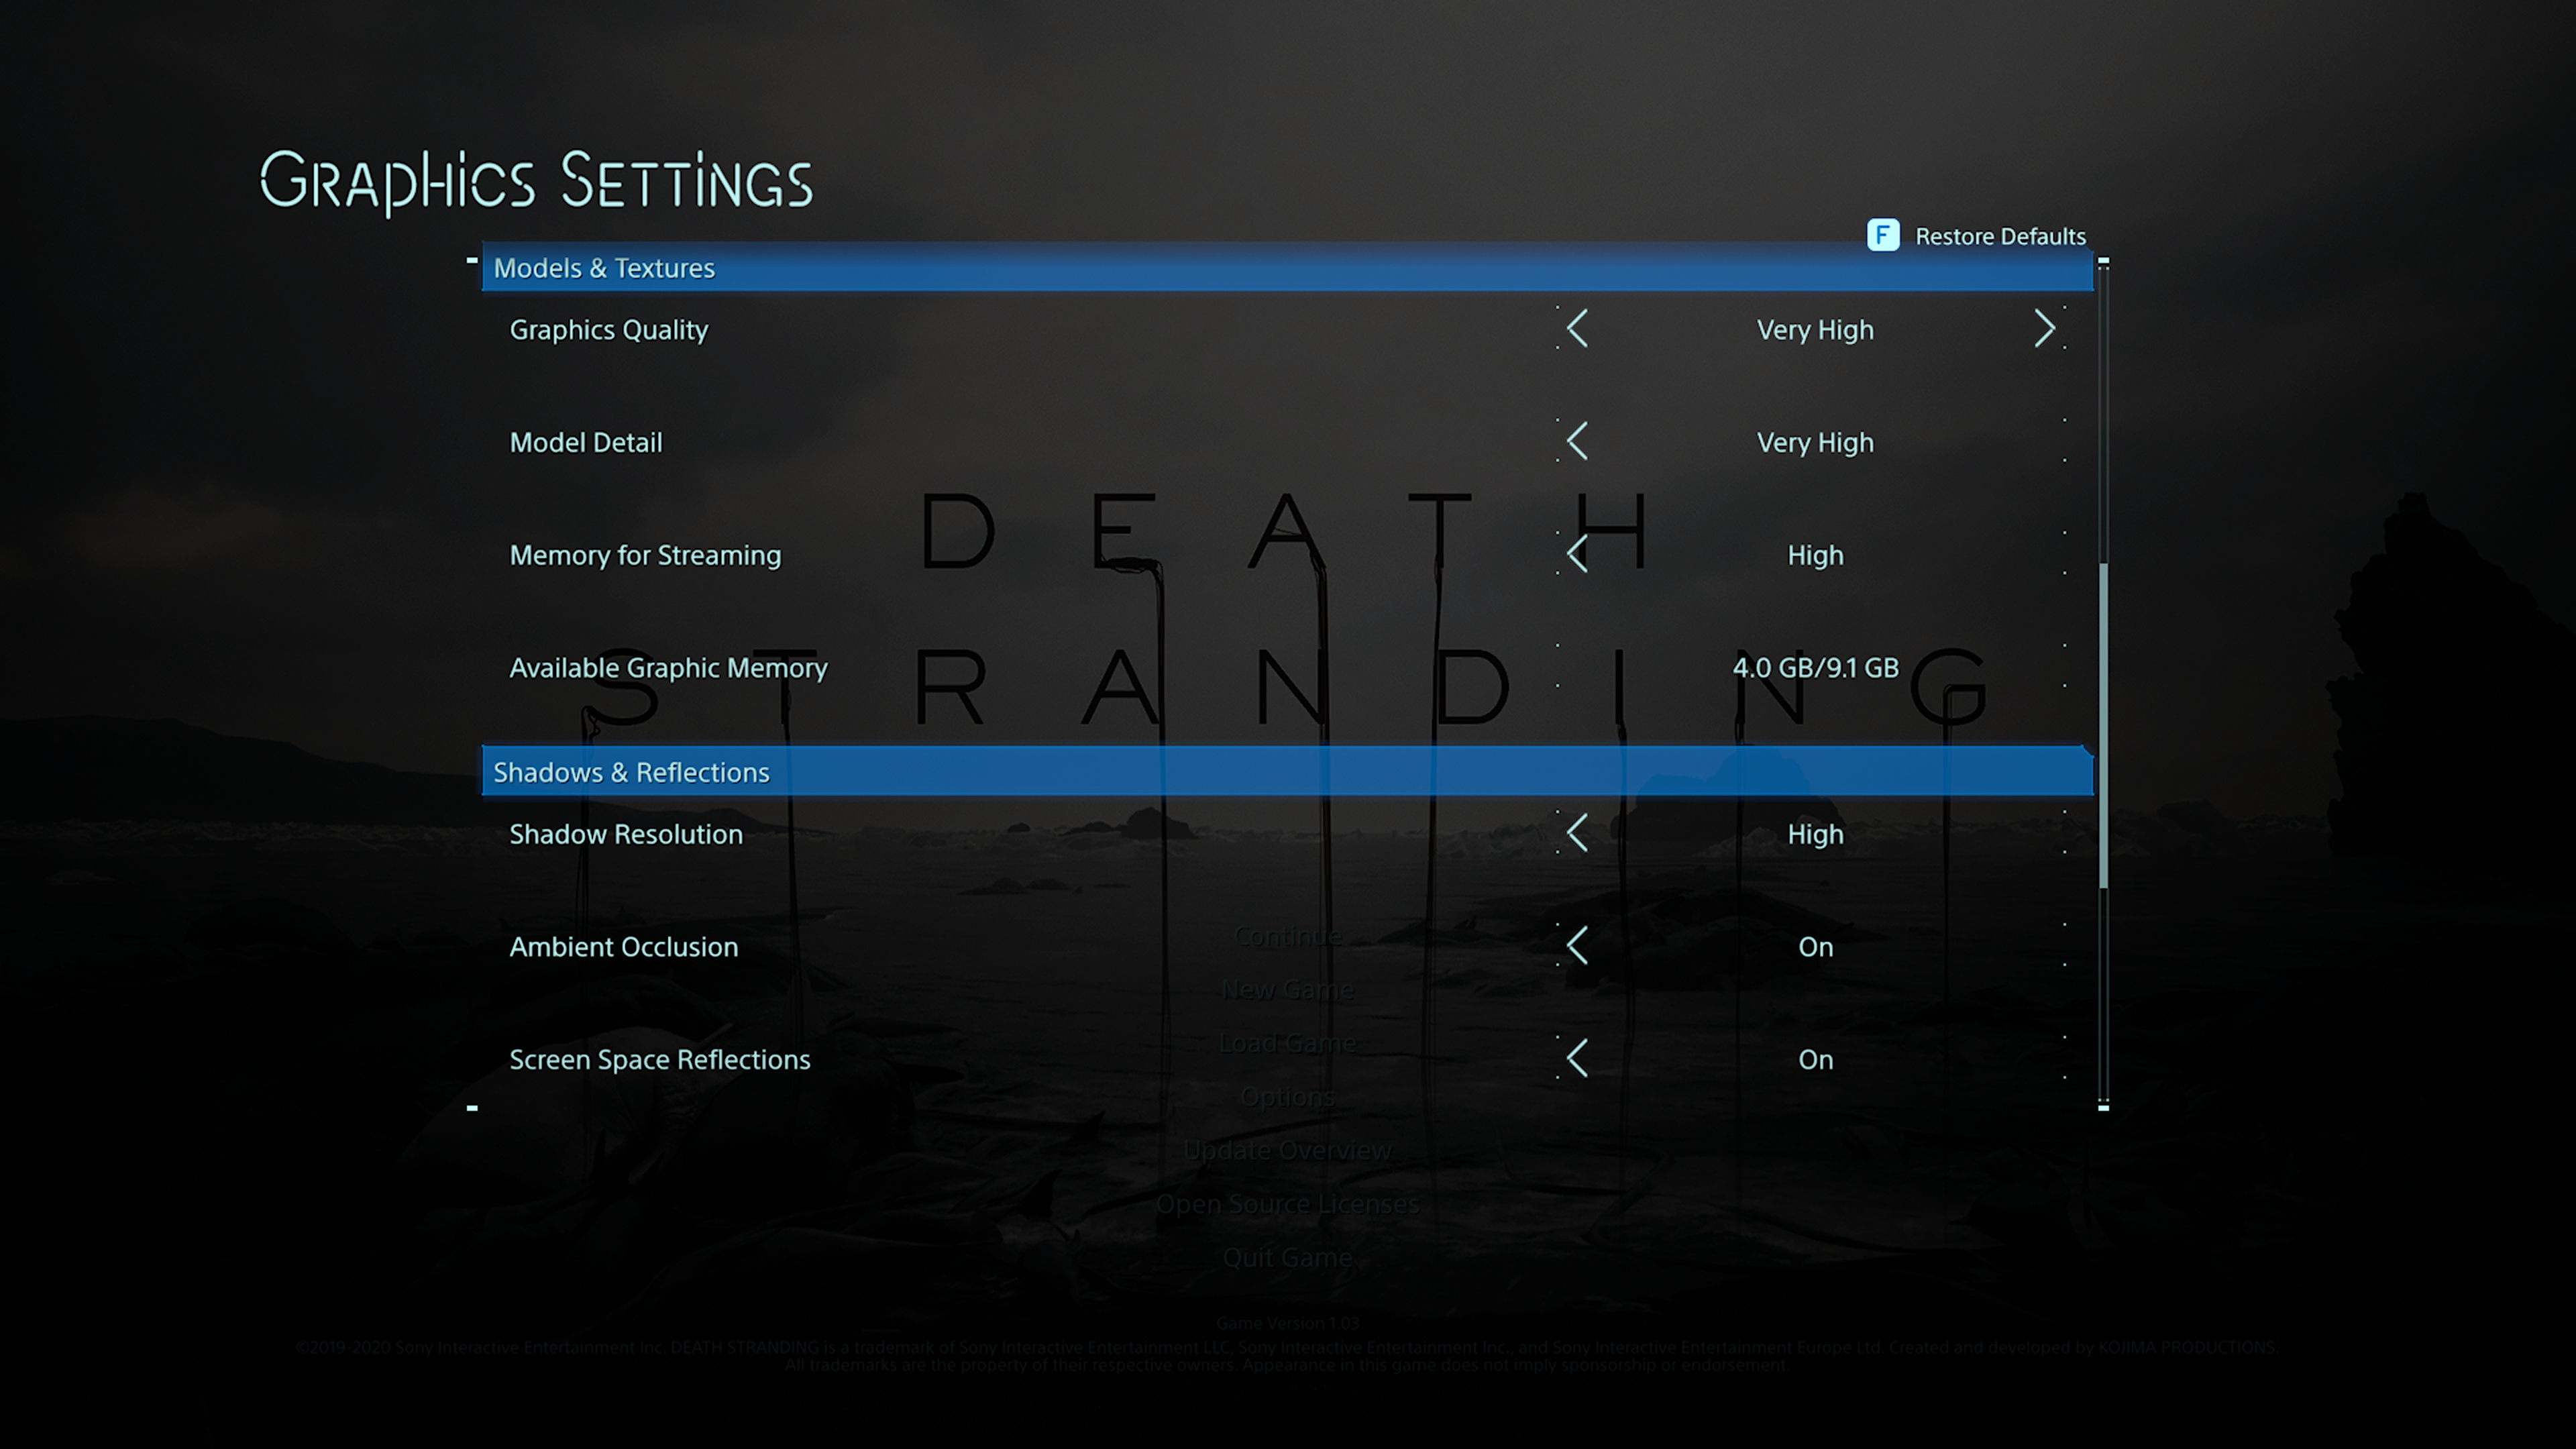
Death Stranding is an action game developed by Kojima Productions. It is the first game from director Hideo Kojima and Kojima Productions after their split from Konami in 2015. It was released by Sony Interactive Entertainment for the PlayStation 4 in November 2019 and by 505 Games for Windows in July 2020. (Wikipedia).
Engine: Decima. We test using the Very High preset, with TAA, DX12 API.
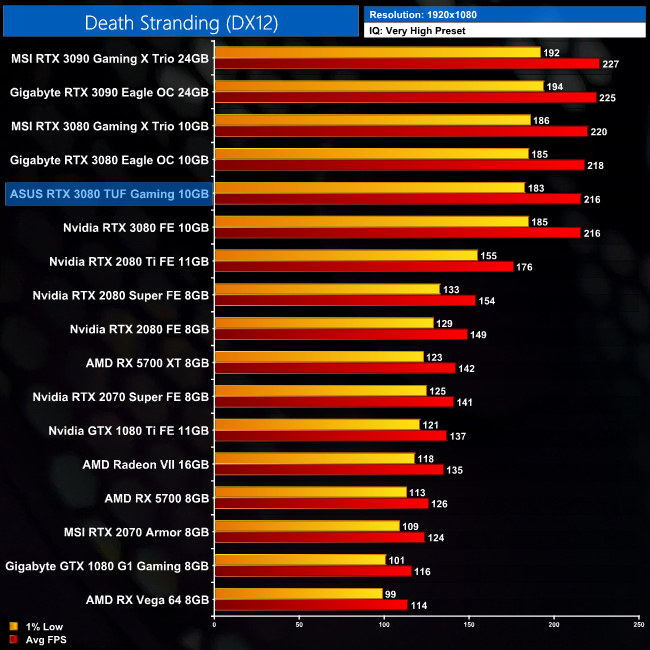
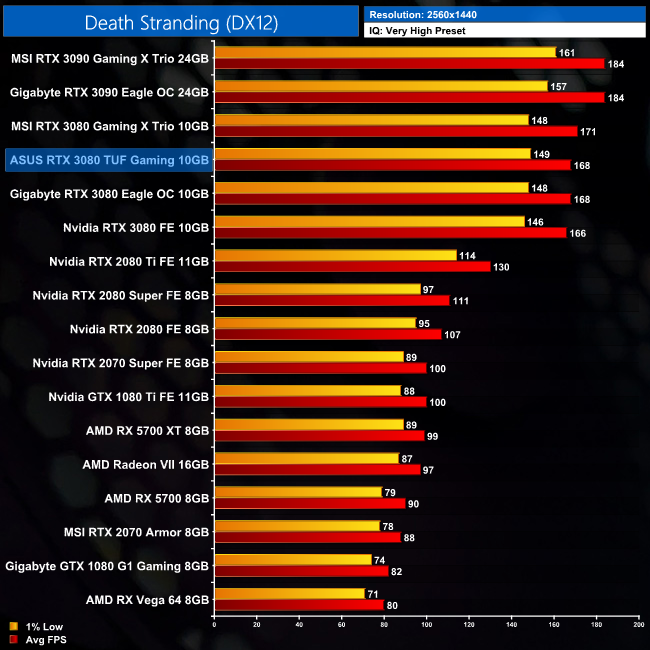
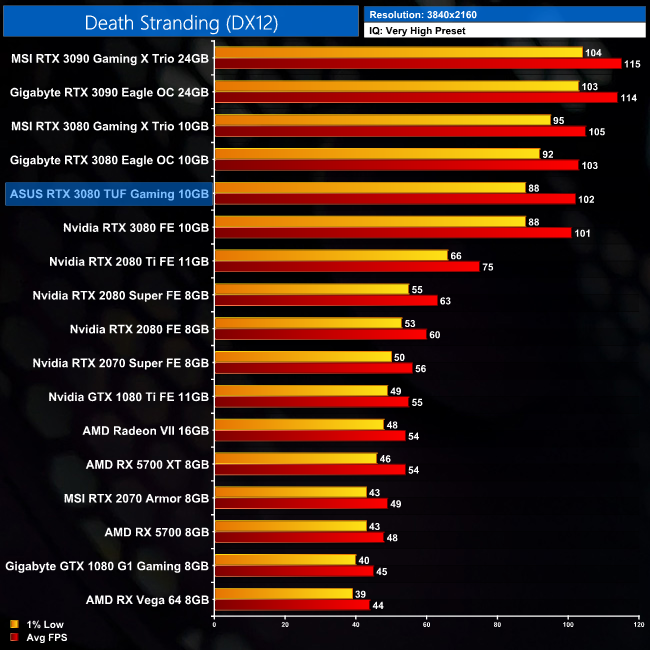
In Death Stranding, the TUF Gaming takes a slim lead over the Founders Edition, with an advantage of just 2FPS at 1440p, and a single frame at 4K.
Tom Clancy's The Division 2 is an online action role-playing video game developed by Massive Entertainment and published by Ubisoft. The sequel to Tom Clancy's The Division (2016), it is set in a near-future Washington, D.C. in the aftermath of a smallpox pandemic, and follows an agent of the Strategic Homeland Division as they try to rebuild the city. (Wikipedia).
Engine: Snowdrop. We test using the Ultra preset, but with V-Sync disabled, DX12 API.
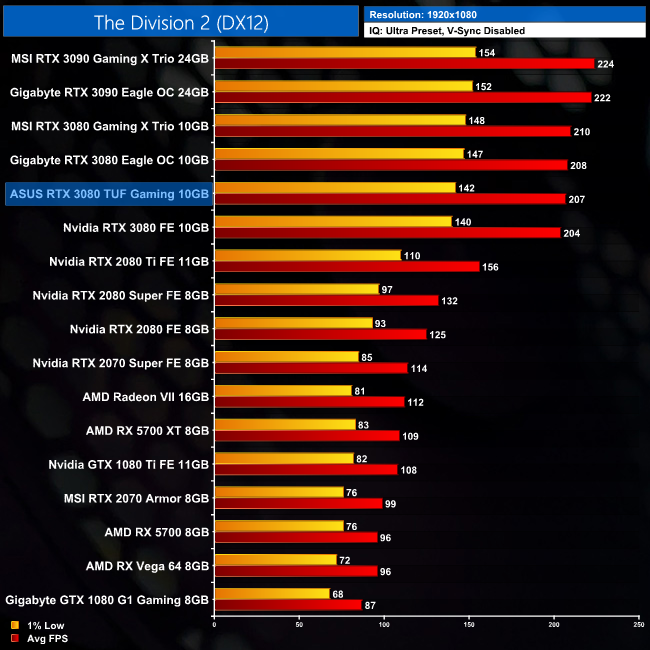
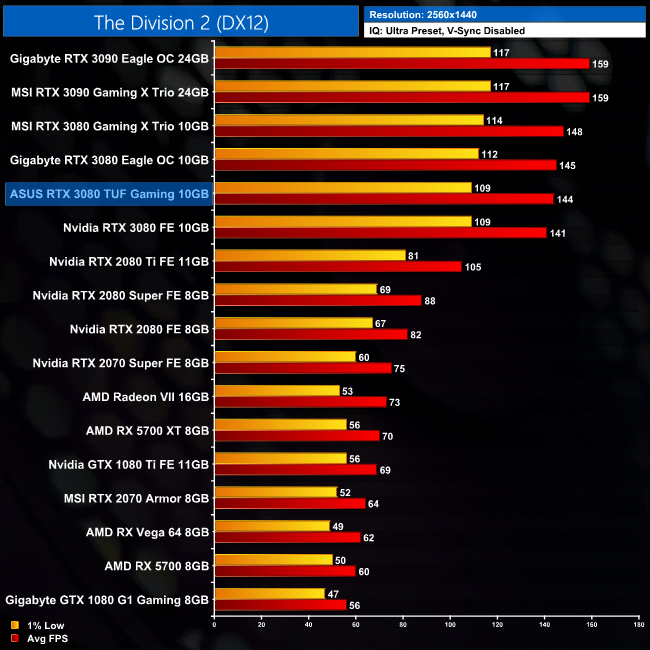
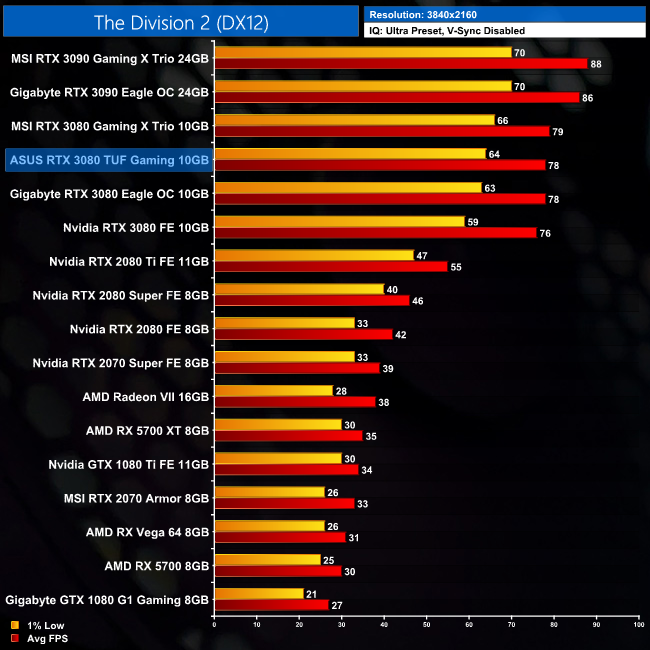
The Division 2 sees the ASUS TUF Gaming RTX 3080 outperform Nvidia's Founders Edition by 3% at 4K. This is the joint-biggest lead for the TUF that we will see across all of our testing today.
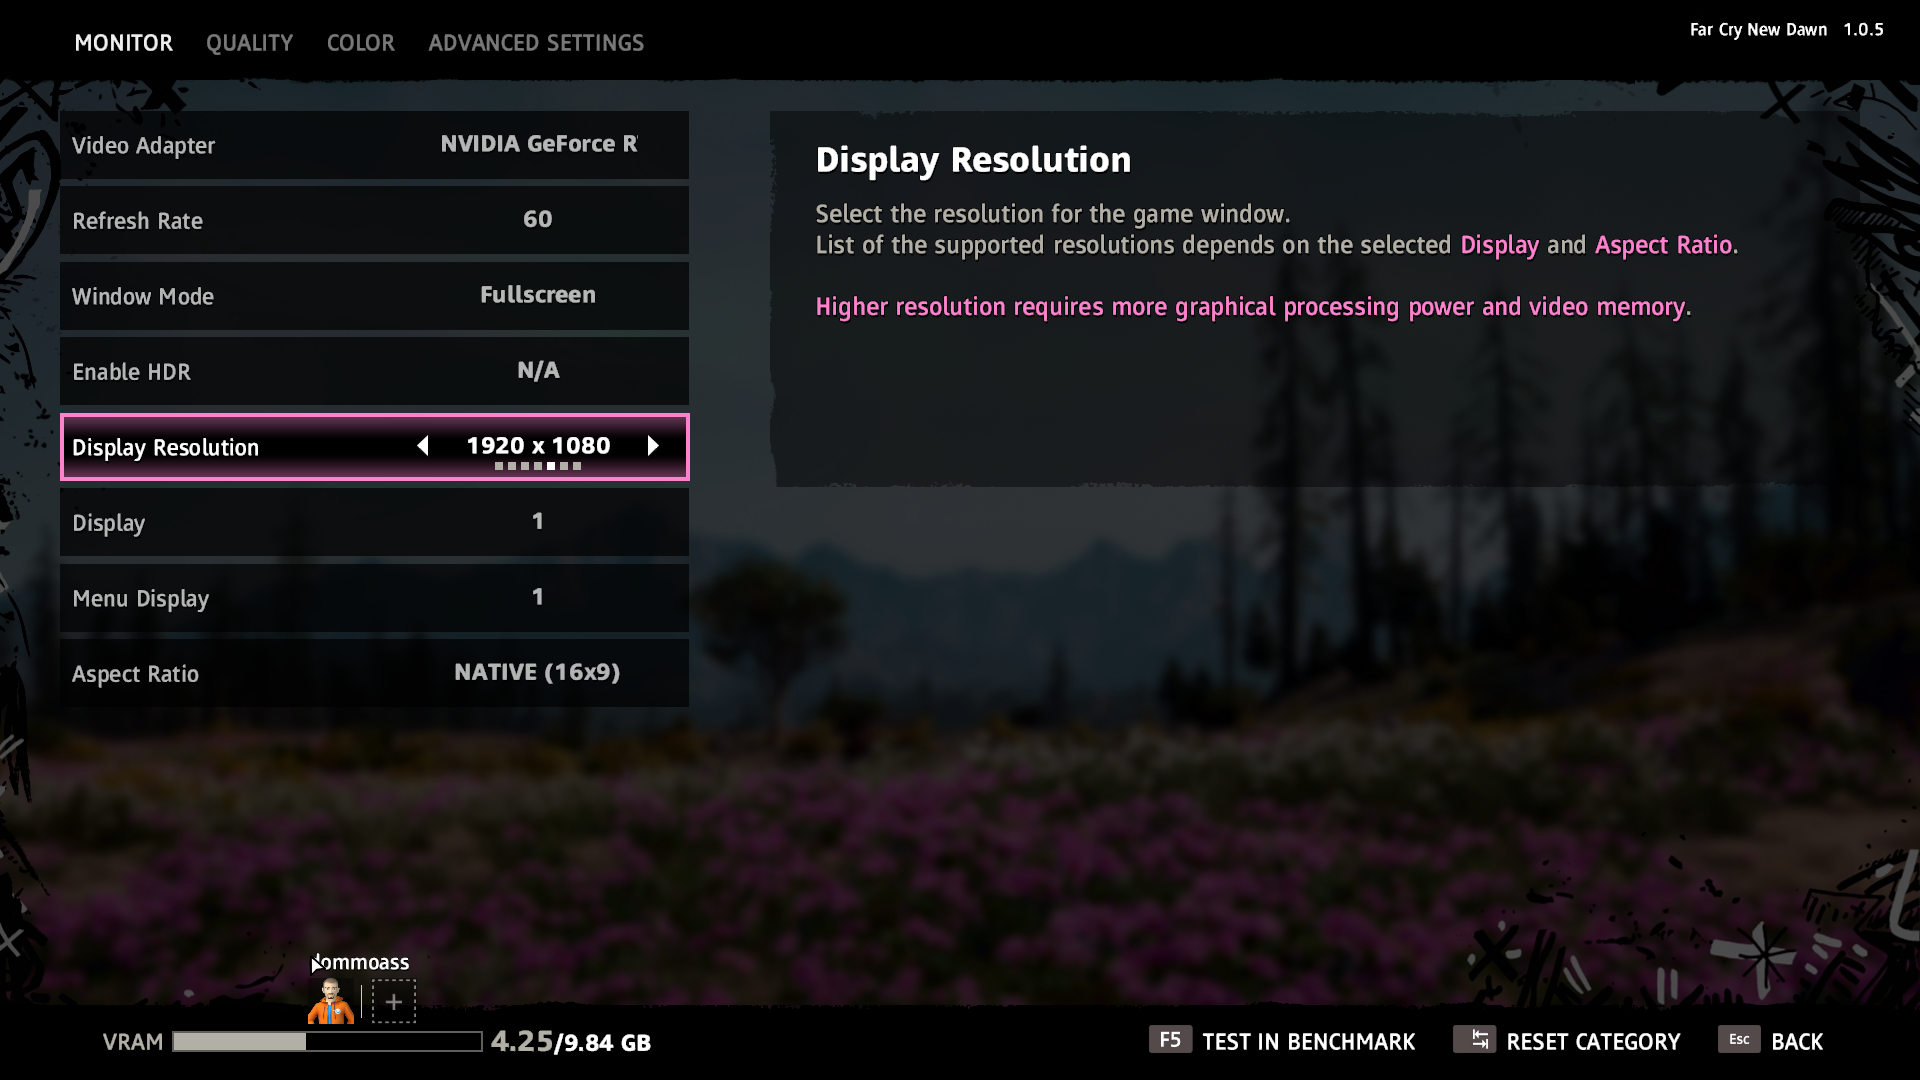
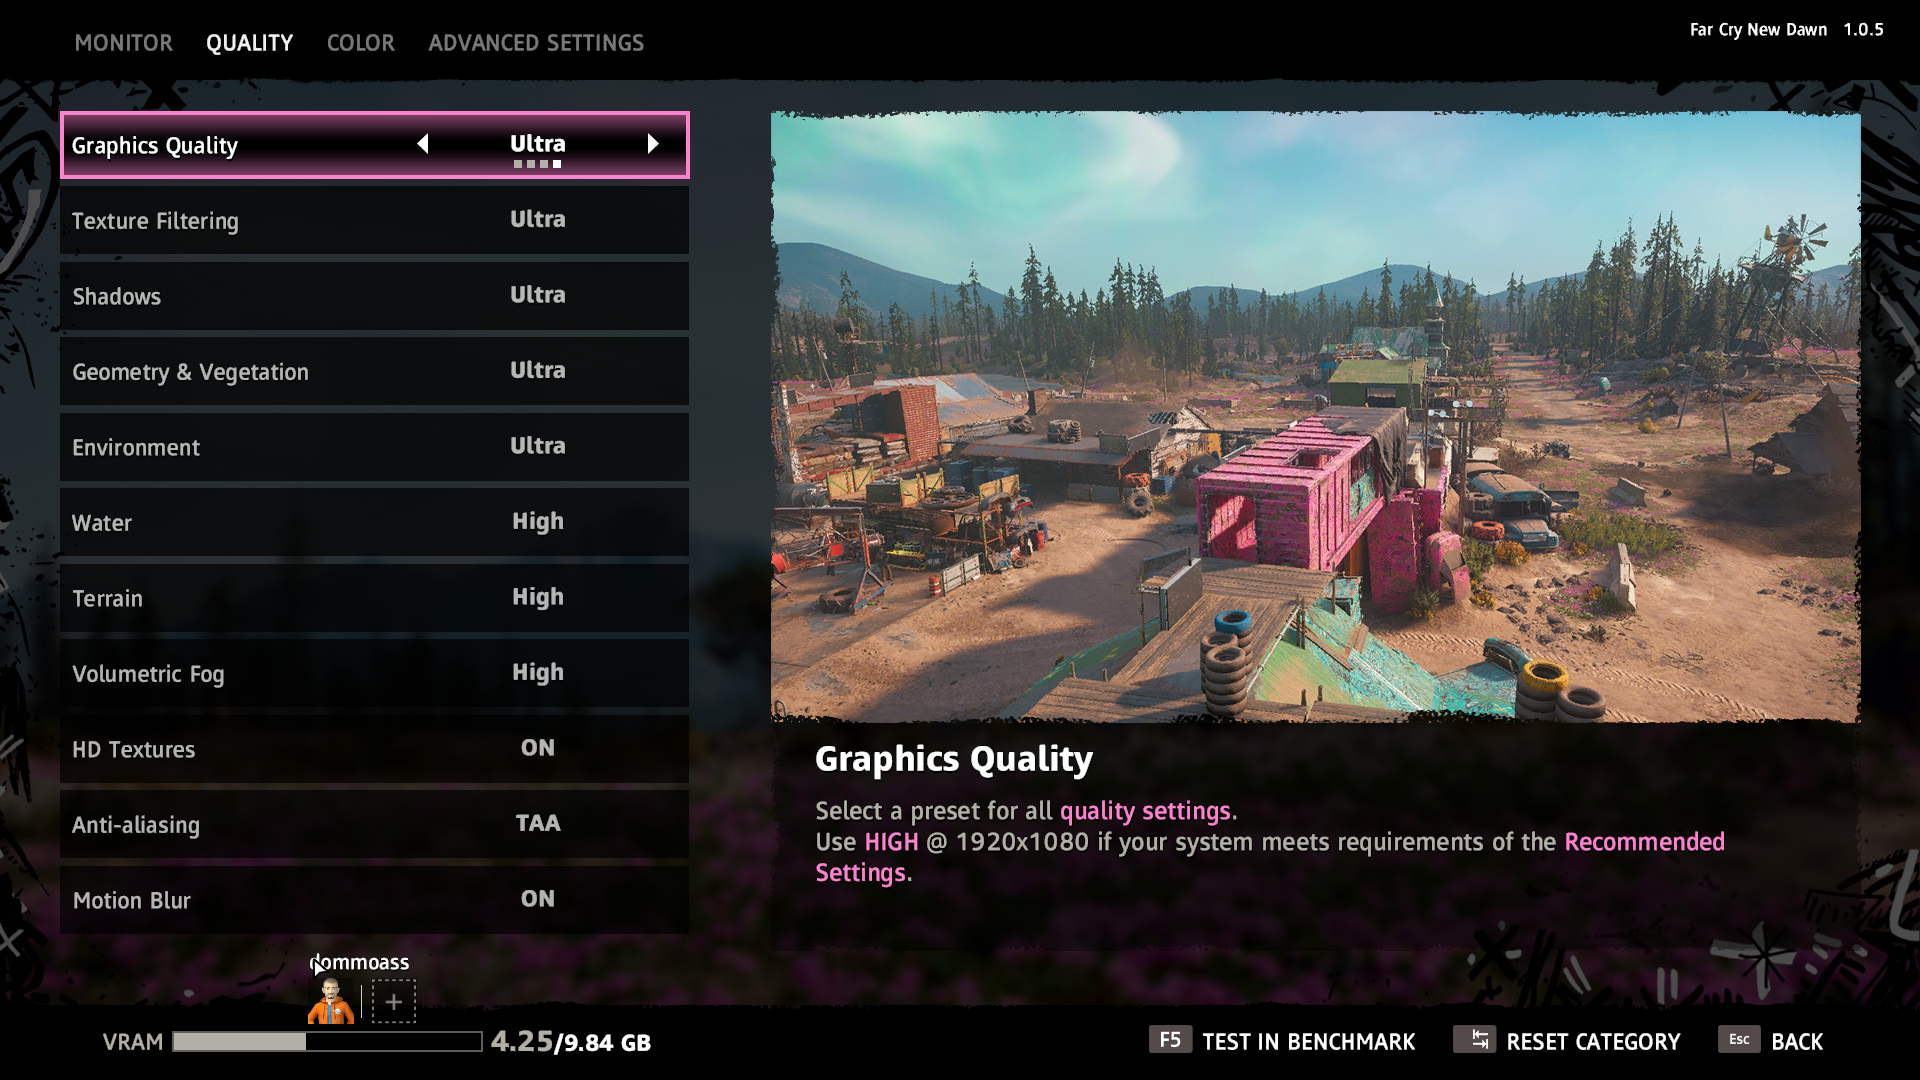
Far Cry New Dawn is an action-adventure first-person shooter developed by Ubisoft Montreal and published by Ubisoft. The game is a spin-off of the Far Cry series and a narrative sequel to Far Cry 5. It was released for Microsoft Windows, PlayStation 4 and Xbox One on February 15, 2019. (Wikipedia).
Engine: Dunia 2. We test using the Ultra preset, with the HD Textures pack, DX11 API.
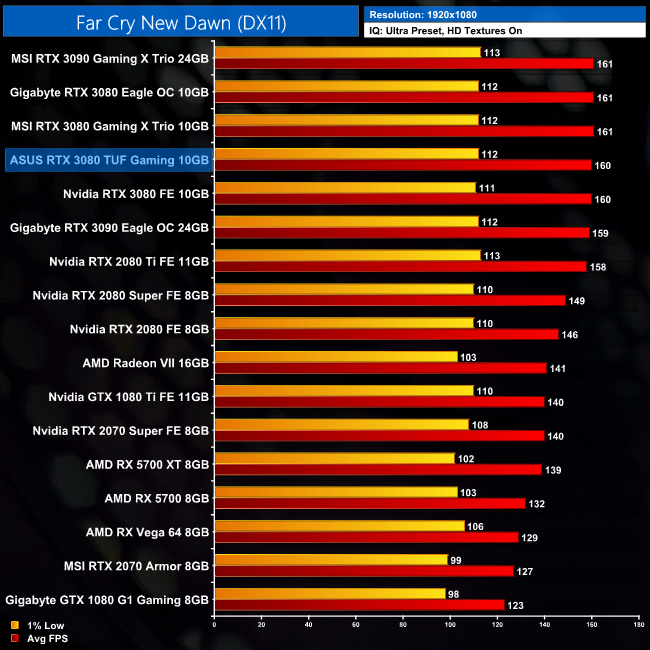
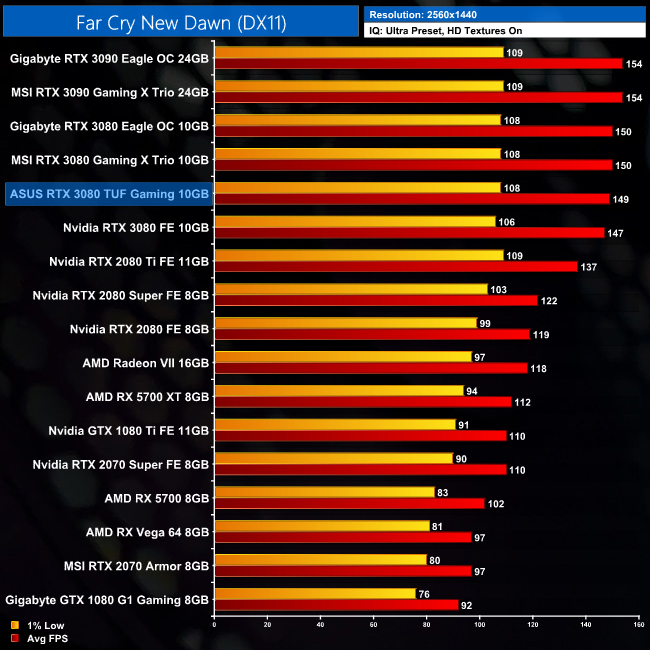
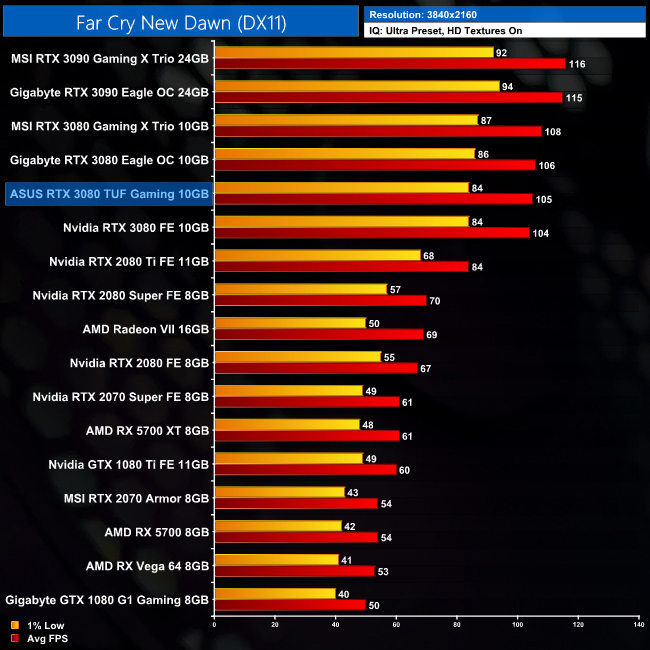
Far Cry New Dawn is heavily CPU bottlenecked at 1080p, and even at 1440p to a lesser extent. At 4K, the TUF Gaming RTX 3080 takes a 25% lead over the RTX 2080 Ti, while it is a single frame faster than the Founders Edition.
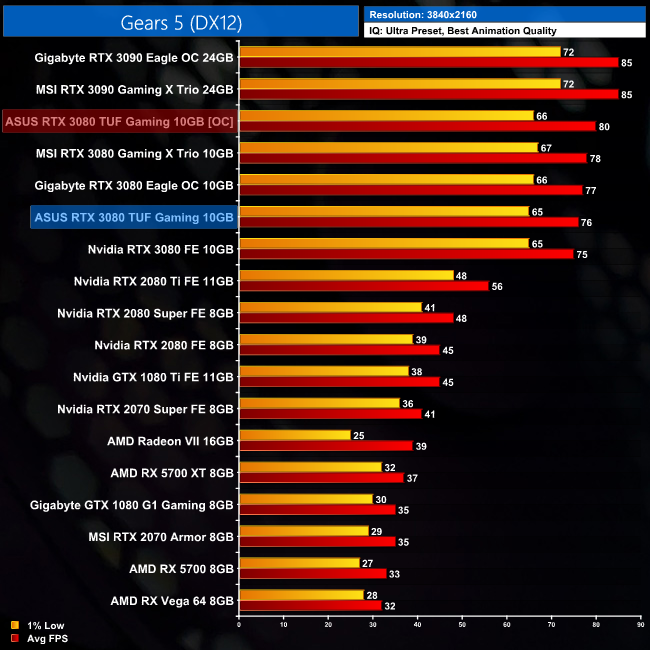
Gears 5 is a third-person shooter video game developed by The Coalition and published by Xbox Game Studios for Xbox One, Microsoft Windows and Xbox Series X. It is the fifth installment of the Gears of War series and the sequel to Gears of War 4. The ultimate edition was released on September 6, 2019, while the standard edition of the game was released worldwide on September 10, 2019. (Wikipedia).
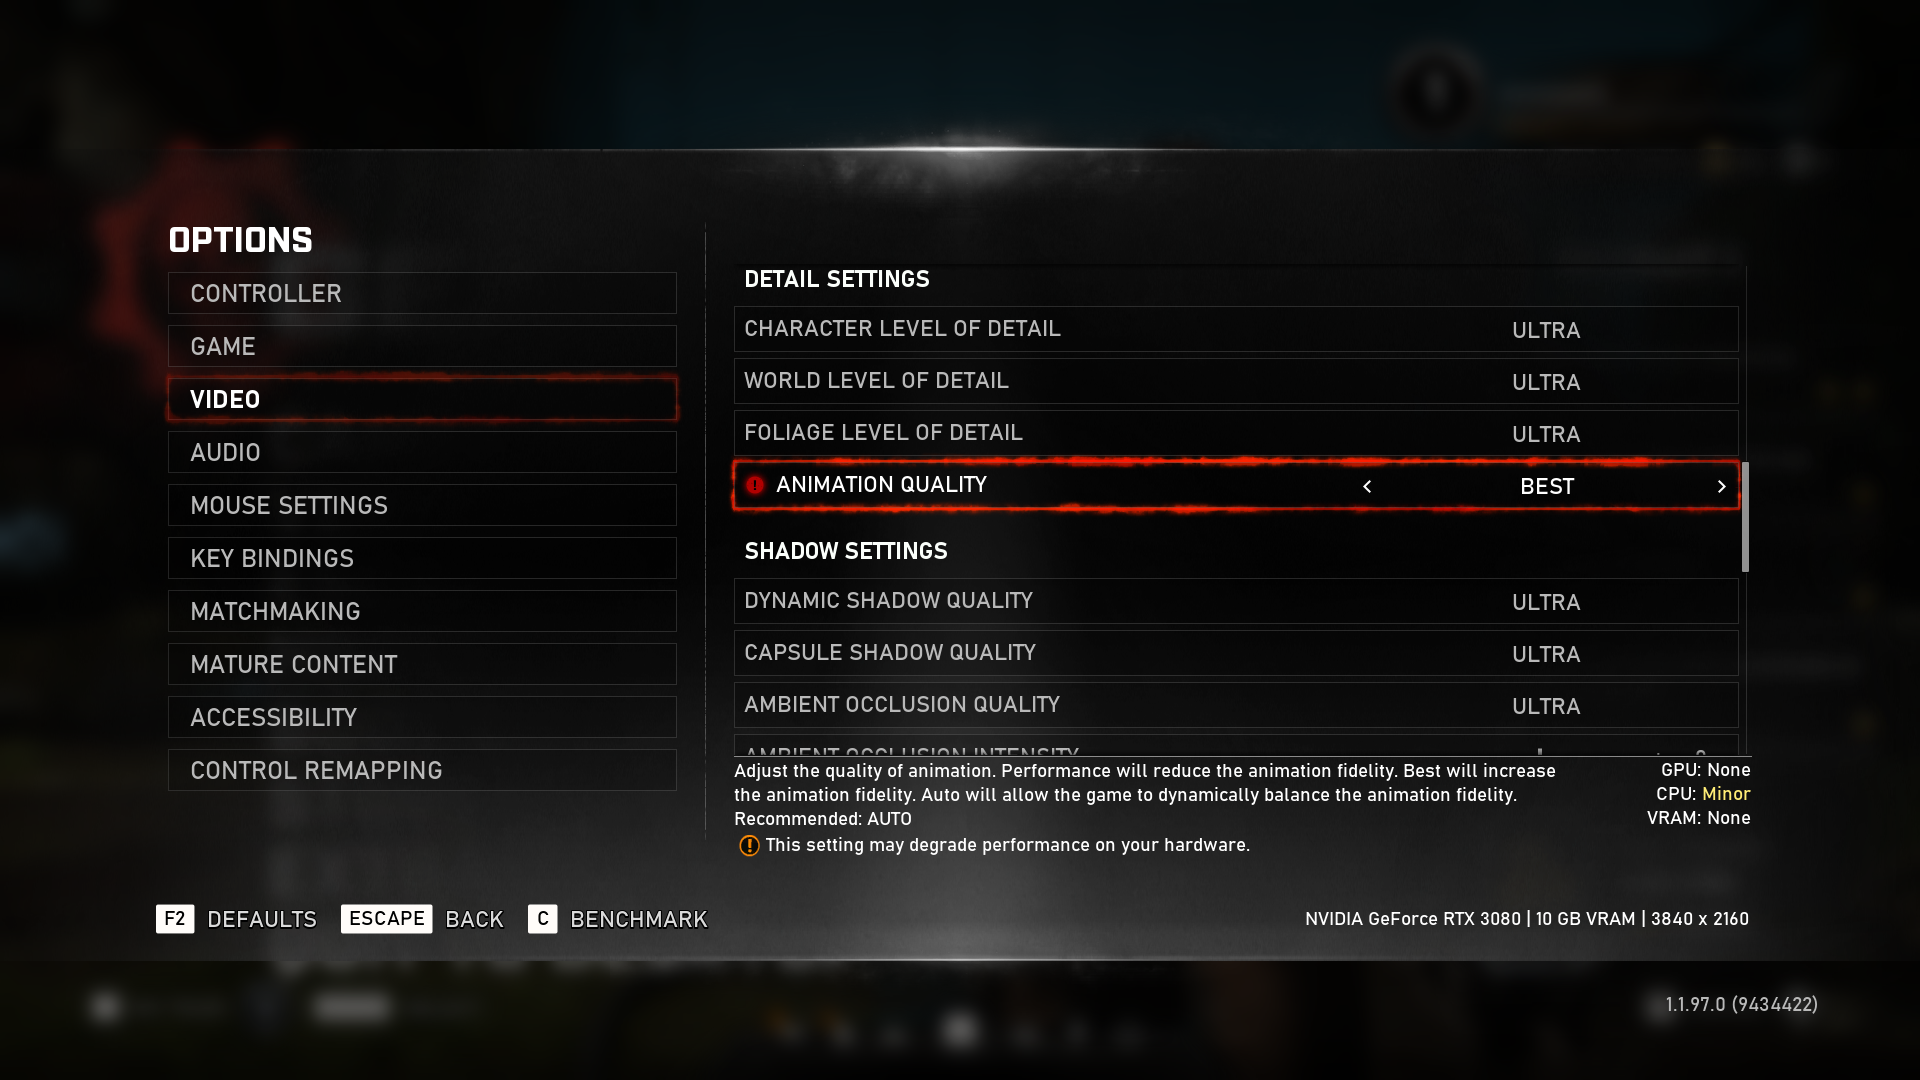
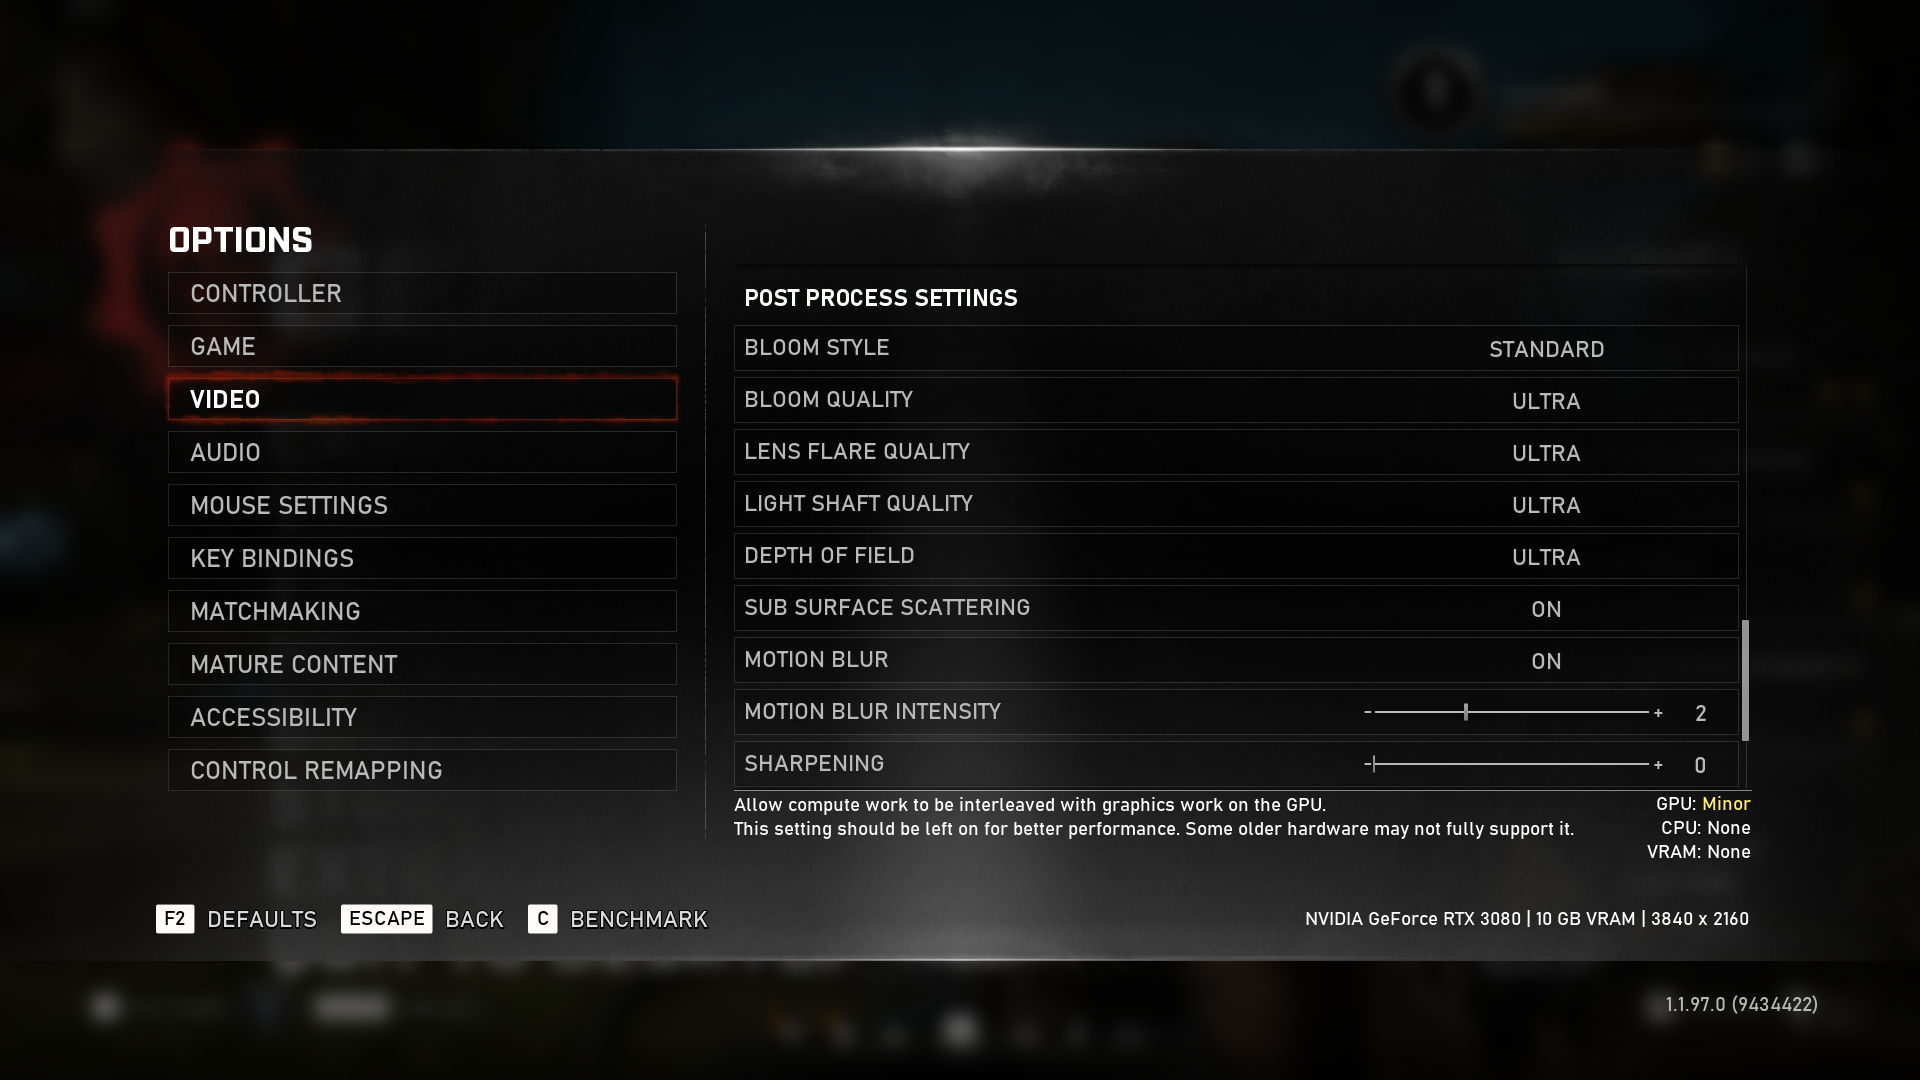
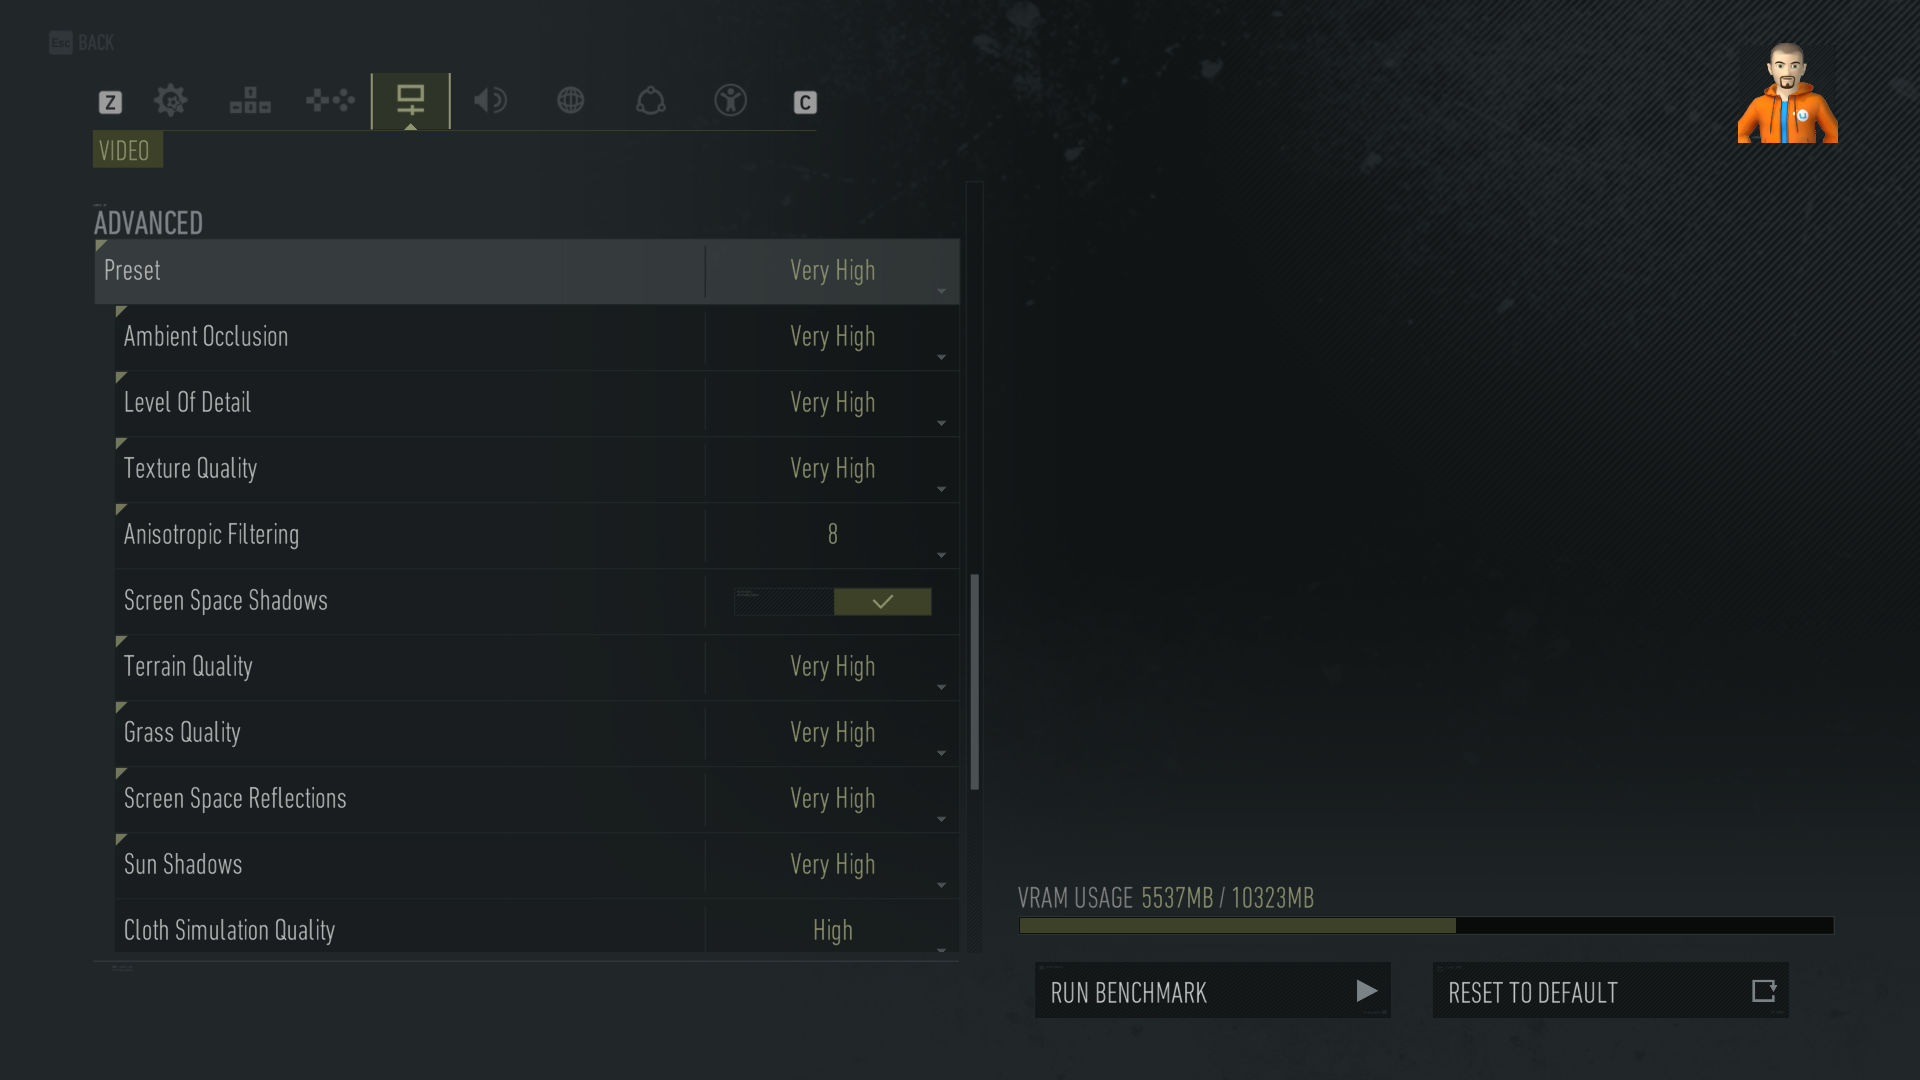
Engine: Unreal Engine 4. We test using the Ultra preset, with Best Animation Quality (instead of Auto), DX12 API.
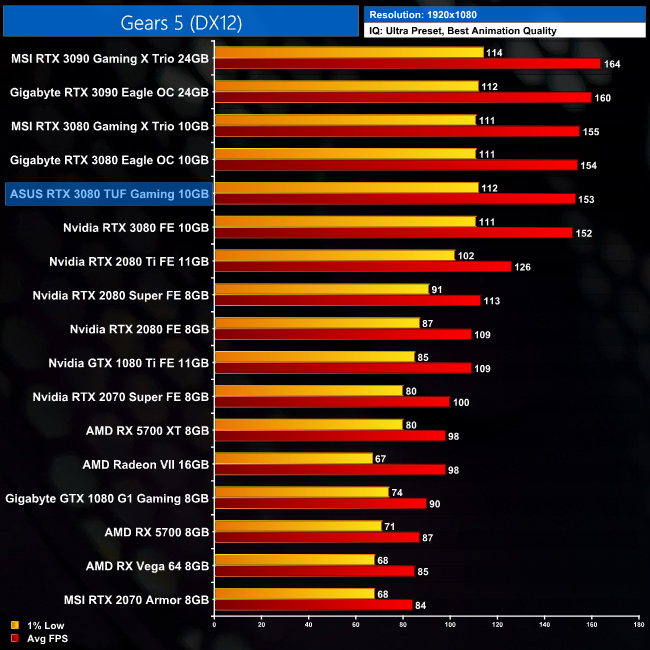
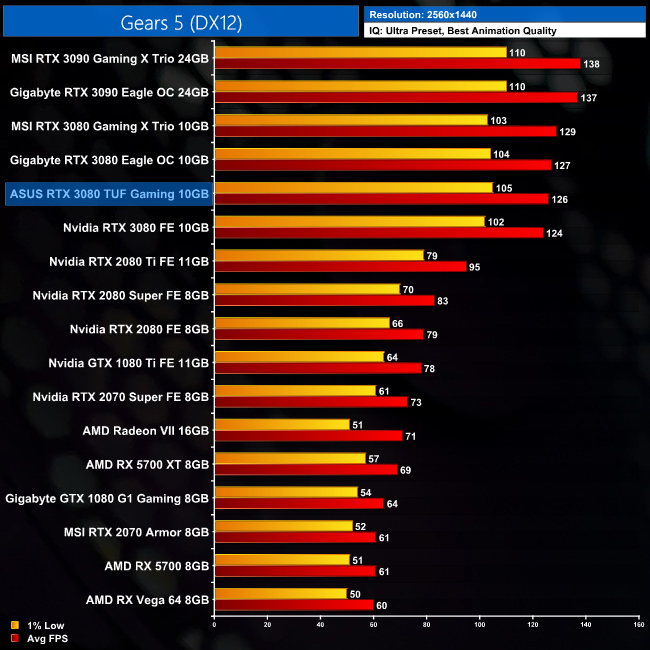
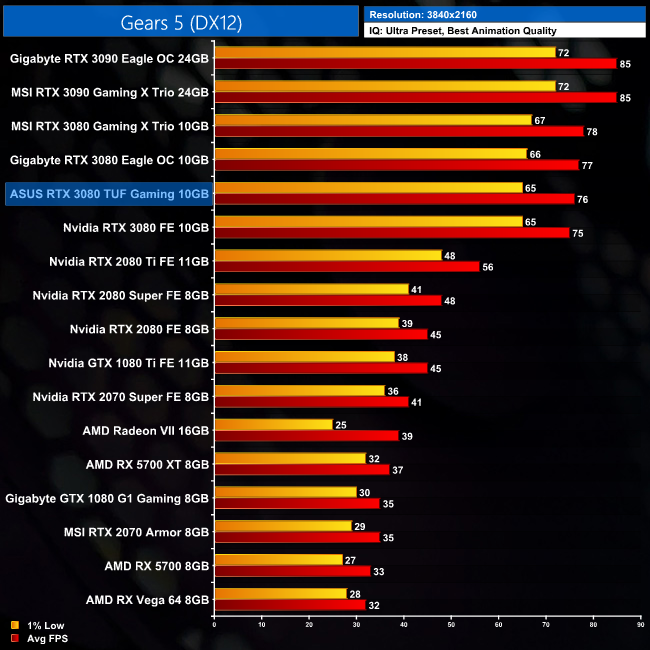
Gears 5 sees the ASUS TUF Gaming RTX 3080 just out-performing Nvidia's Founders Edition, with a difference of just 1FPS at 4K.
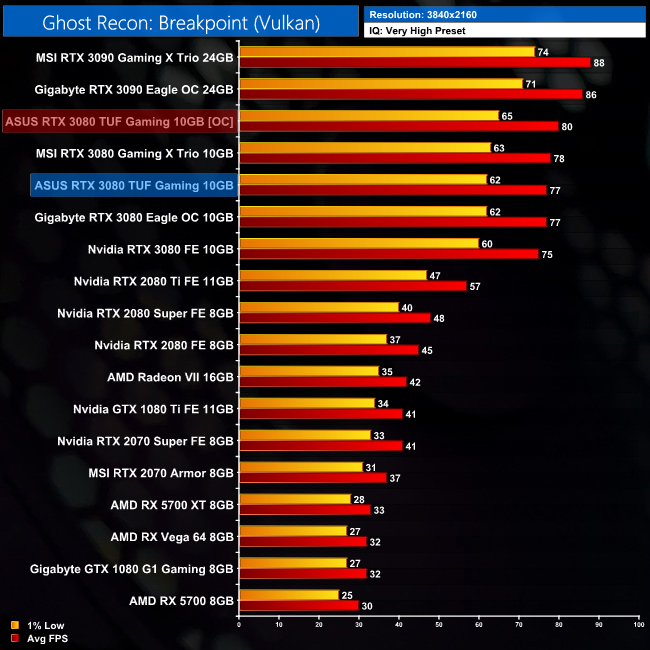
Tom Clancy's Ghost Recon Breakpoint is an online tactical shooter video game developed by Ubisoft Paris and published by Ubisoft. The game was released worldwide on 4 October 2019, for Microsoft Windows, PlayStation 4 and Xbox One, (Wikipedia).
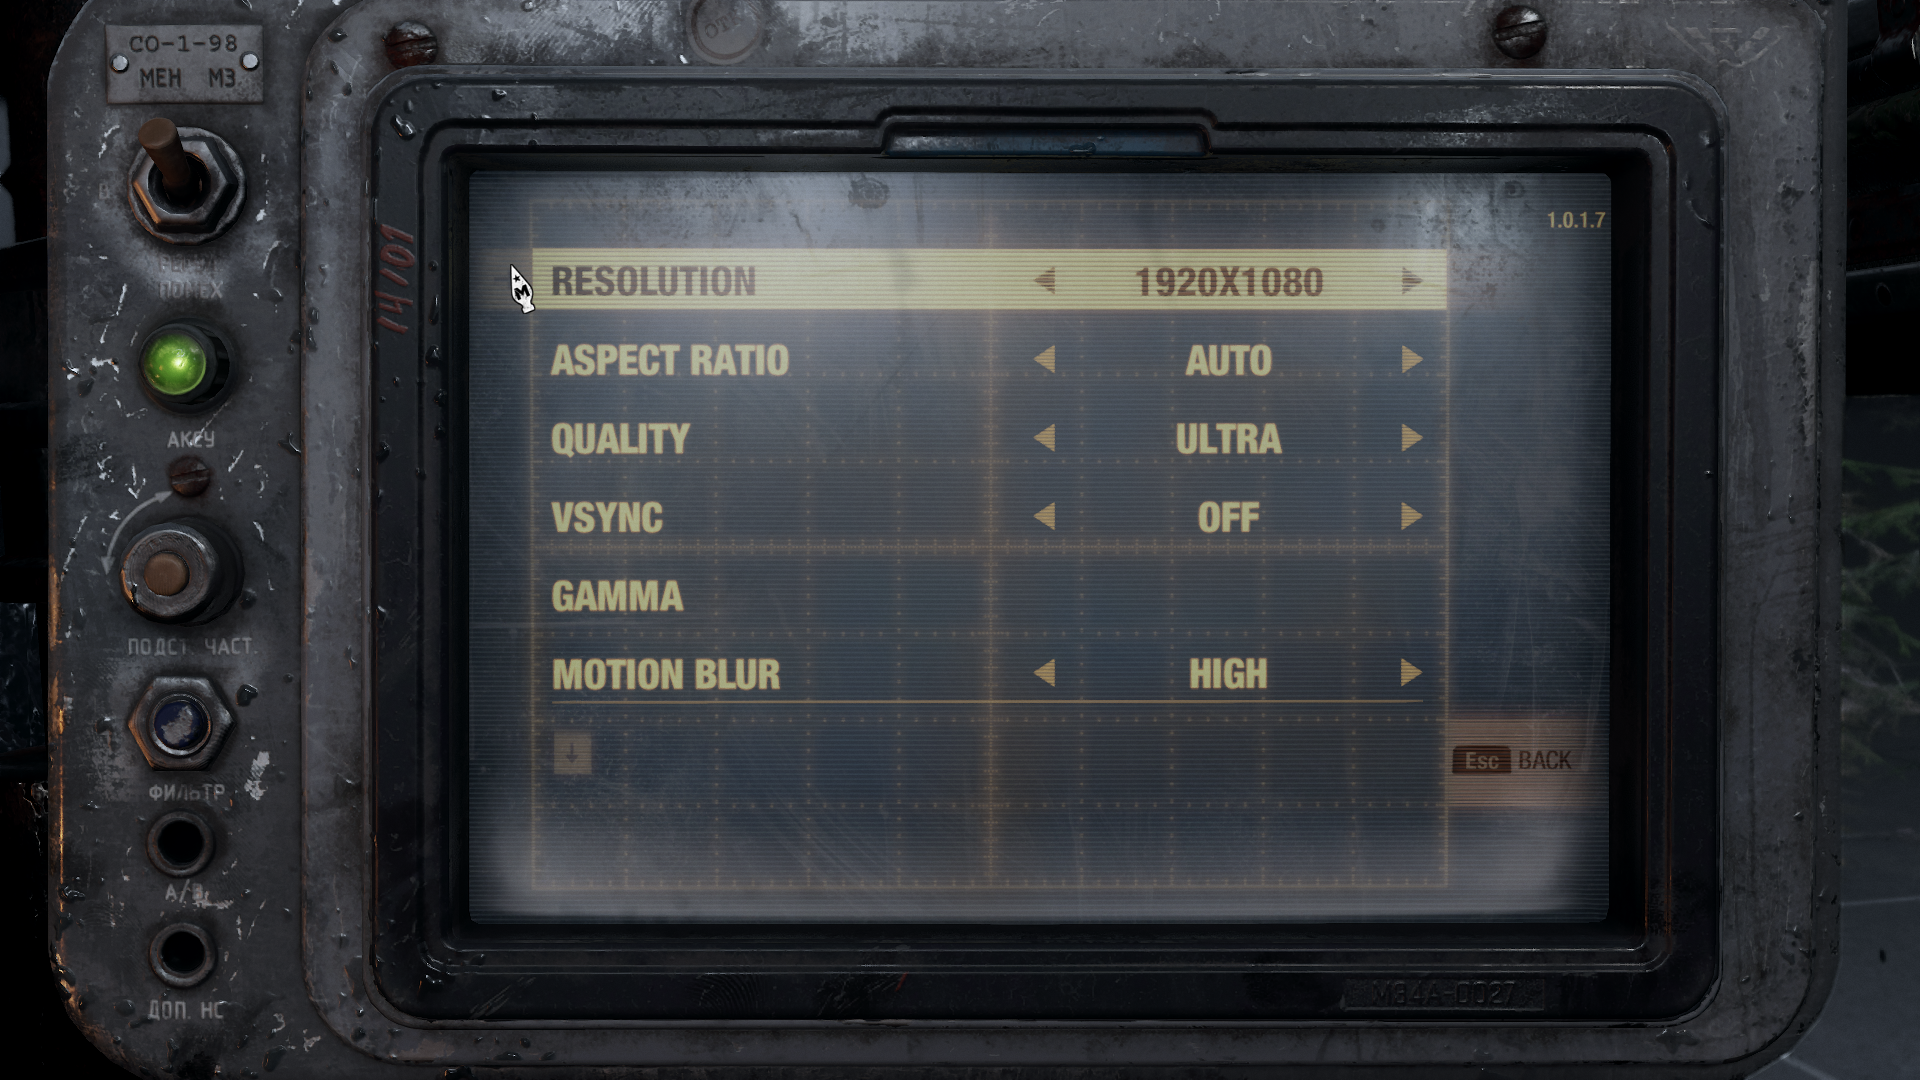
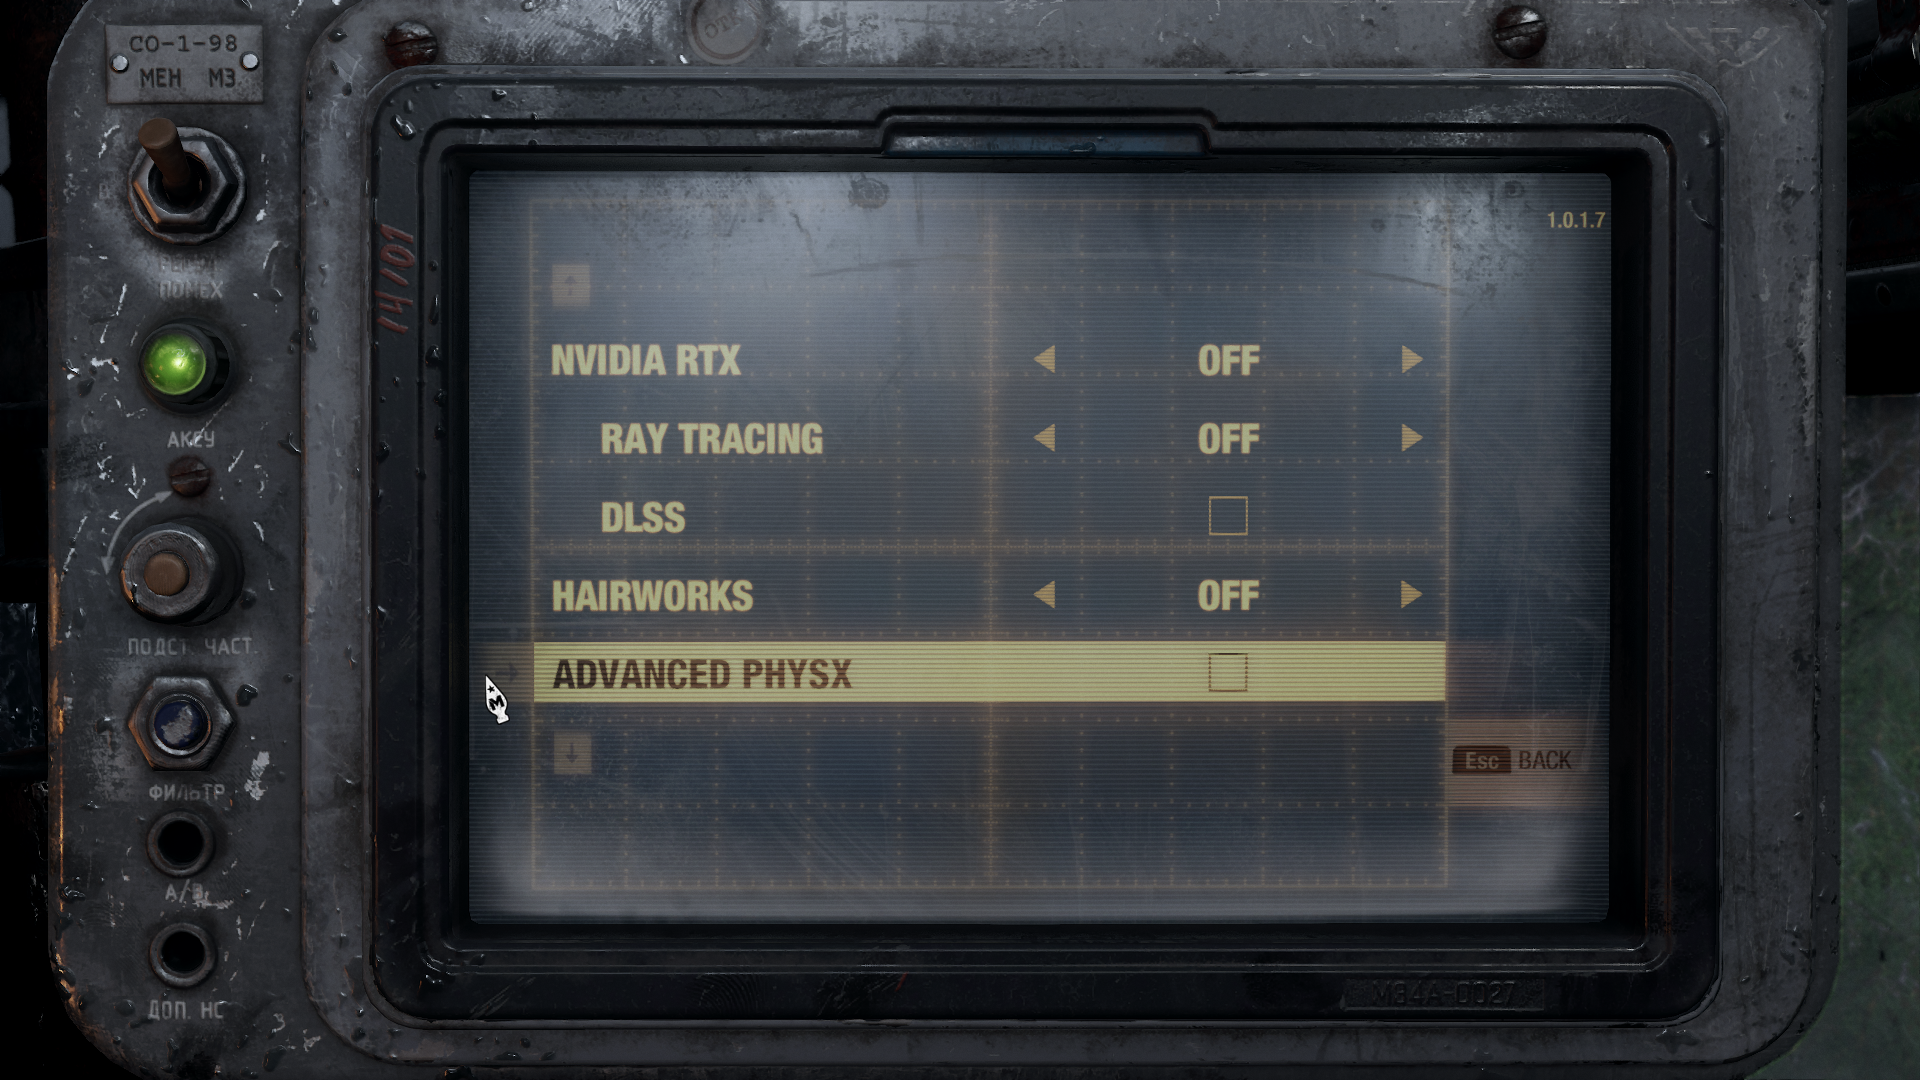
Engine: AnvilNext 2.0. We test using the Very High preset, with AA disabled, Vulkan API.
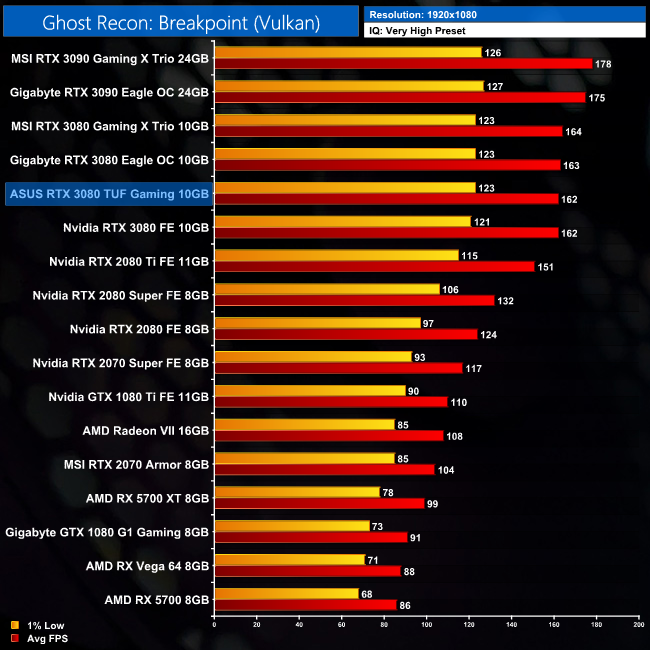
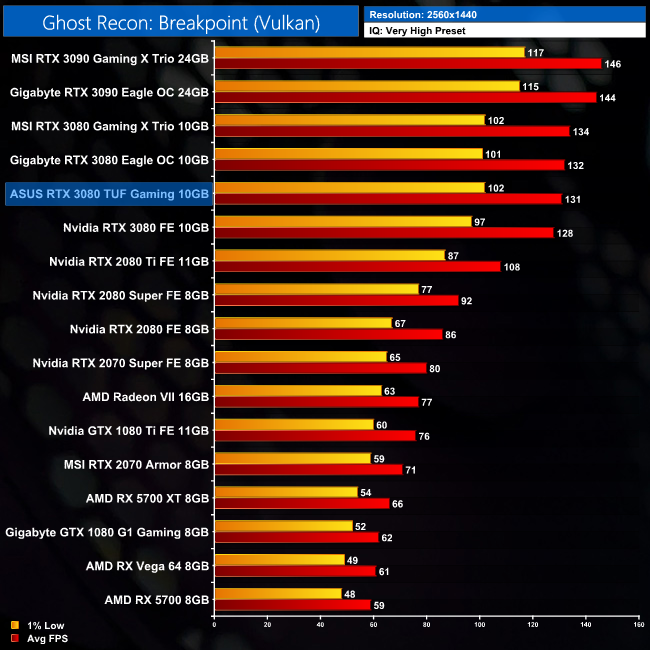
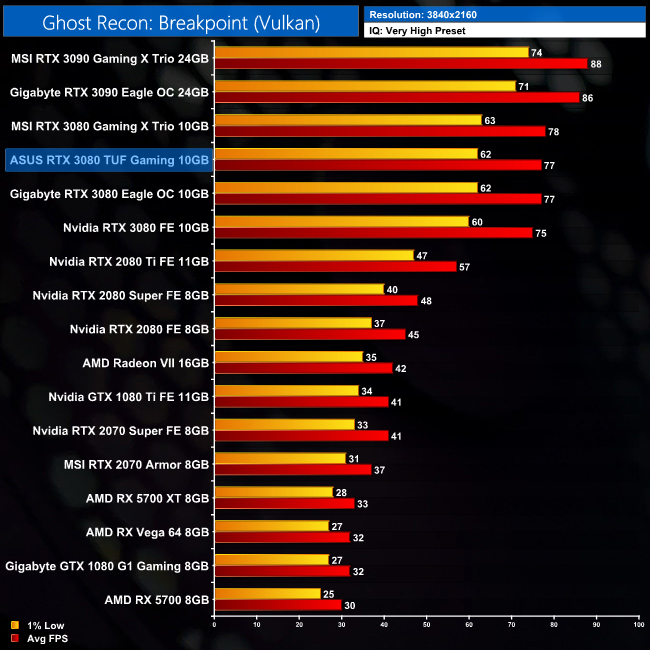
Ghost Recon: Breakpoint sees the TUF do a little better, relatively speaking, as it averages 77FPS at 4K. This is the same result as the Gigabyte RTX 3080 Eagle OC, putting both cards 3% ahead of the Founders Edition.
Metro Exodus is a first-person shooter video game developed by 4A Games and published by Deep Silver in 2019. It is the third instalment in the Metro video game series based on Dmitry Glukhovsky's novels, following the events of Metro 2033 and Metro: Last Light. (Wikipedia).
Engine: 4A Engine. We test using the Ultra preset, but with Hairworks and Advanced PhysX turned off, DX12 API.
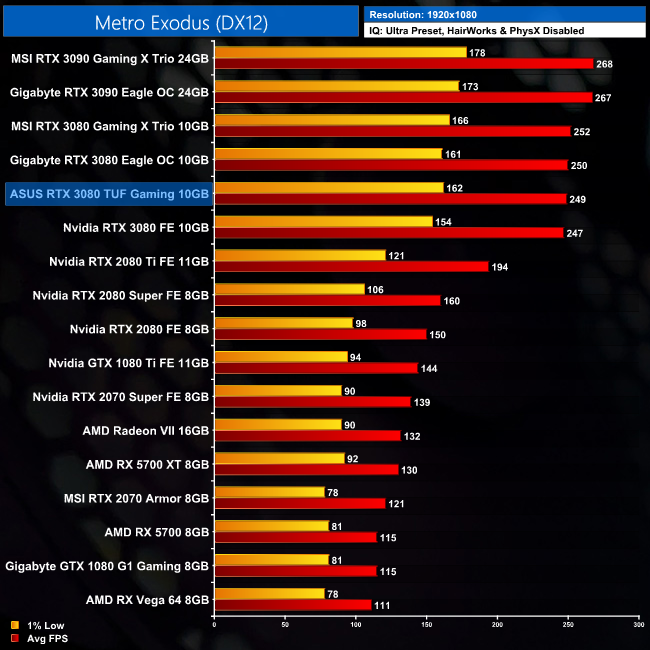

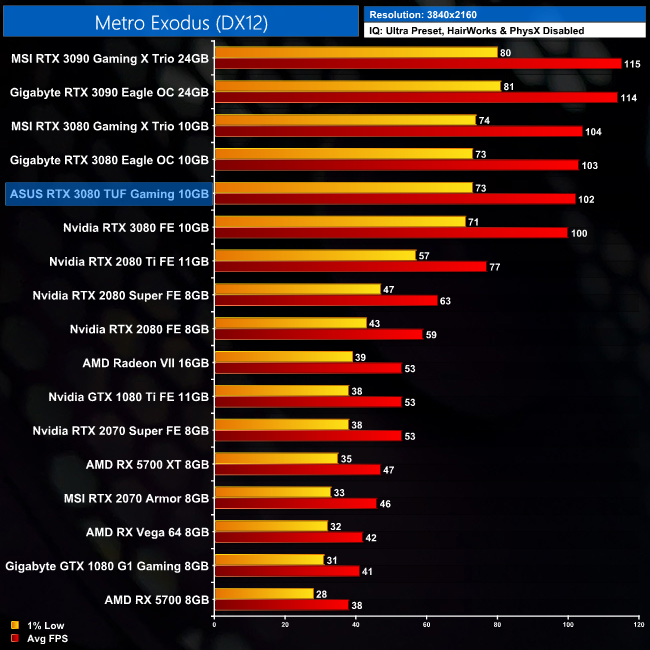
In Metro Exodus, all of the RTX 3080 card we have tested are able to average at least 100FPS at 4K, which isn't bad going at all. The TUF Gaming averages 102FPS, making it 2% faster than the Founders Edition, and 32% faster than the RTX 2080 Ti.
Middle-earth: Shadow of War is an action role-playing video game developed by Monolith Productions and published by Warner Bros. Interactive Entertainment. It is the sequel to 2014’s Middle-earth: Shadow of Mordor, and was released worldwide for Microsoft Windows, PlayStation 4, and Xbox One on October 10, 2017. (Wikipedia).
Engine: LithTech Firebird. We test using the Very High preset, DX11 API.
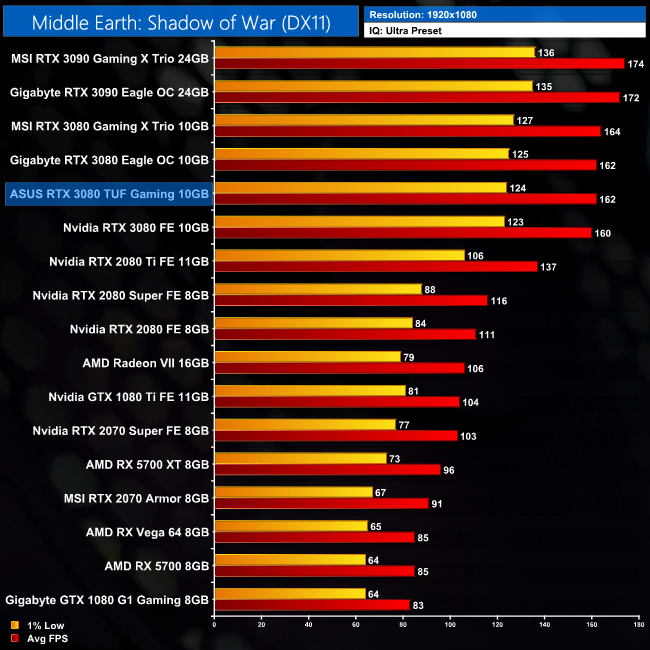
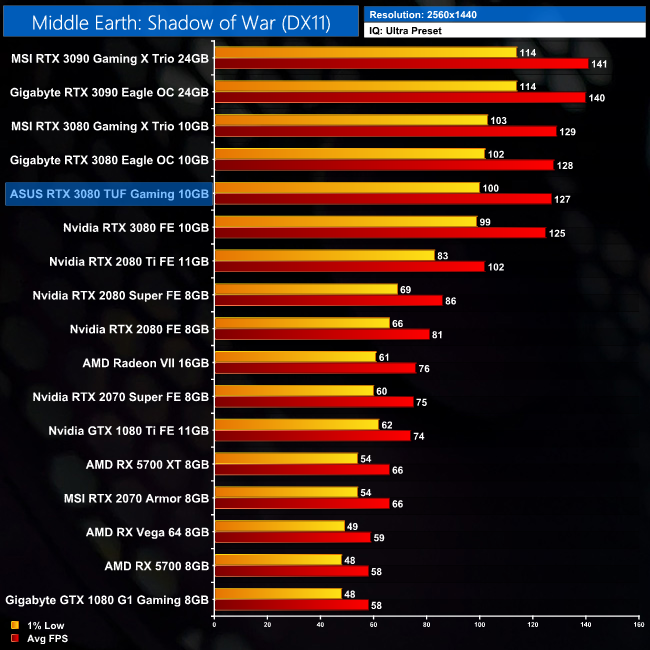
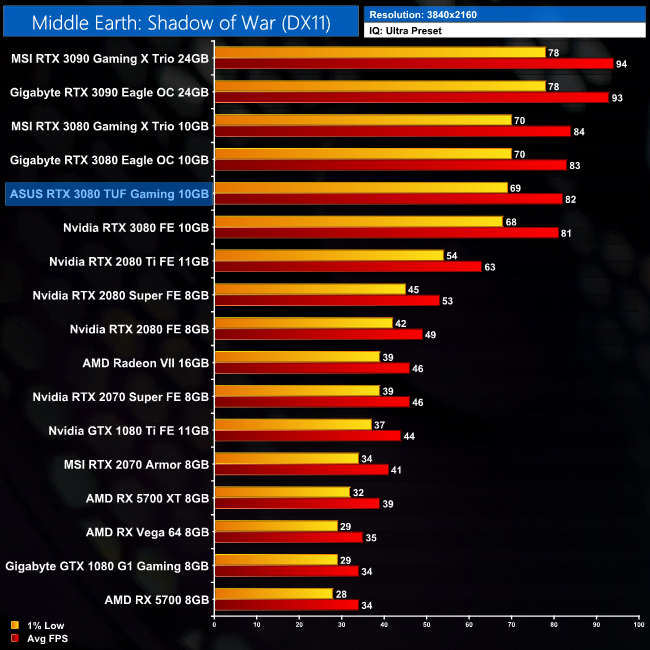
We're back to single-frame differences between the TUF Gaming and RTX 3080 Founders Edition when testing Shadow of War, at 4K.
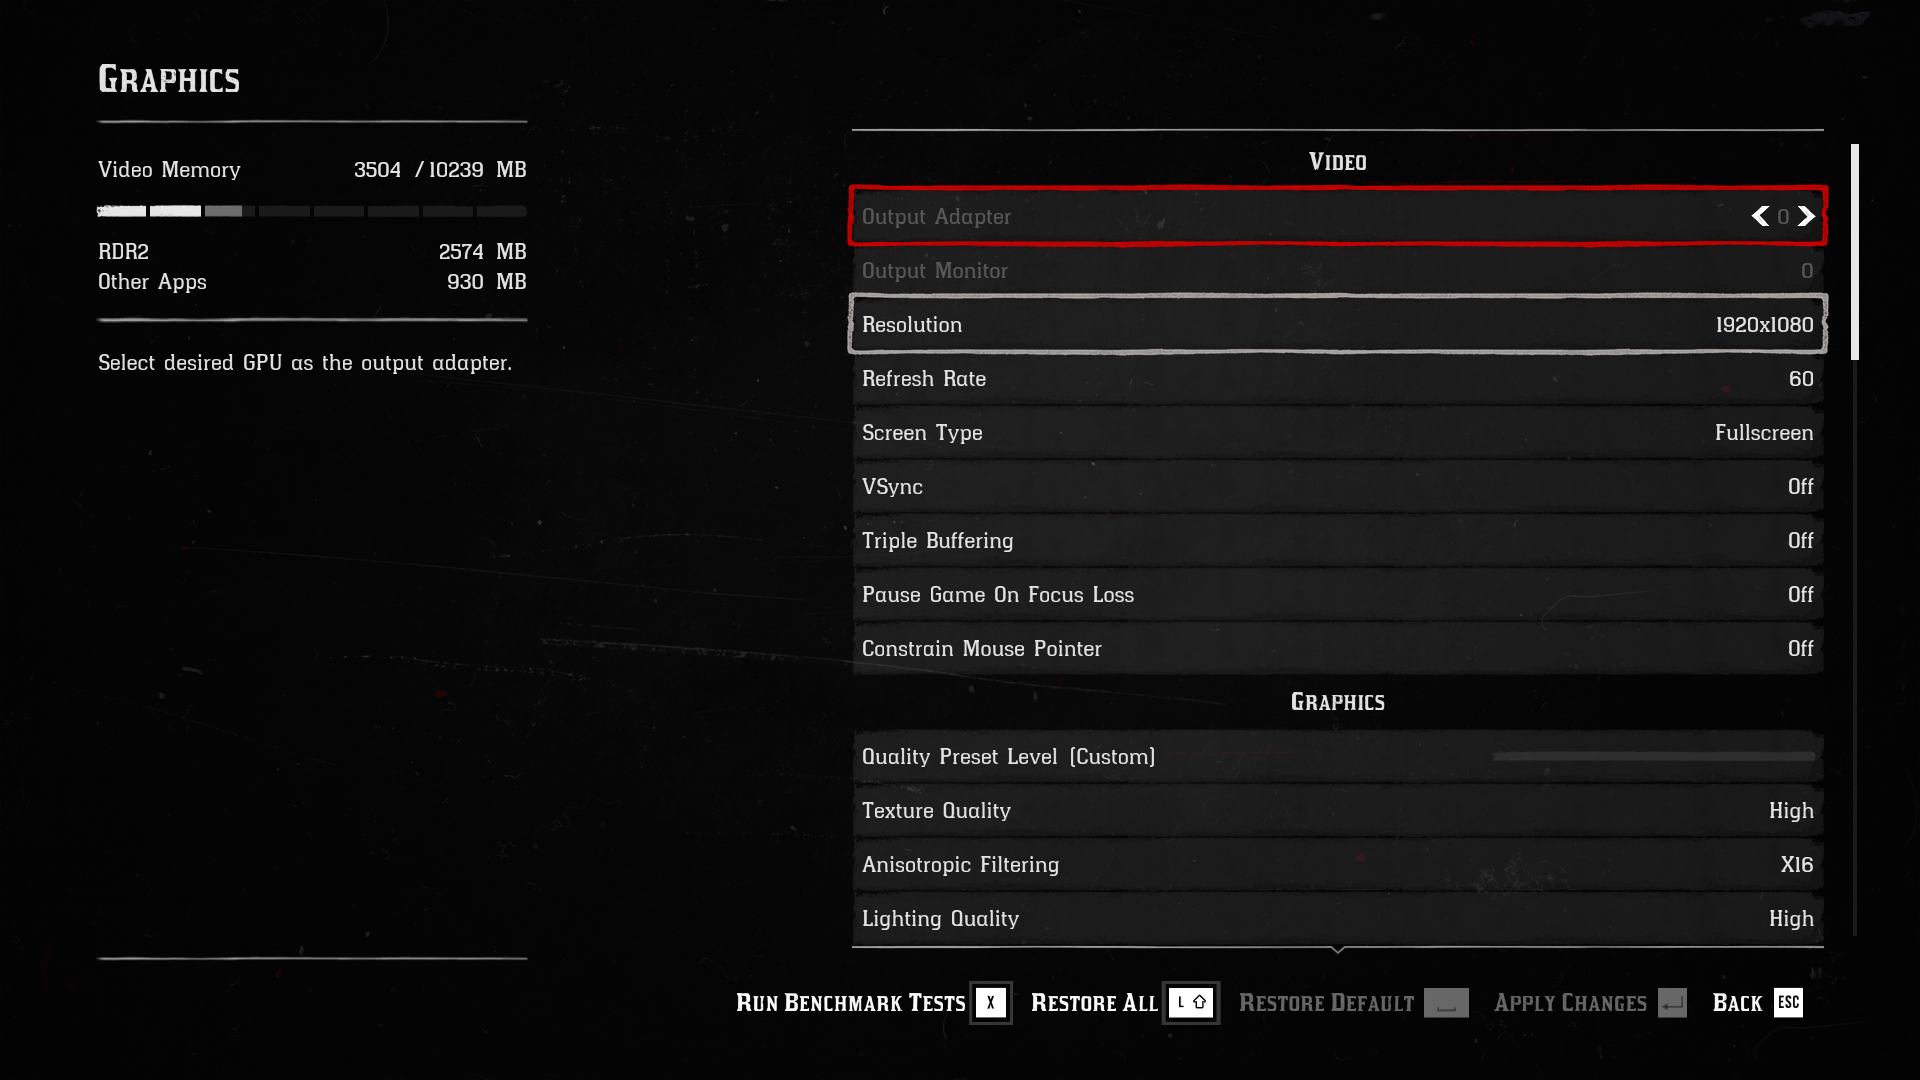
Red Dead Redemption 2 is a 2018 action-adventure game developed and published by Rockstar Games. The game is the third entry in the Red Dead series and is a prequel to the 2010 game Red Dead Redemption. Red Dead Redemption 2 was released for the PlayStation 4 and Xbox One in October 2018, and for Microsoft Windows and Stadia in November 2019. (Wikipedia).
Engine: Rockstar Advance Game Engine (RAGE). We test by manually selecting High settings, not using a preset, including TAA, Vulkan API.
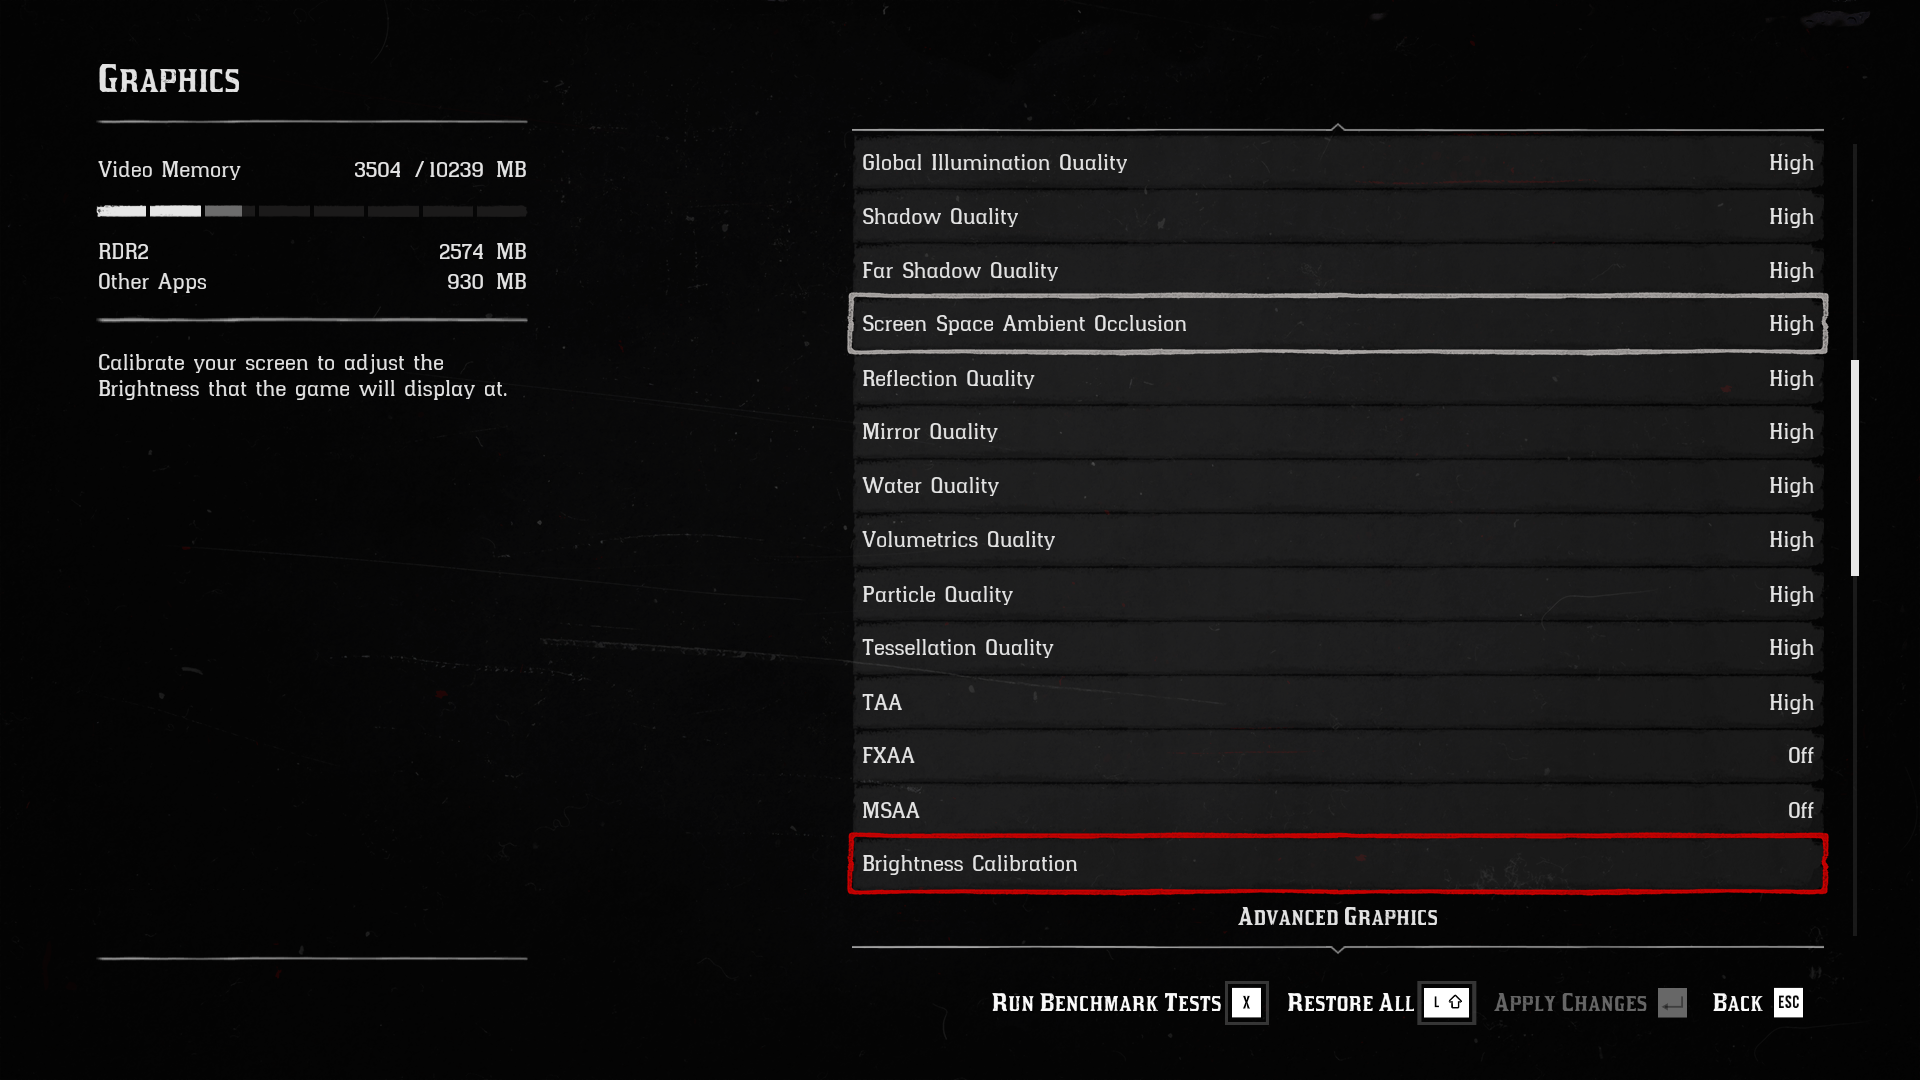
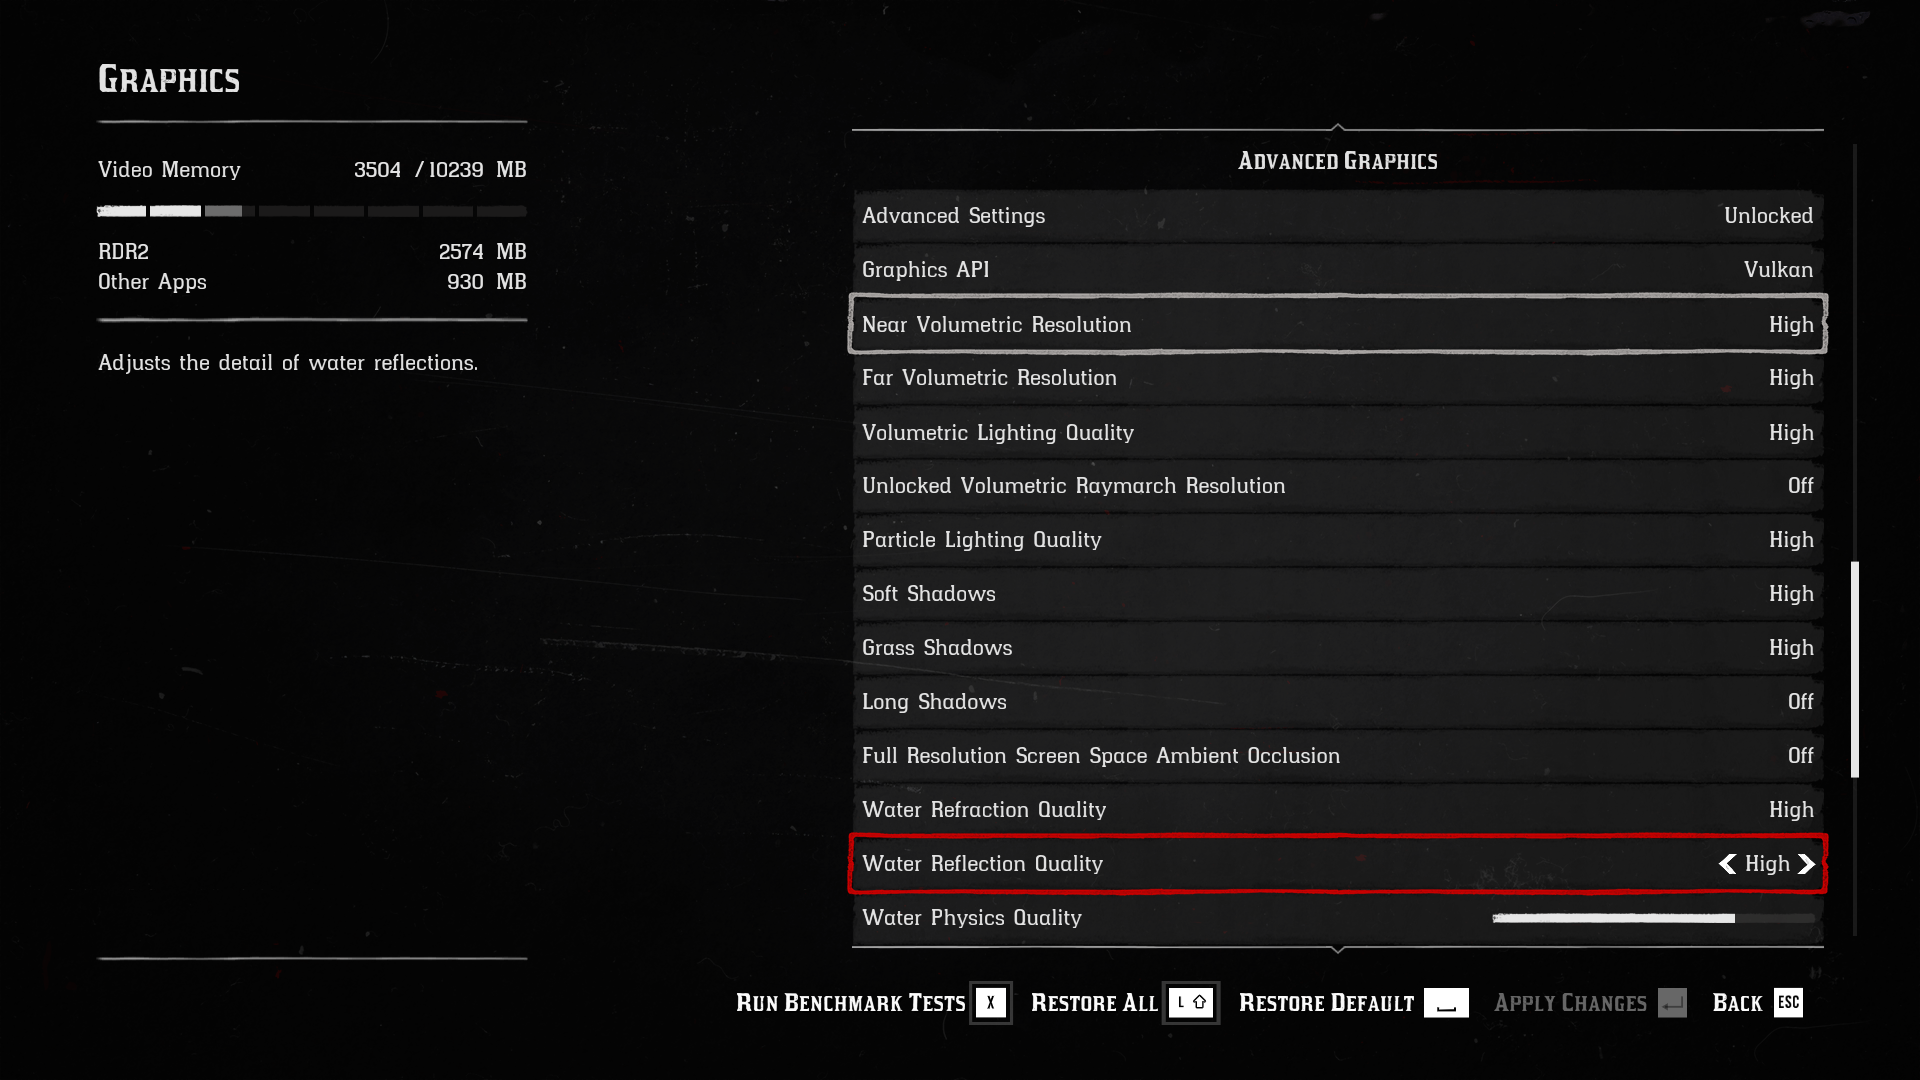
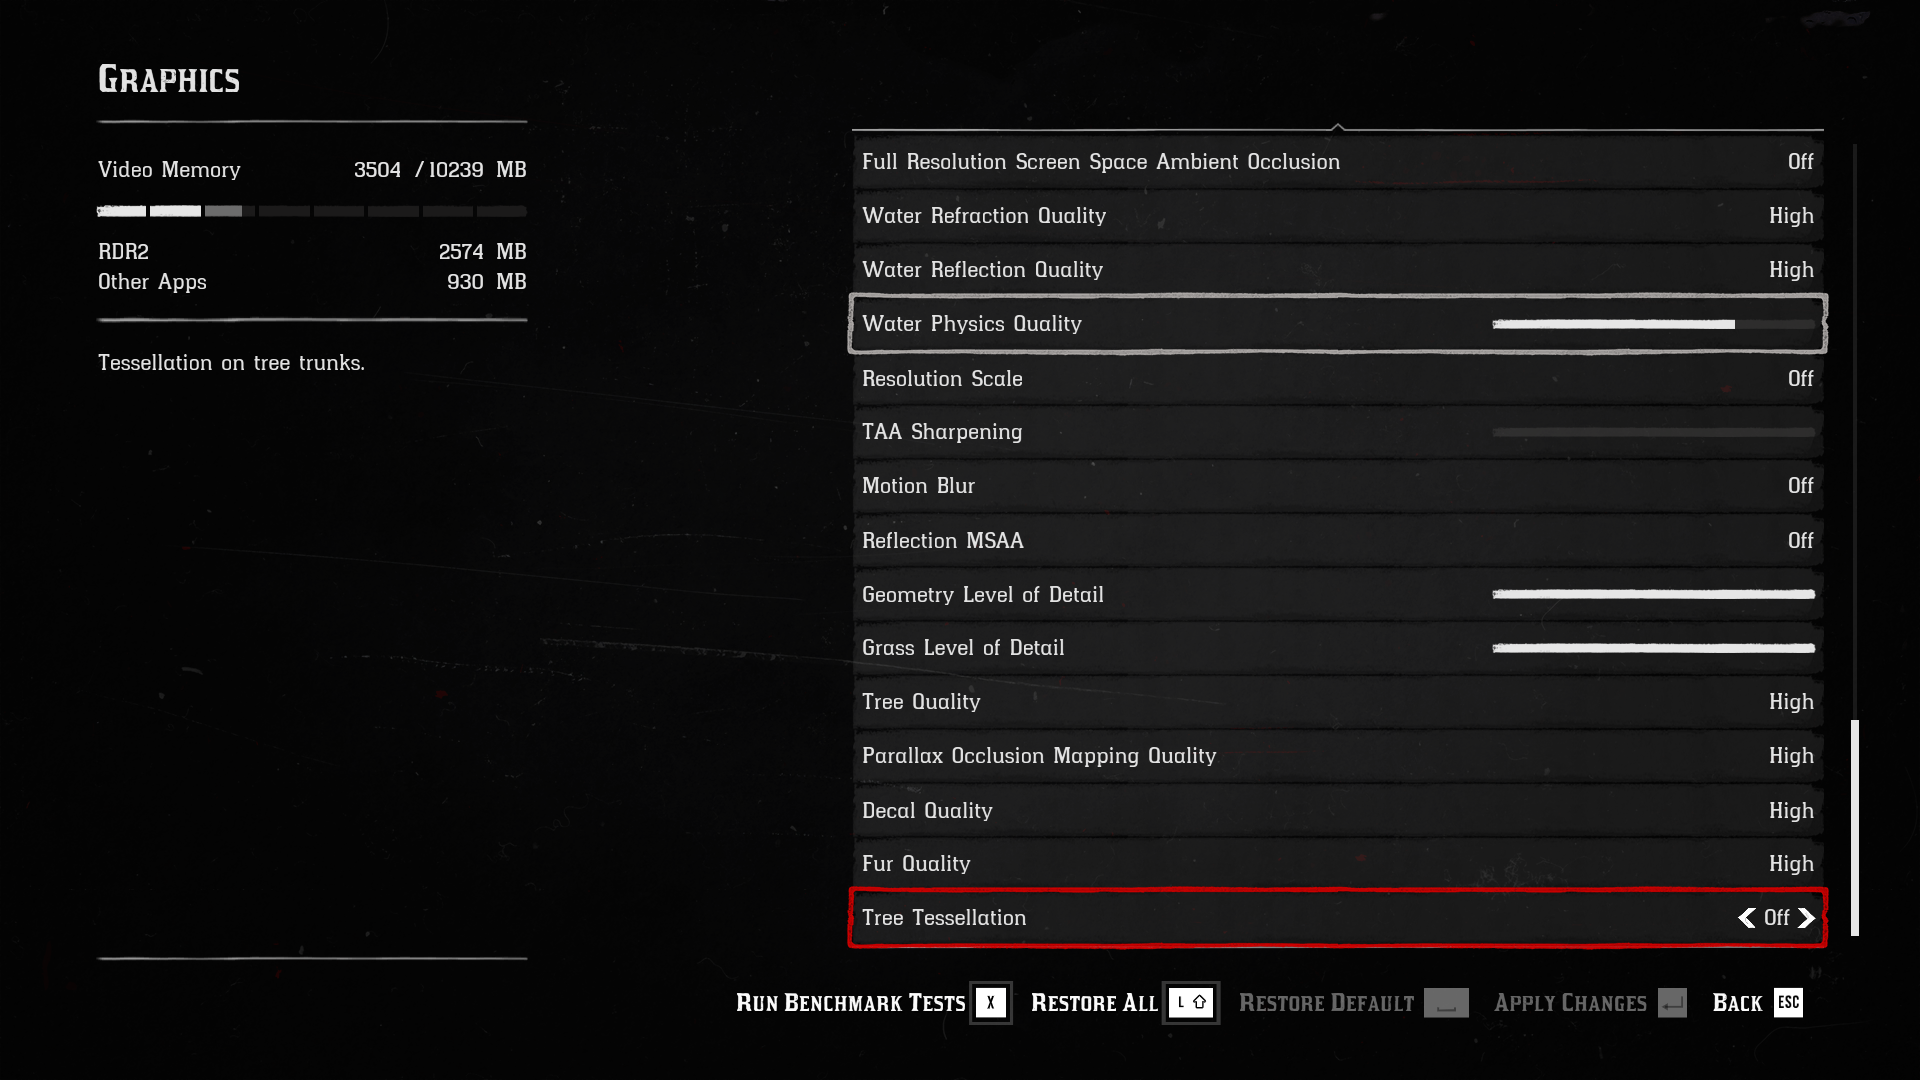
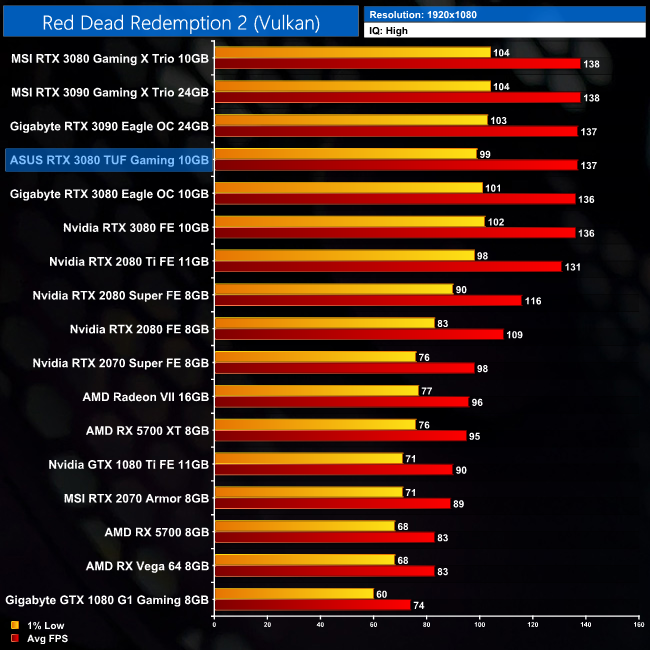
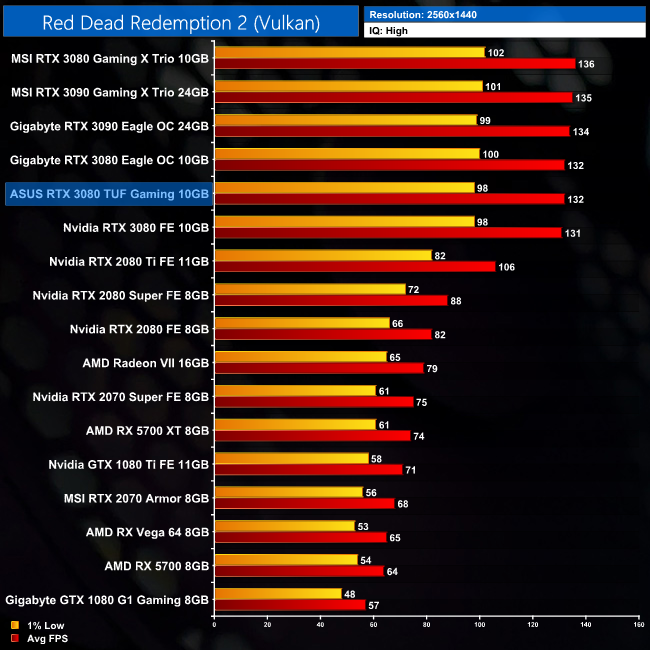
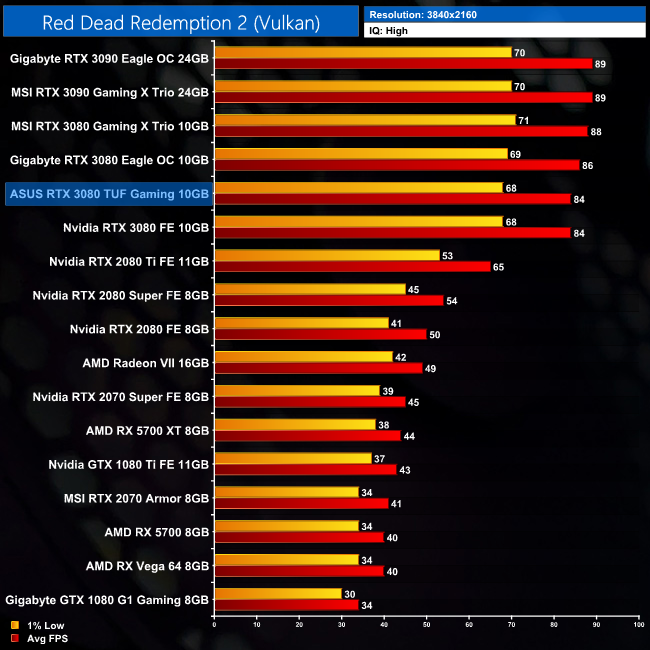
Things tighten up further in Red Dead Redemption 2. Once more, we are seeing no difference in average frame rate between the RTX 3080 Founders Edition and the TUF Gaming model at 4K.
Shadow of the Tomb Raider is an action-adventure video game developed by Eidos Montréal in conjunction with Crystal Dynamics and published by Square Enix. It continues the narrative from the 2013 game Tomb Raider and its sequel Rise of the Tomb Raider, and is the twelfth mainline entry in the Tomb Raider series. The game released worldwide on 14 September 2018 for Microsoft Windows, PlayStation 4 and Xbox One. (Wikipedia).
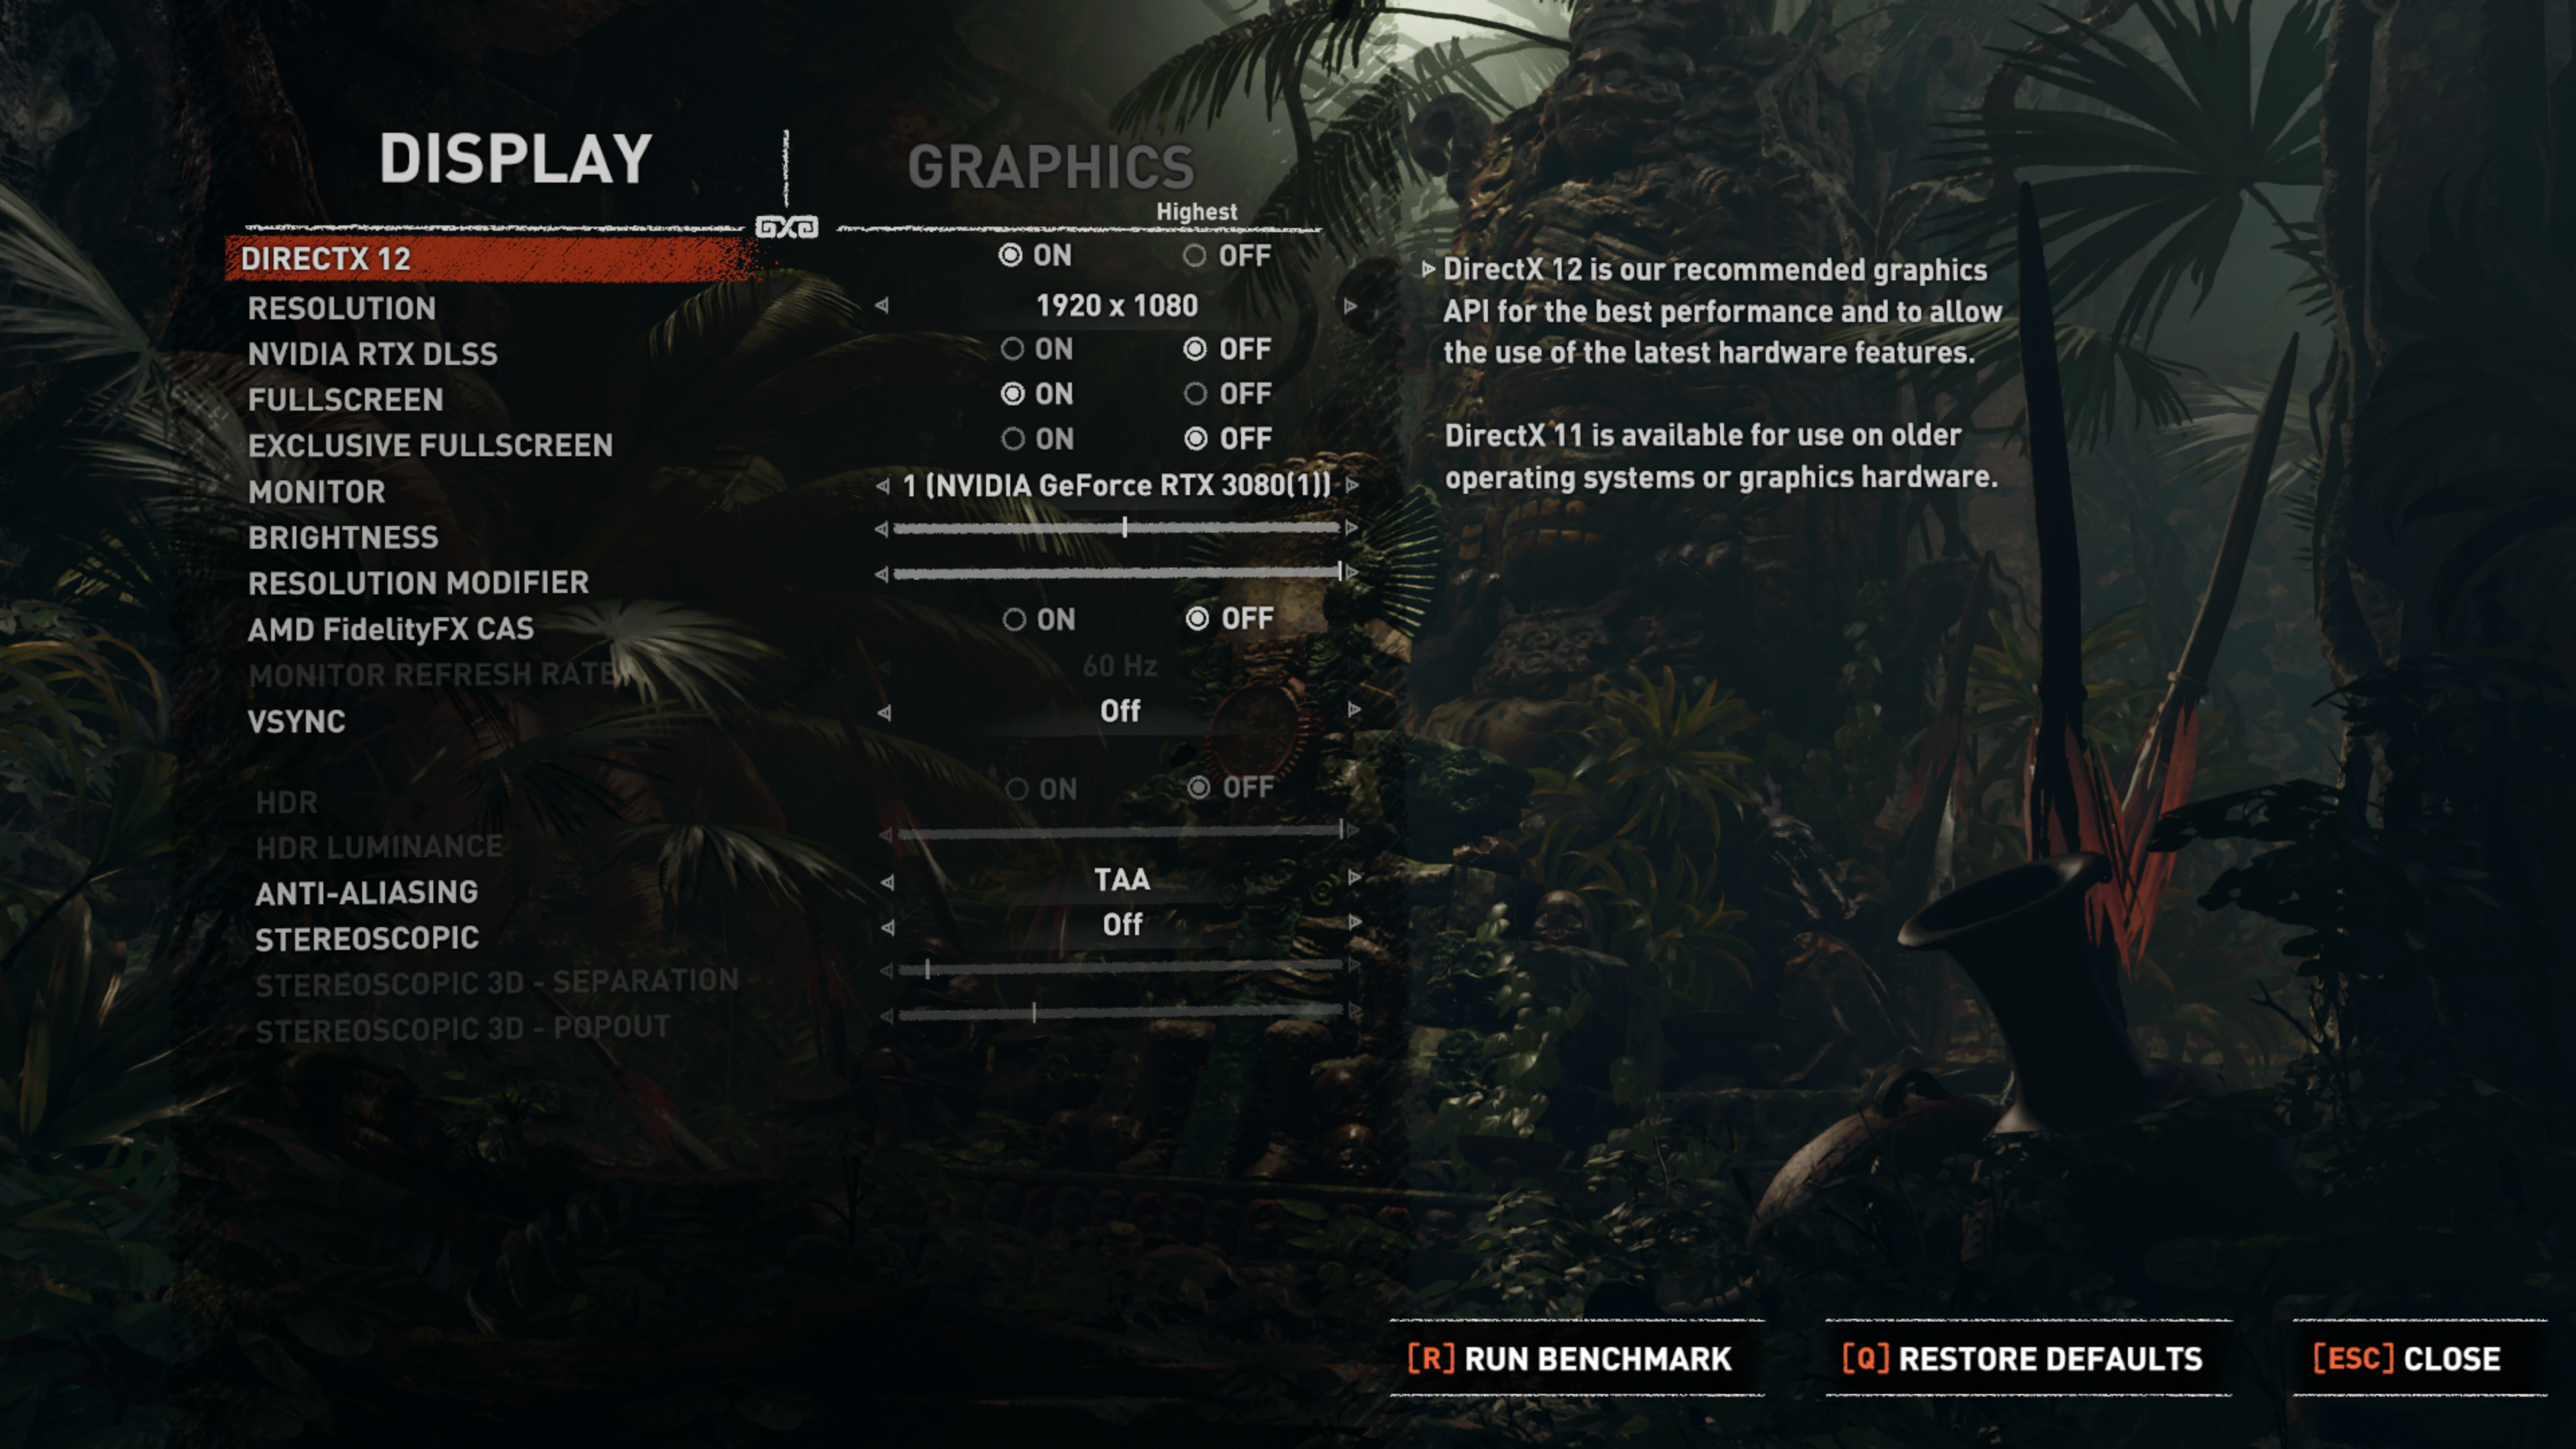
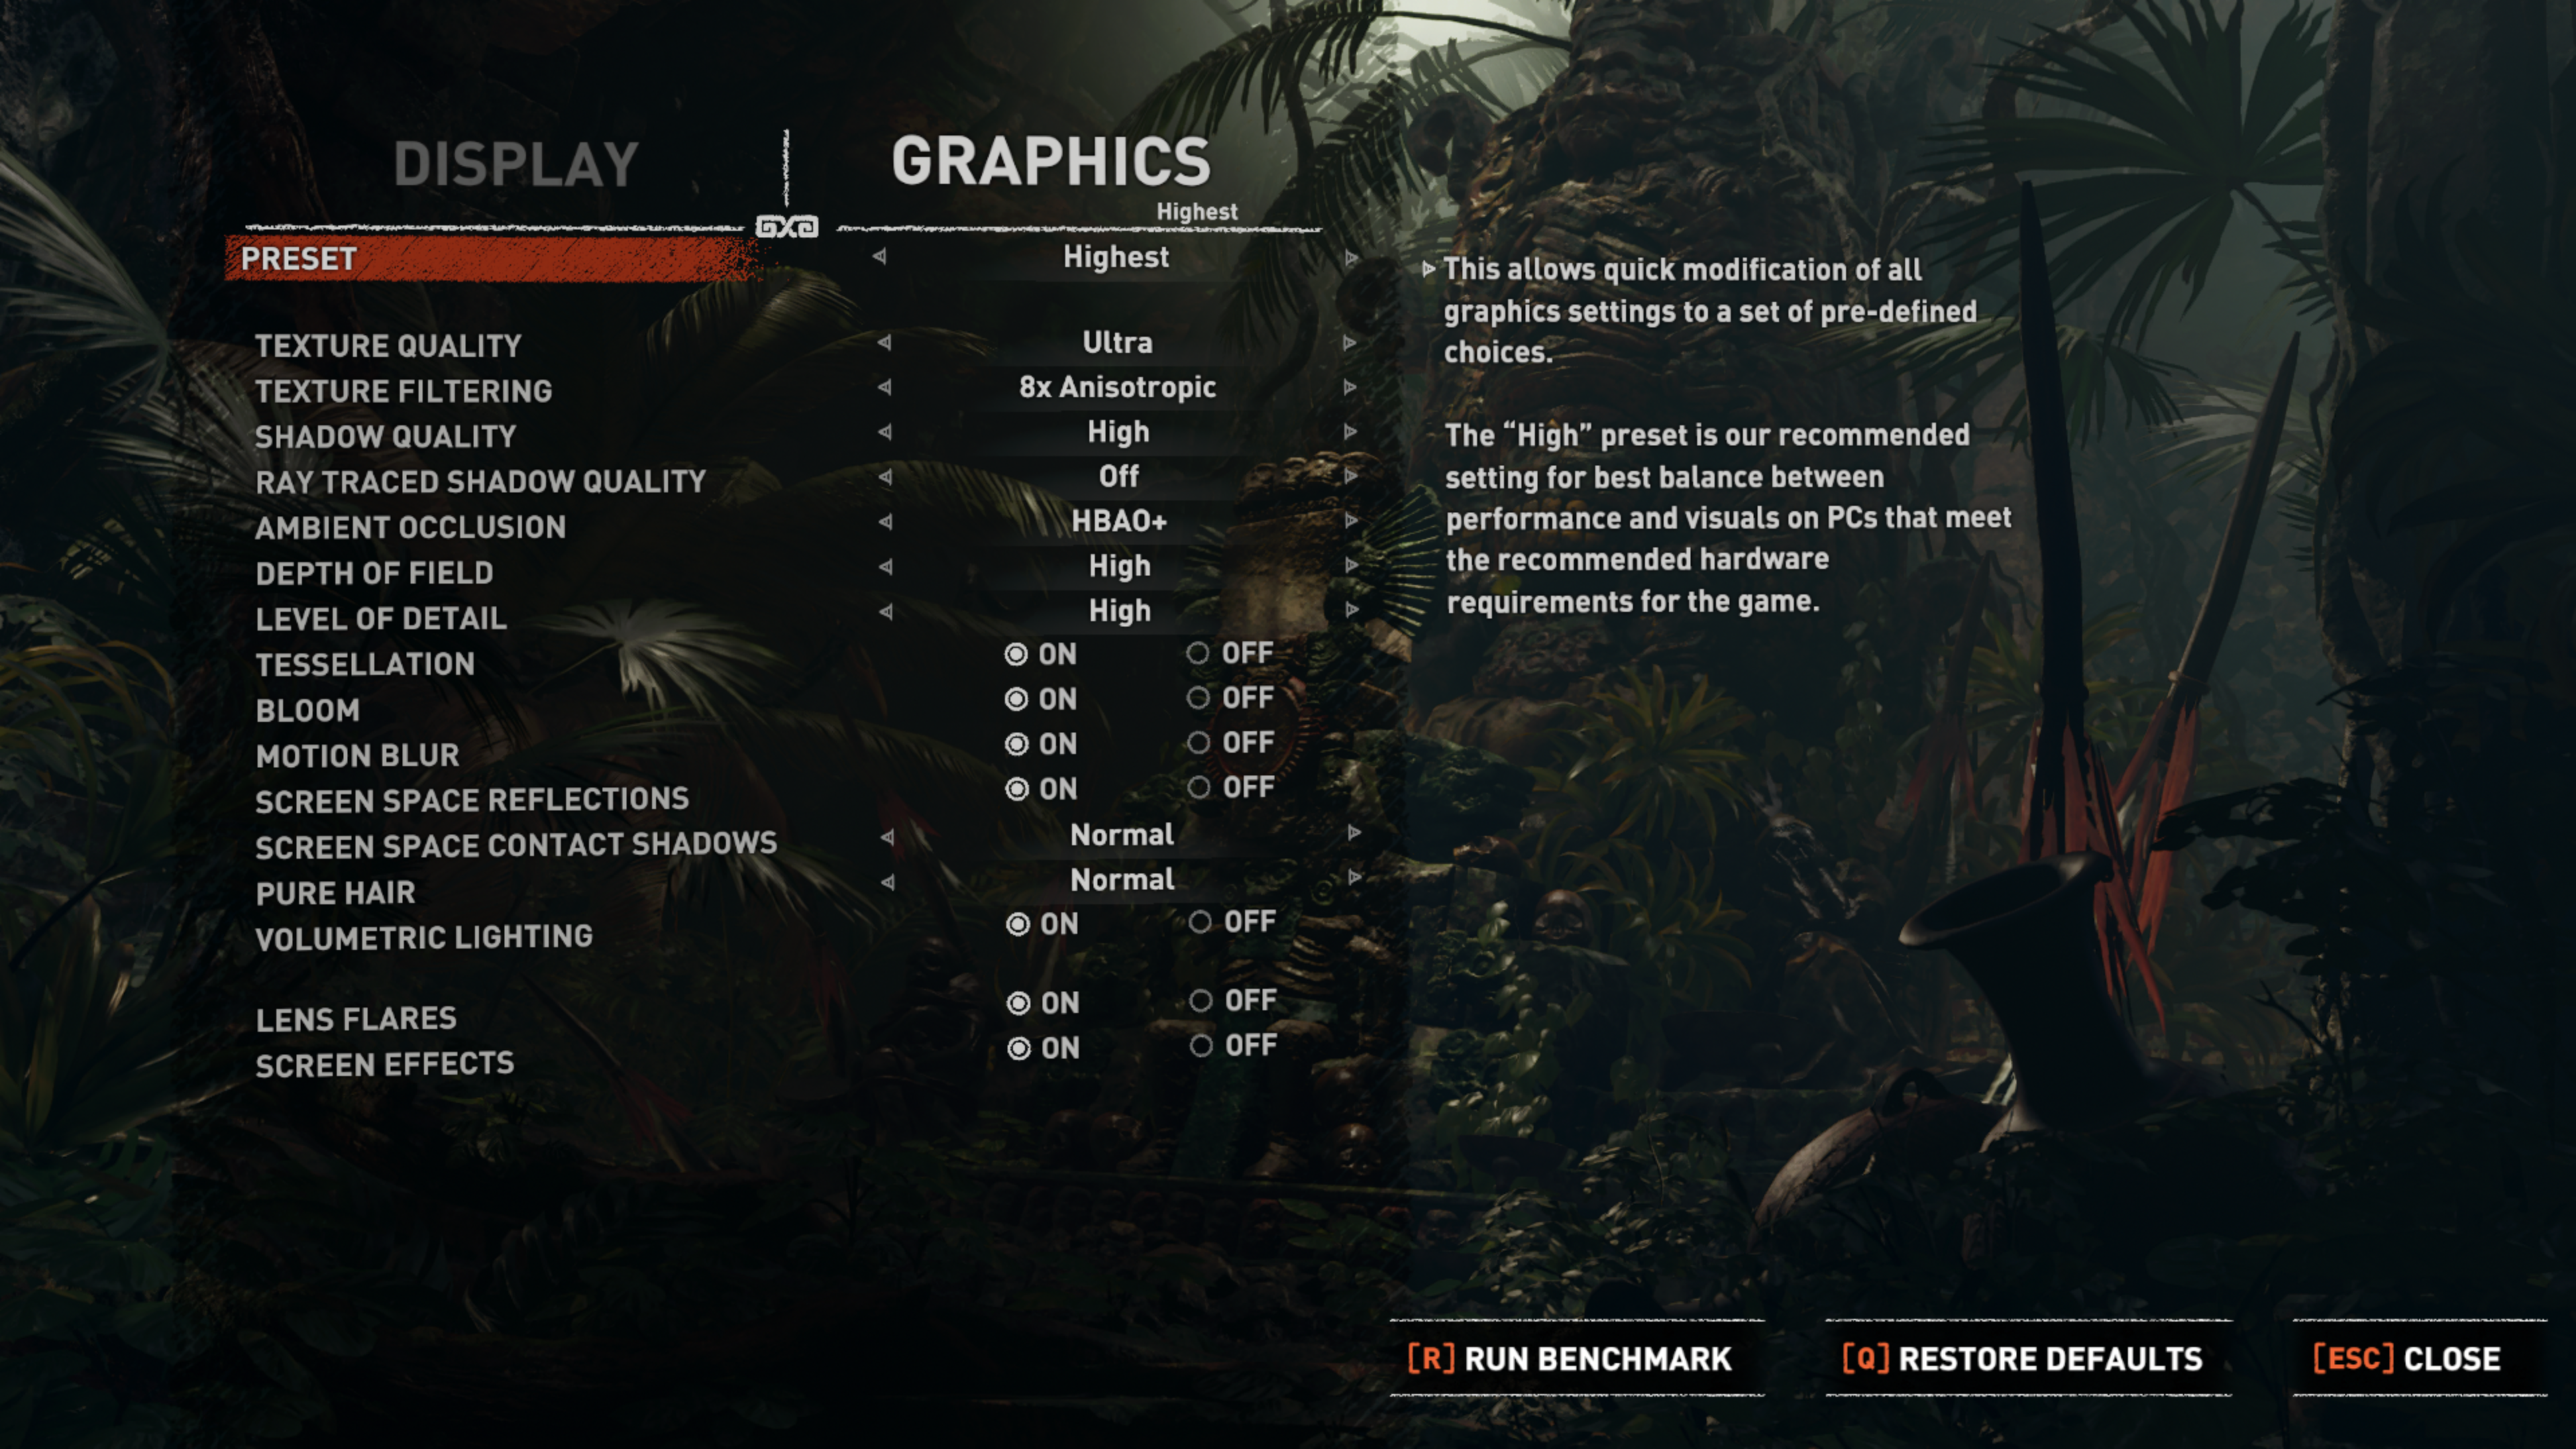
Engine: Foundation Engine. We test using the Highest preset, with TAA, DX12 API.
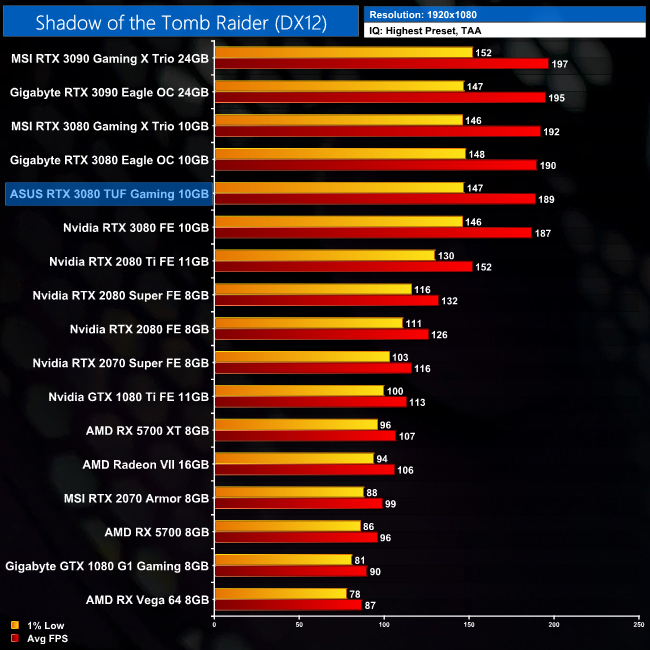
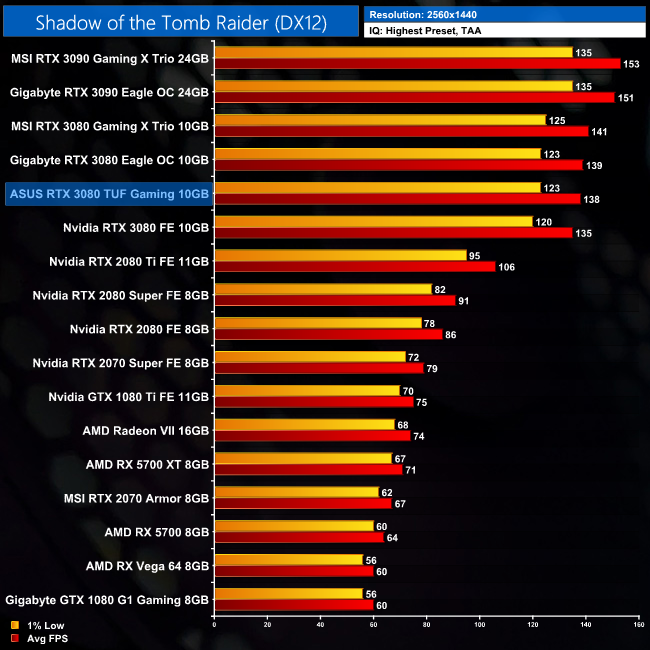
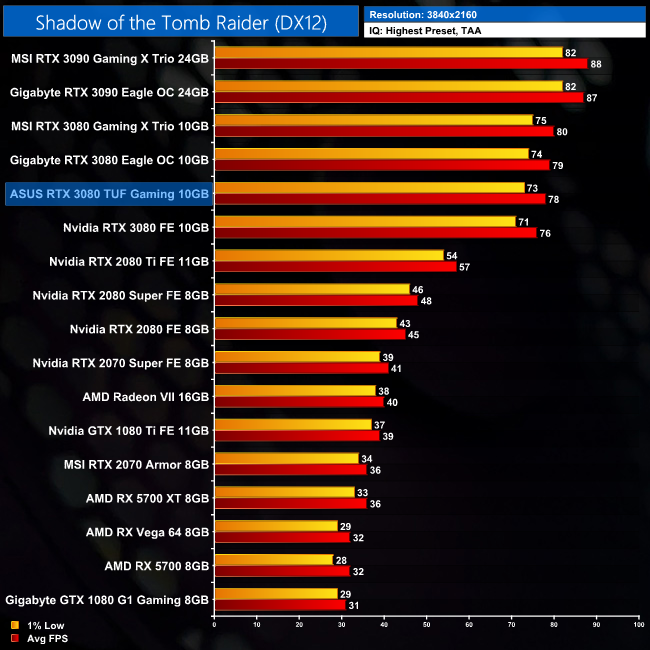
As for Shadow of the Tomb Raider, at 4K we see a 3% lead for the TUF Gaming compared to the 3080 Founders Edition, a difference of just 2FPS. The TUF is 37% faster than RTX 2080 Ti at this resolution.
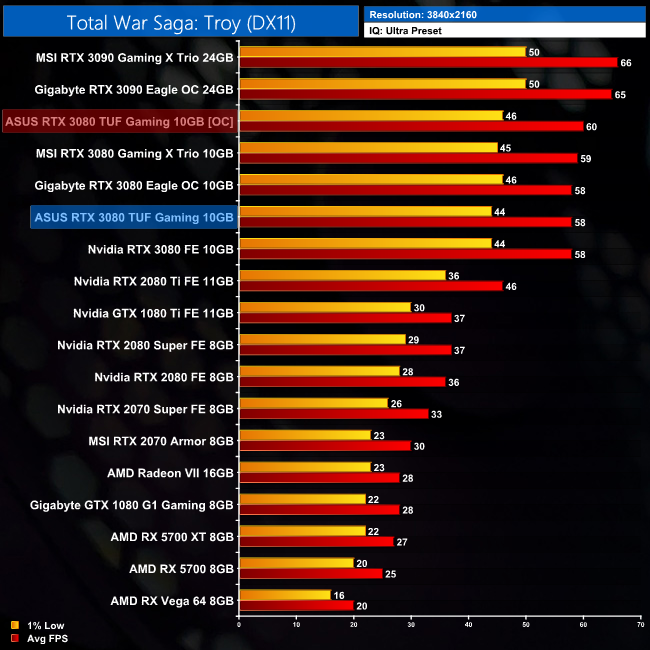
Total War Saga: Troy is a 2020 turn-based strategy video game developed by Creative Assembly Sofia and published by Sega. The game was released for Windows on 13 August 2020 as the second installment in the Total War Saga subseries, succeeding Thrones of Britannia (2018). (Wikipedia).
Engine: TW 3 Engine. We test using the Ultra preset, DX11 API.
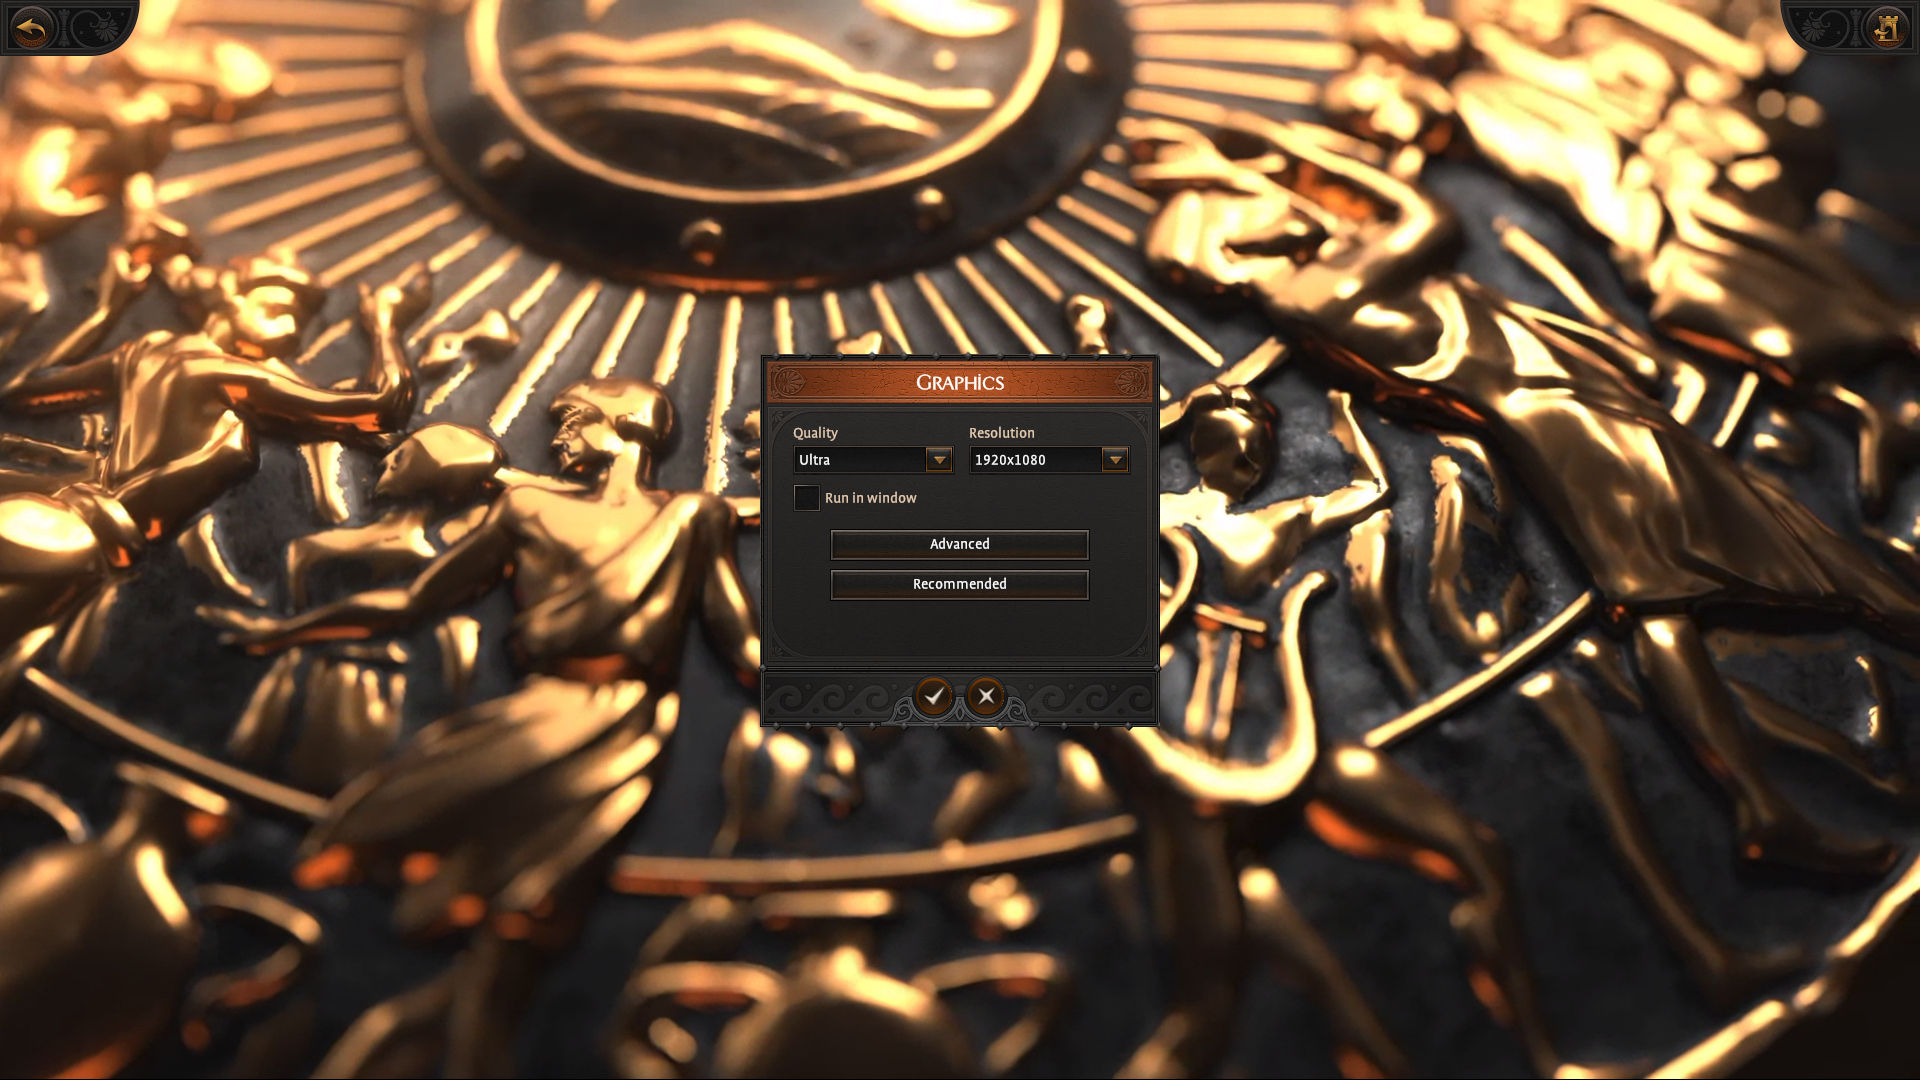
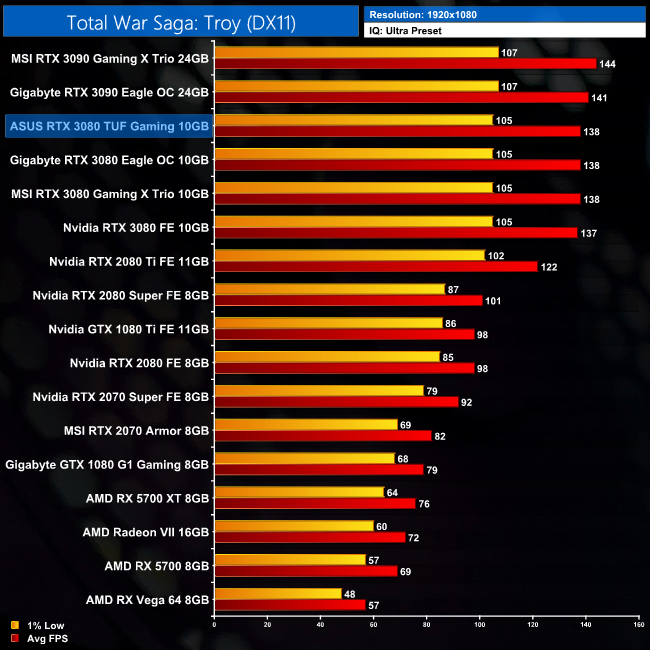
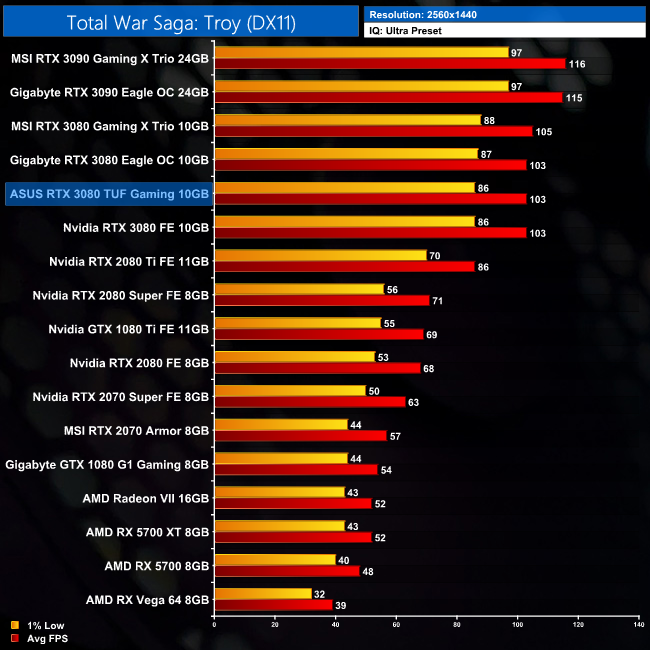
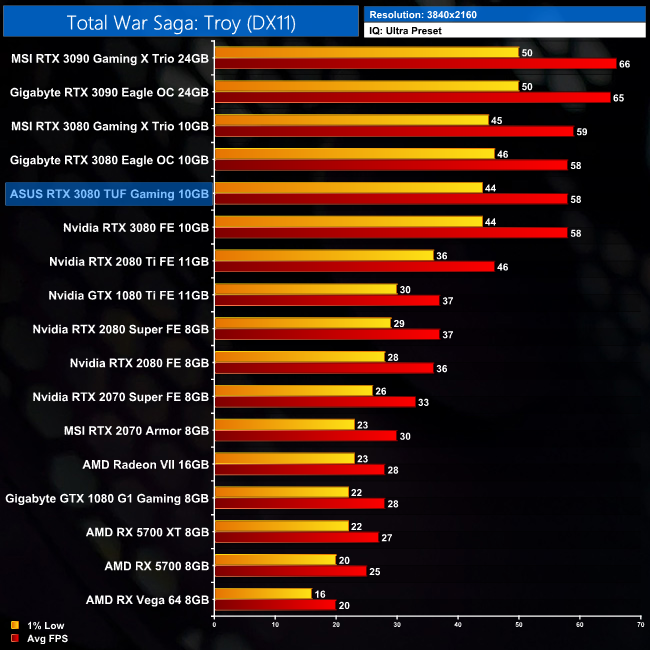
Finally we come to Total War Saga: Troy. Once more, we see no difference between the TUF Gaming and RTX 3080 Founders Edition at 4K. In fact, that is also the case for the RTX 3080 Eagle OC, while MSI's Gaming X Trio is just a single frame faster.
Here we present frame rate figures for each graphics card, averaged across all 11 games on test today. These figures can disguise significant variations in performance from game to game, but provide a useful overview of the sort of performance you can expect at each resolution tested.
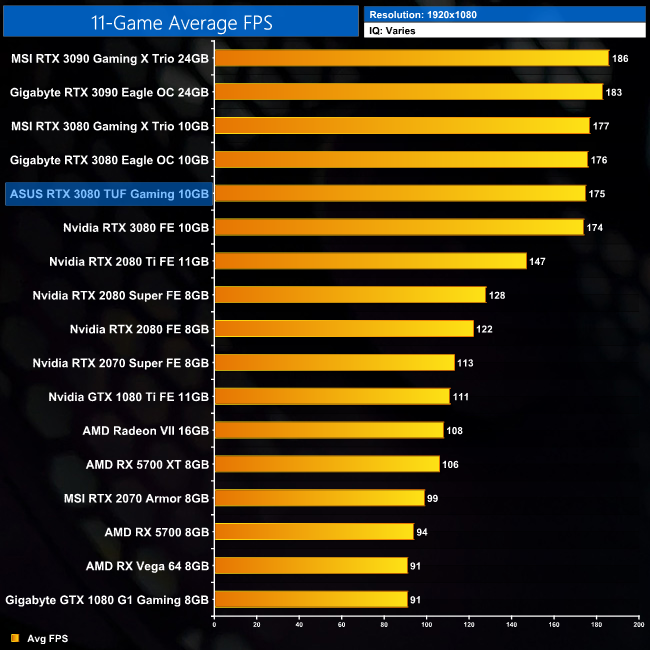
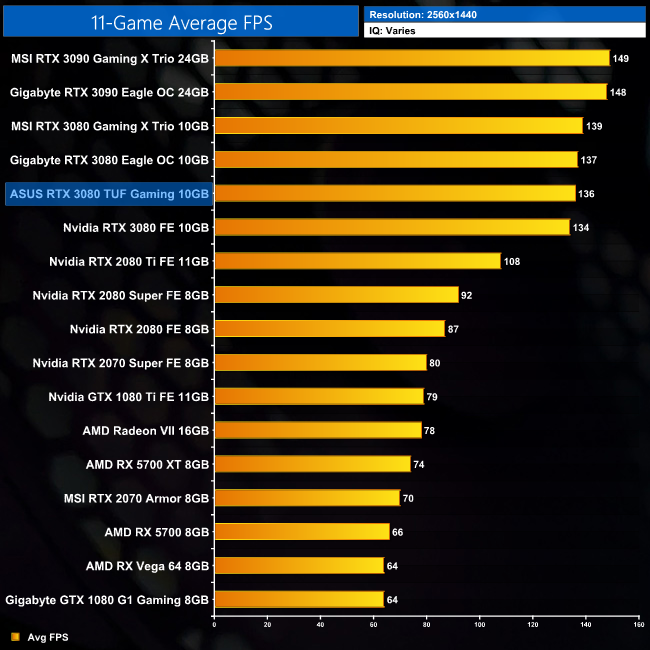
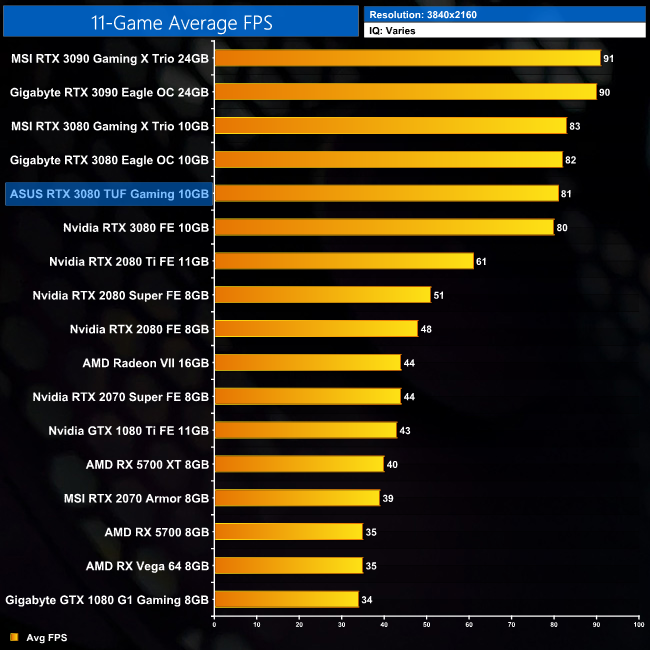
In terms of our average FPS, it's not a shock to see performance of all four RTX 3080s is very similar. At 4K, there's just a 3FPS margin between all four cards – the TUF Gaming is 1% faster than the Founders Edition, but it is also 2% slower than the MSI RTX 3080 Gaming X Trio.
Using the average frame rate data presented on the previous page, here we look at the cost per frame using the UK MSRP launch prices for each GPU.
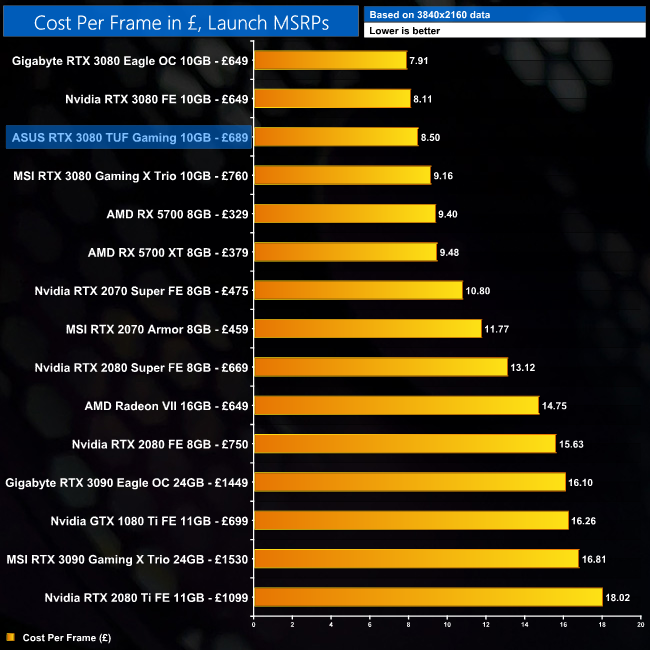
Stock and pricing issues aside, using the given MSRP of £689 for the TUF Gaming, we can see cost per frame works out at £8.50. This is fractionally higher than the Founders Edition and Gigabyte RTX 3080 Eagle OC, but still ahead of every other GPU on the chart.
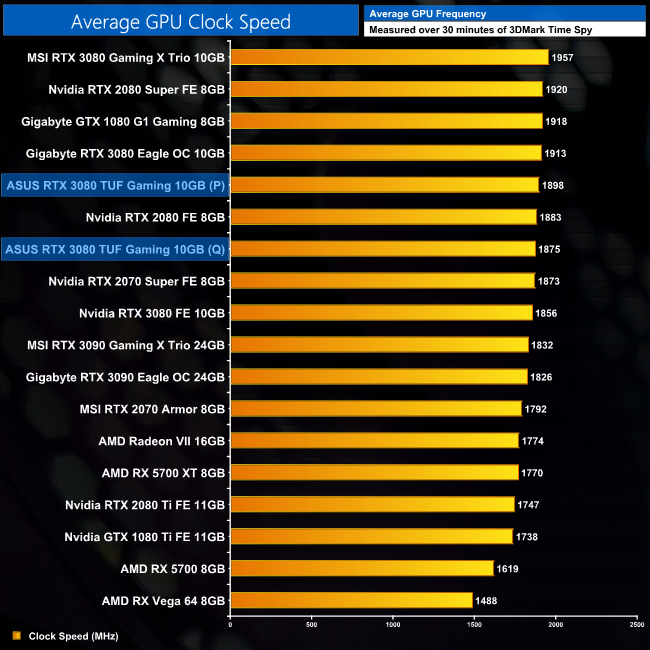
Here we present the average clock speed for each graphics card while running the 3DMark Time Spy stress test for 30 minutes. We use GPU-Z to record the GPU core frequency during the Time Spy runs. We calculate the average core frequency during the 30 minute run to present here.
Click to enlarge.
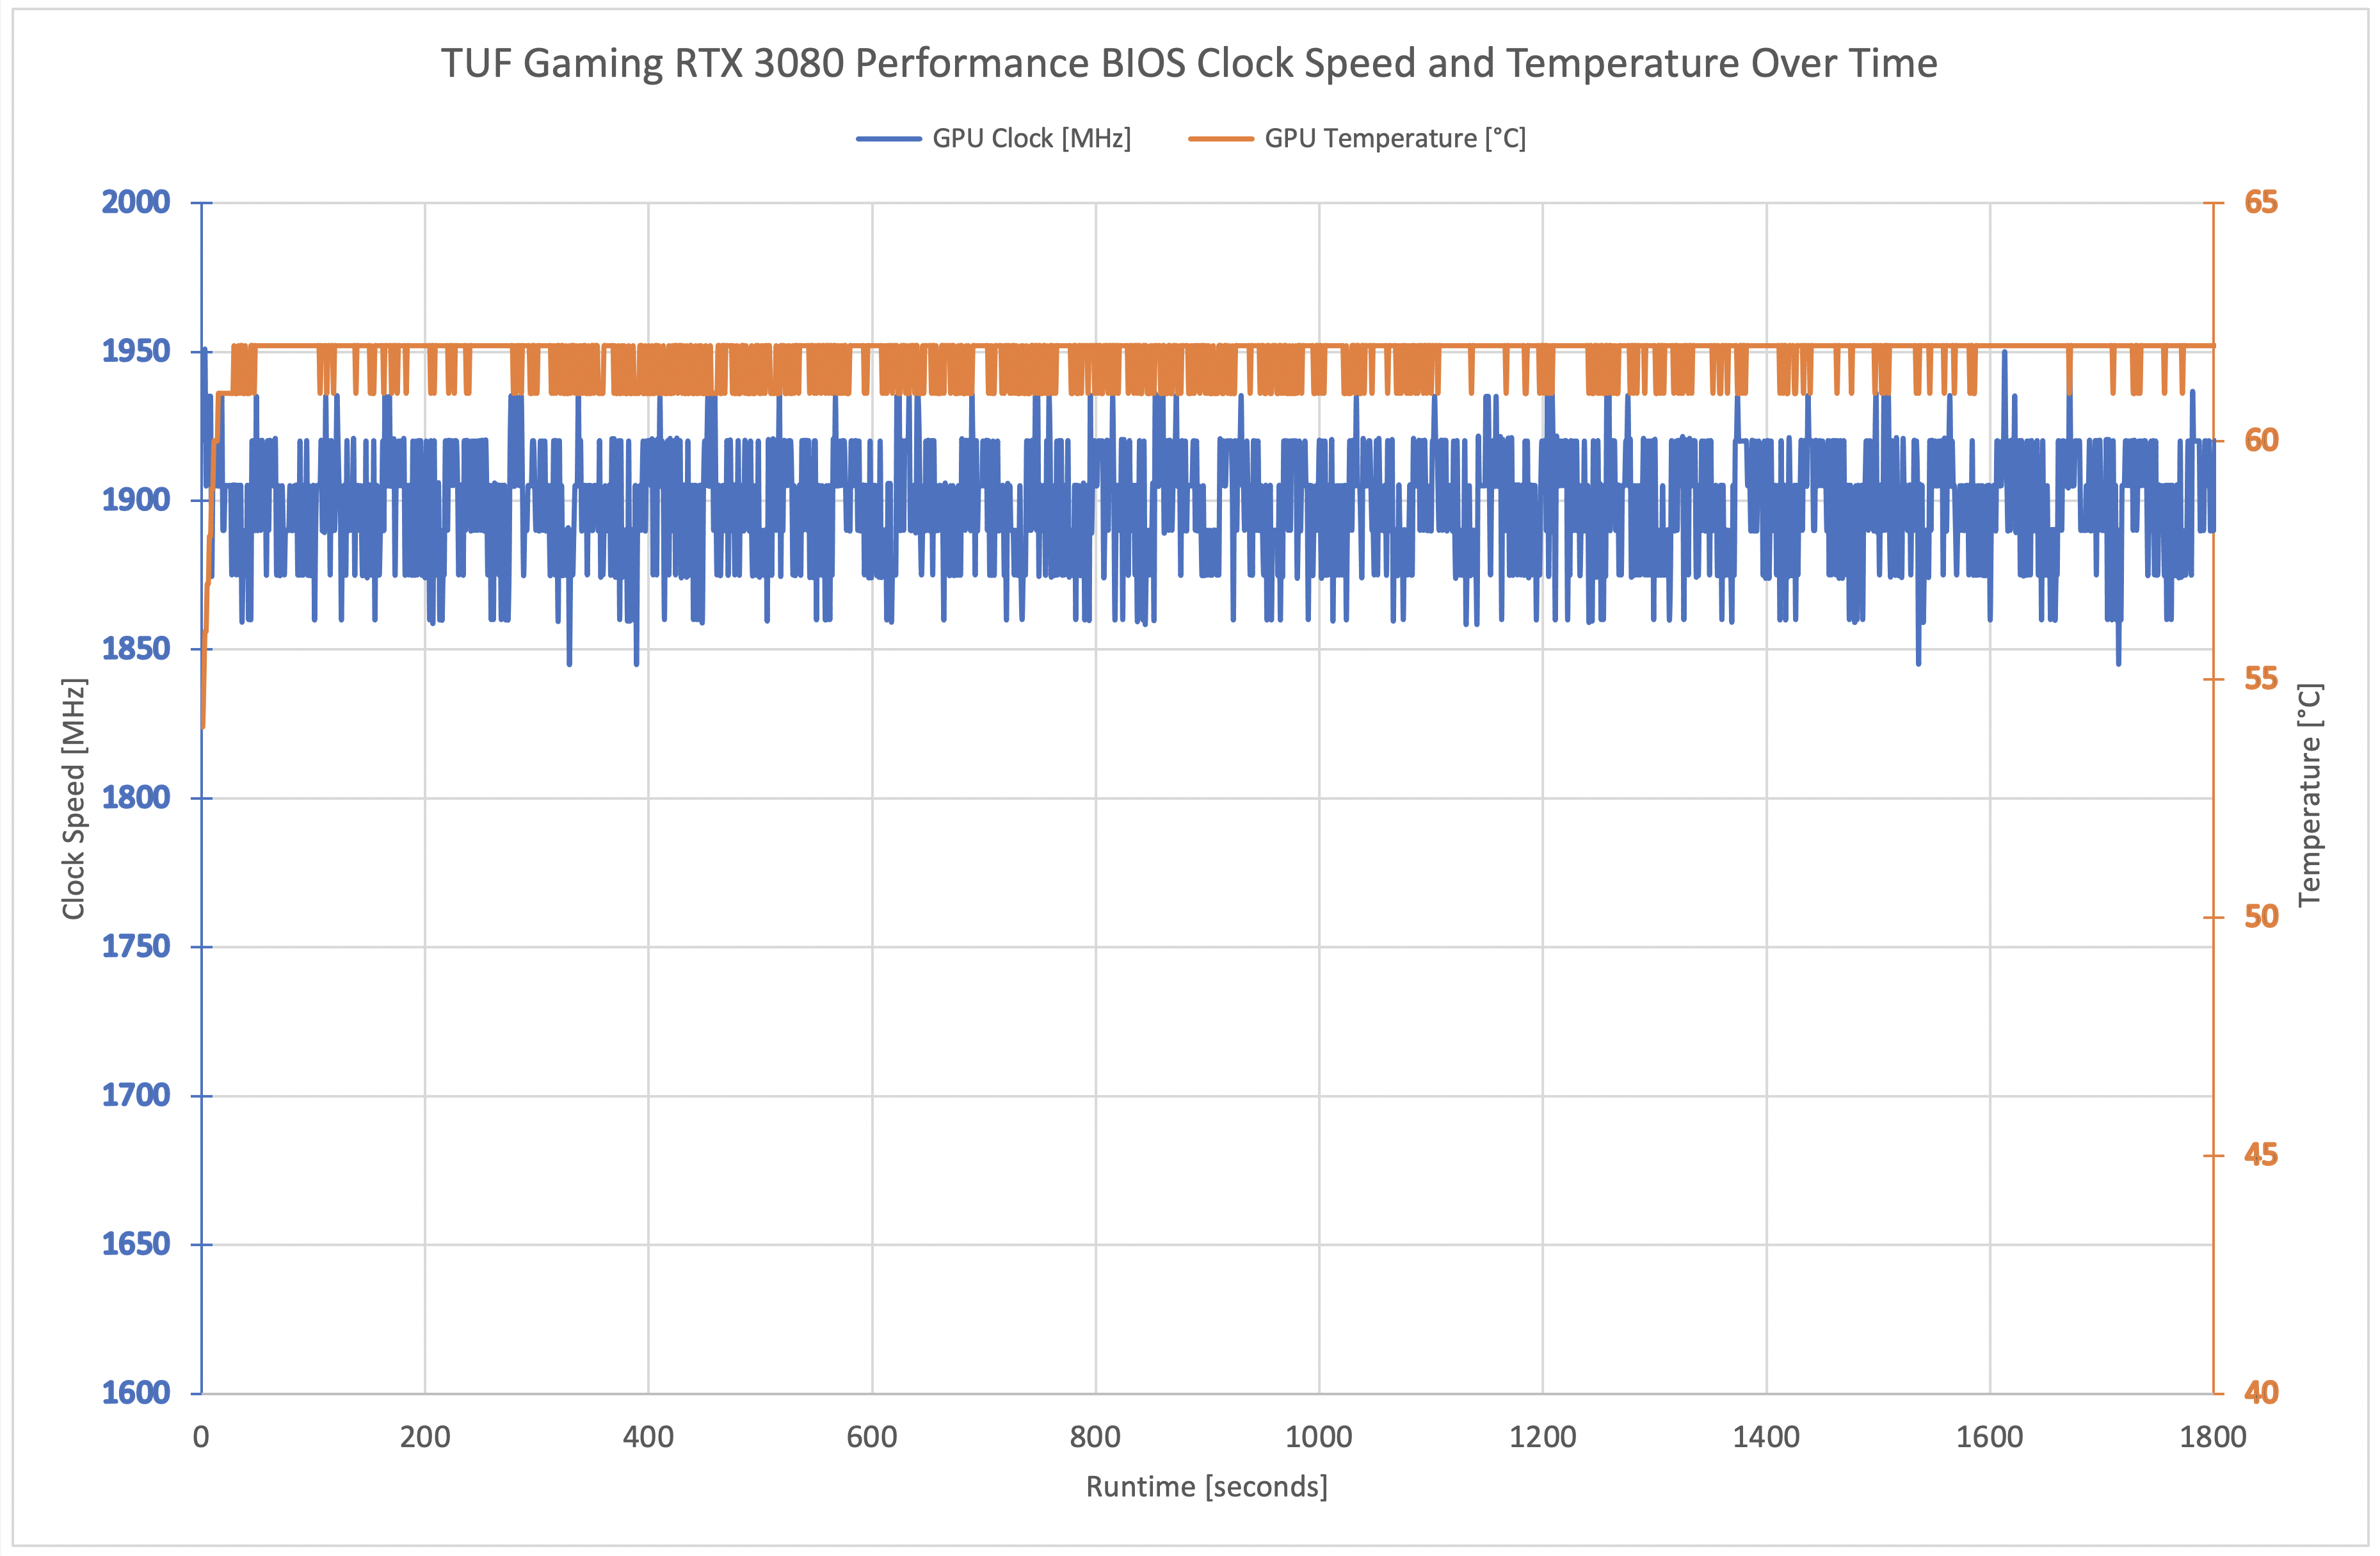
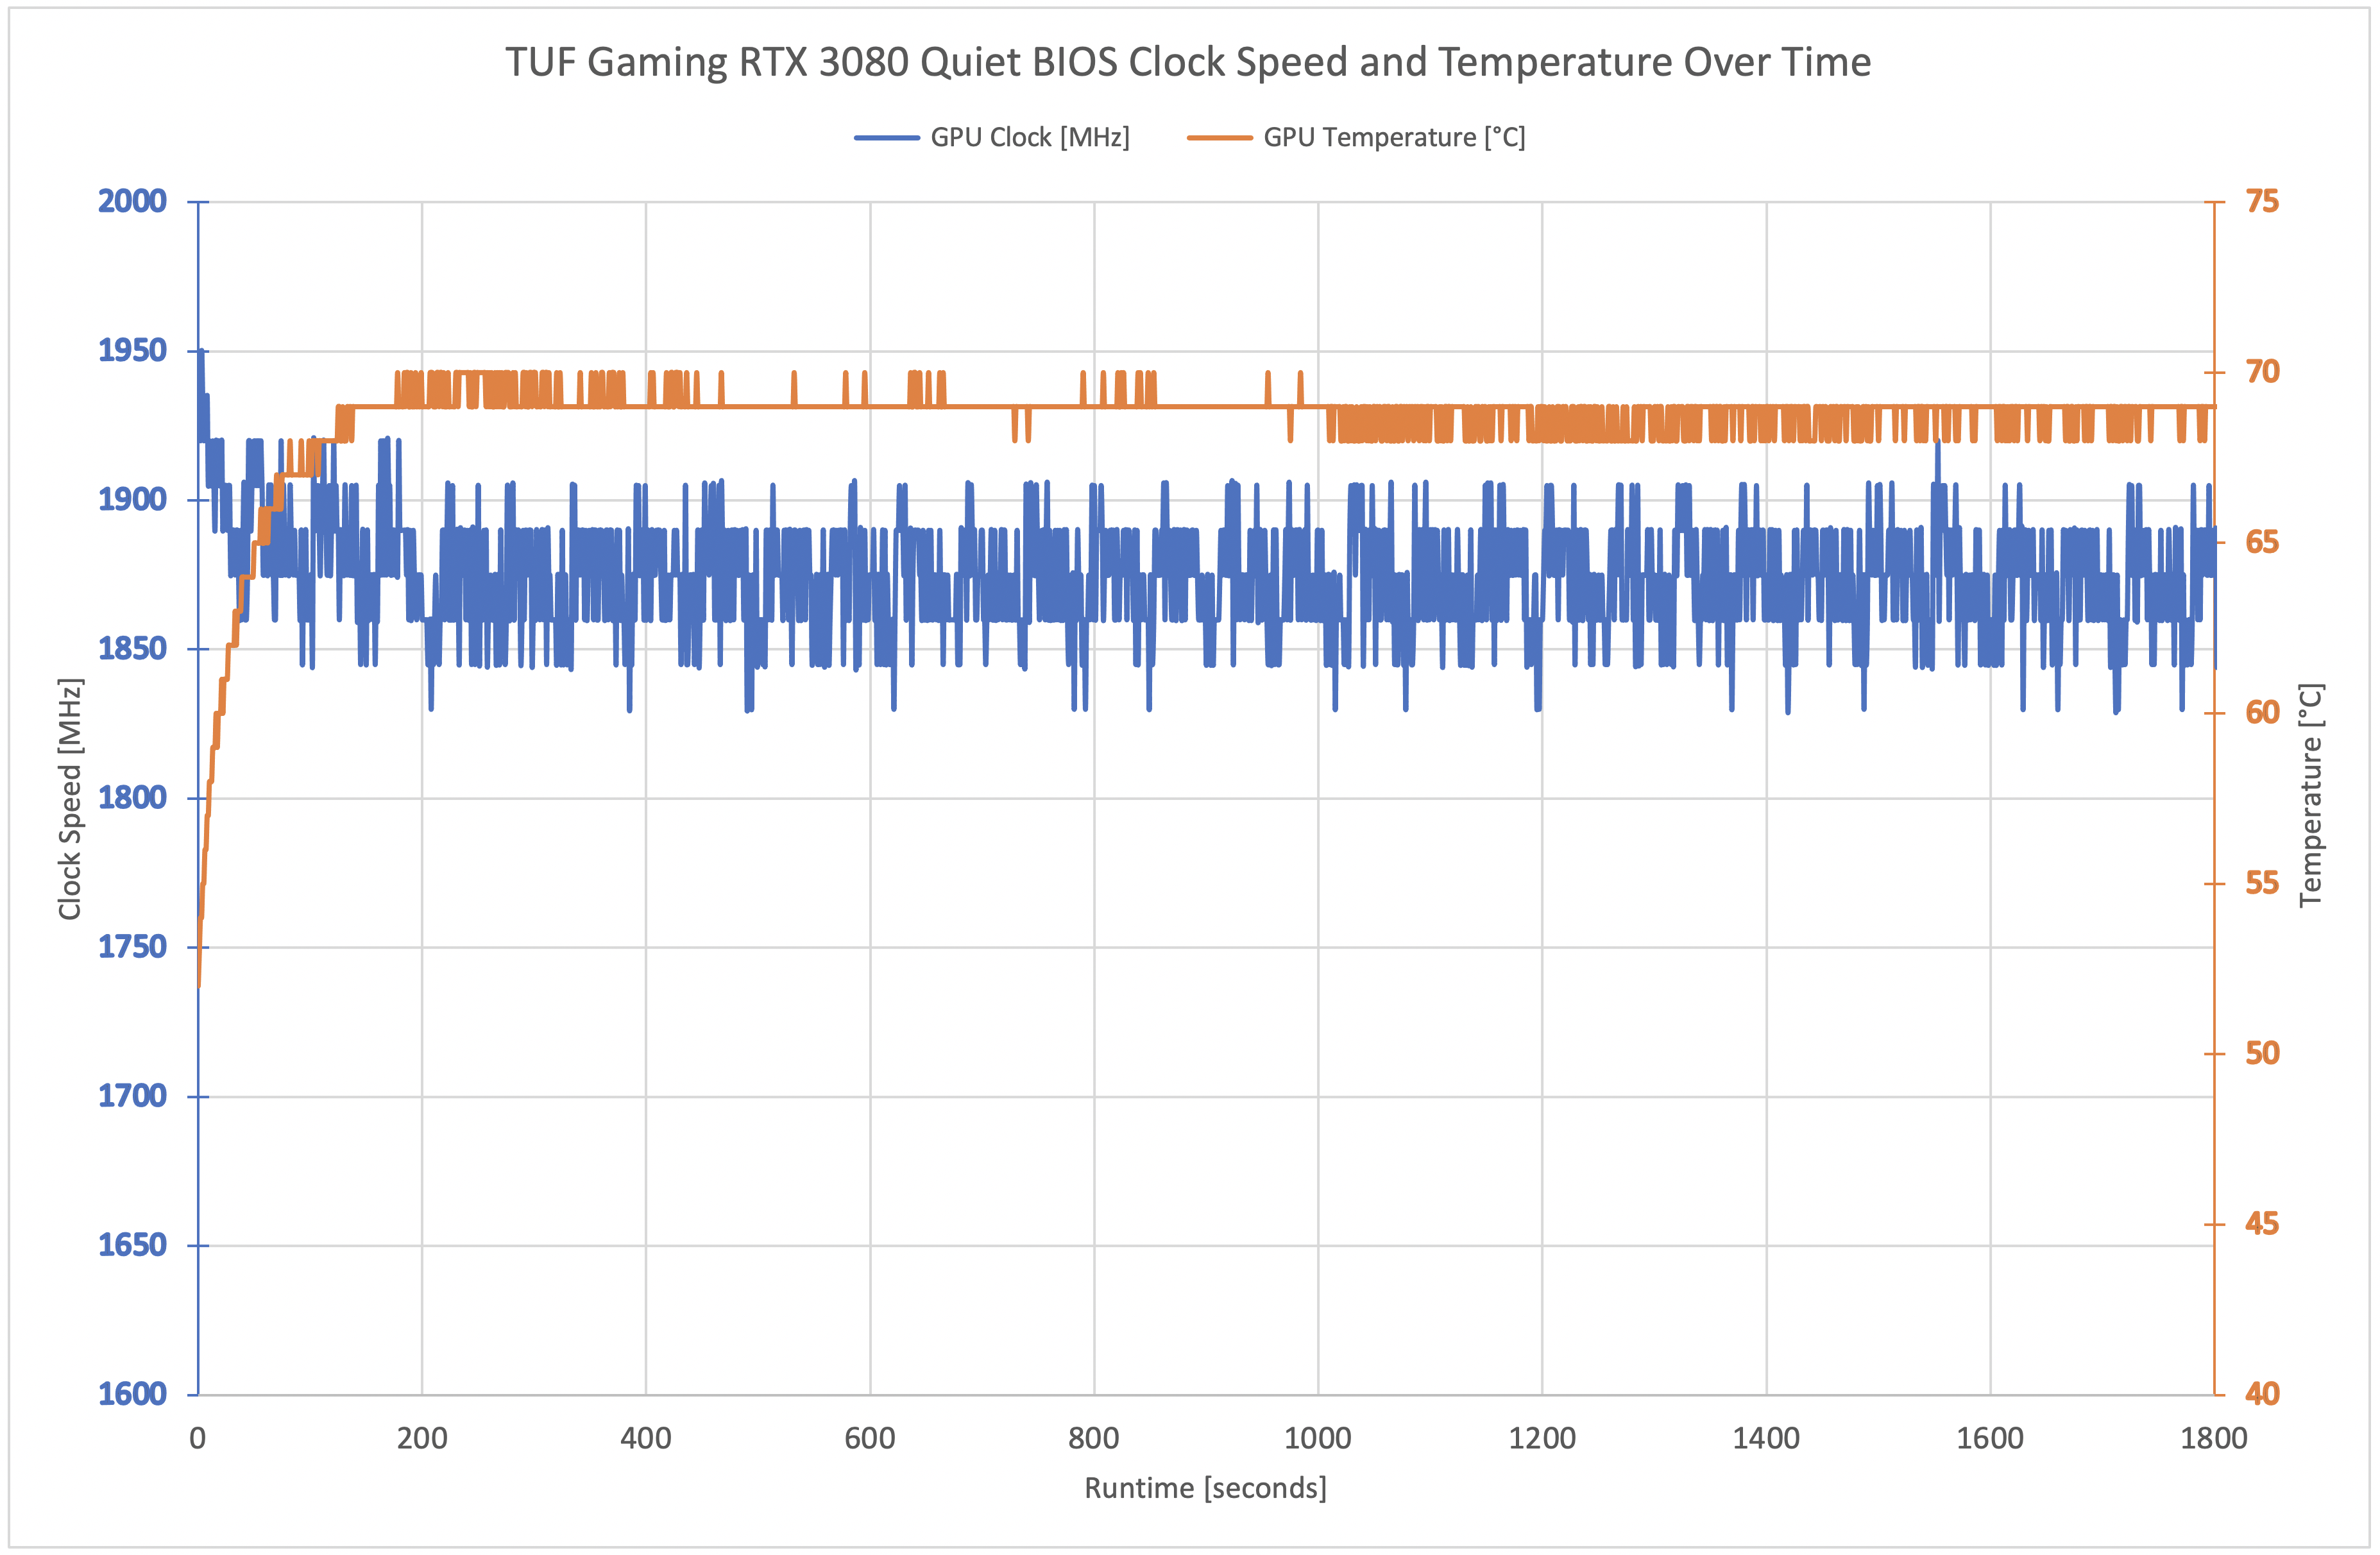
Looking at the card's average clock speed under load, here we test both the Performance and Quiet BIOS. There isn't much of a difference at all, with the P BIOS averaging 1898MHz compared to 1875MHz for the Q BIOS. As far as I can tell, the only actual difference between the two BIOS is the fan curve, as both have the same 340W power target (more on that later) and rated 1785MHz boost clock. That means the small difference in actual clock speed is due to GPU Boost slightly dropping clocks for the Q BIOS, as it does run a little warmer. This is expected behaviour.
For our temperature testing, we measure the peak GPU core temperature under load. A reading under load comes from running the 3DMark Time Spy stress test for 30 minutes.
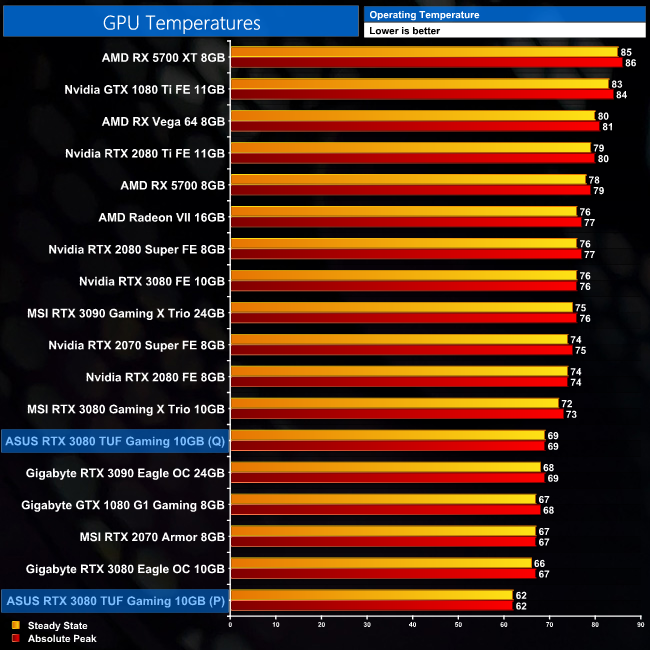
Cooling performance is mighty impressive for the RTX 3080 TUF Gaming. Using the P BIOS, we saw a peak GPU temperature of just 62C, a reduction of 14C compared to the Founders Edition. Even using the Q BIOS, with its more relaxed fan profile, temperatures did not exceed 69C, so regardless of the BIOS you use thermal performance is excellent across the board.
We take our noise measurements with the sound meter positioned 1 foot from the graphics card. I measured the noise floor to be 32 dBA, thus anything above this level can be attributed to the graphics cards. The power supply is passive for the entire power output range we tested all graphics cards in, while all CPU and system fans were disabled. A reading under load comes from running the 3DMark Time Spy stress test for 30 minutes.

The principle difference between the P and Q BIOS is the fan curve, and that is demonstrated by our acoustic testing. Using the default P BIOS, the fans run at 75%, or about 1930rpm. This produced noise levels that were on par with the Founders Edition, and 1dBa quieter than the Gigabyte Eagle OC.
The Q BIOS drops fan speed to 64%, or 1470rpm, and that makes a noticeable difference. Noise levels dropped to 35dBA on our sound meter, just fractionally louder than the MSI RTX 3080 Gaming X Trio, though subjectively speaking I could not tell the difference between the two. It is highly impressive that ASUS has managed to achieve such low noise levels with the Q BIOS, despite the fact the GPU core remained under 70C at all times.
We measure system-wide power draw from the wall while running the 3DMark Time Spy stress test for 30 minutes.
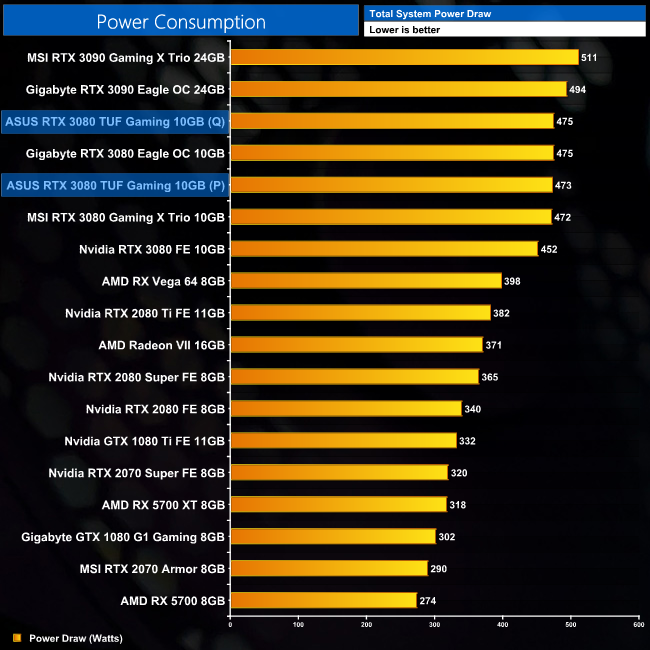
Total system power draw is inline with the other custom RTX 3080s we have tested, with both BIOS pulling around 475W at the wall.
We also use GPU-Z to measure Board Power (graphics card-only power draw). This is currently only available for Nvidia cards, which is why we have excluded AMD results from the chart. Aside from the fact this is software-based reporting, and not a hardware measurement of the PCIe power cables and PCIe slot (for that we’d need something like PCAT), this should provide us more accurate data to work with as it is measuring only the GPU power, and not total system power which is a fundamentally imprecise measurement.
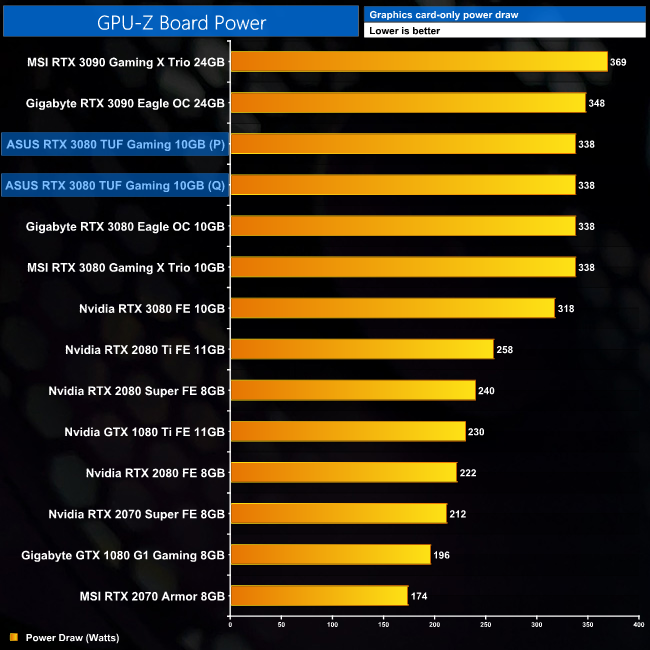
This is because both of the BIOS options have the same 340W power target, which is the same as the Gigabyte Eagle and MSI RTX 3080 Gaming X Trio models we have tested. Accordingly, board power for all three averages out to 338W.
By using the GPU-Z Board Power data in conjunction with the 11-game average FPS data we presented earlier in this review, we can work out performance per Watt for each graphics card. This is presented as FPS per Watt.
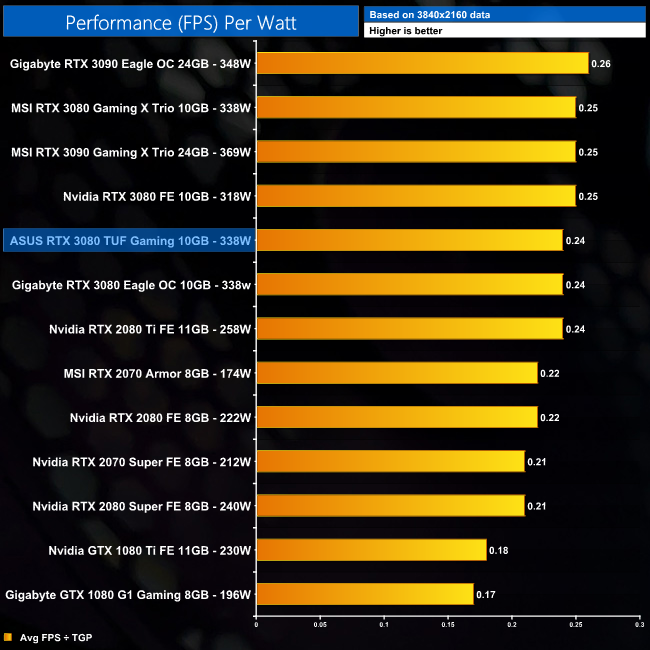
Performance per Watt is right at the same level as the Gigabyte RTX 3080 Eagle, and only fractionally behind the Founders Edition and MSI RTX 3080 Gaming X Trio.
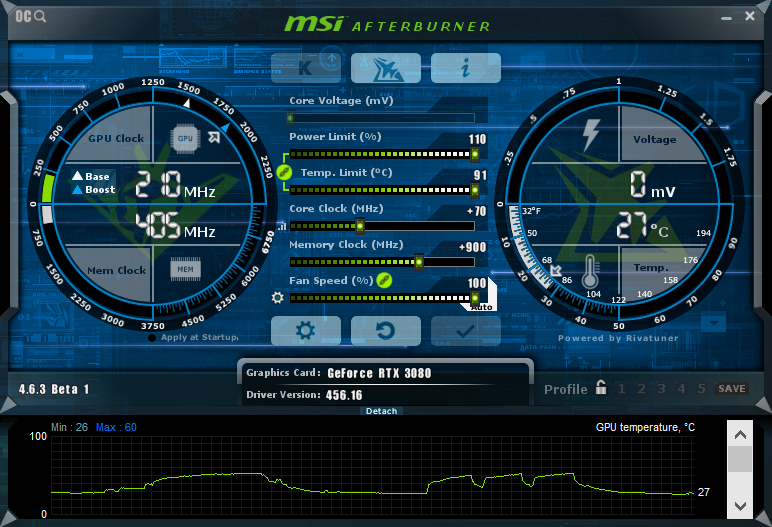
We've not had a lot of luck when manually overclocking the other RTX 3080 cards we have tested, but we did slightly better with the TUF Gaming. We managed to add 70MHz to the GPU core, and 900MHz to the GDDR6X memory.
This overclock still didn't bring us huge real-world gains, as we saw an extra 5% performance in Gears 5, 4% in Ghost Recon: Breakpoint, and 3% in Total War Saga: Troy.
The graphics card reviews have been coming thick and fast over the last couple of weeks, and the ASUS RTX 3080 TUF Gaming OC is actually the fourth RTX 3080 we have tested so far. It has certainly impressed us across the board, and at its £689 asking price (current pricing instability aside) it represents excellent value for money.
To recap gaming performance, there isn't a whole lot to say here, as the TUF Gaming is on average 1% faster than Nvidia's Founders Edition RTX 3080. Compared to an aggressively clocked parter card like the MSI RTX 3080 Gaming X Trio, it is on average 2% slower, but that is hardly a significant point. Up against last generation's flagship, the RTX 2080 Ti, the TUF Gaming RTX 3080 delivers 33% better performance.
There's also been a lot of speculation recently about the choice of capacitors each RTX 3080 uses, and whether or not that is linked to instability issues some users have experienced. All I can say on that topic is throughout the entirety of my testing with this card, I did not experience any crashes while benchmarking games or running various stress tests. It appears that Nvidia's latest 456.55 driver is fixing the issues for a lot of people, but I can't really comment on that as it simply didn't affect me during my testing.
Moving on, where this GPU really excels is with its thermal and acoustic performance. We get a great first impression due to the all-aluminium shroud that ASUS has used, which gives the card a premium feel in the hand, while it runs very cool out of the box. There is a choice of Performance and Quiet BIOS options, with the former seeing the GPU run no hotter than 62C. Even the Quiet BIOS kept temperatures below 70C at all times.
Noise levels are similarly impressive, with the Quiet BIOS running the fans at less than 1500RPM, resulting in a very quiet graphics. It is just louder than the MSI RTX 3080 Gaming X Trio according to our sound meter, but the difference was not noticeable to my ear.
In a nutshell, the TUF Gaming RTX 3080 OC is a stellar offering from ASUS and it has been a joy to test. It is a significant improvement on the Founders Edition for only £40 more. In fact, if you were to get the regular non-OC edition, that version is even cheaper at £649 – matching the Founders Edition MSRP – so at the expense of just 70MHz lost from the clock speed, the non-OC edition is the card that I would go for personally.
It's also great to see that ASUS has clearly listened to the feedback it received from its previous generation of cooler designs. The company has added an extra GPU mounting bracket to ensure there is sufficient pressure between the GPU and the heatsink, while VRAM cooling has also been significantly enhanced thanks to the use of a dedicated memory heatsink. Rather than sweeping these issues under the rug, ASUS has addressed them head-on with the RTX 3080 TUF Gaming, and that is commendable.
All in all then, this is a very high quality piece of kit that delivers excellent value considering the MSRP of £689. We can't yet say when cards will actually be available to buy at that price in the UK, but once they are, this is certainly a card that needs to be on your final shortlist.
It is out of stock at the time of writing, but Currys has the RTX 3080 TUF Gaming listed for £689 HERE.
Discuss on our Facebook page HERE.
Pros
- RTX 3080 performance is highly impressive for 1440p and 4K gaming.
- All-aluminium shroud feels premium, and is colour-neutral too.
- Runs very quiet and very cool.
- Dual-BIOS functionality.
- Two HDMI 2.1 ports, instead of just one.
- Terrific all-round performance at £689.
Cons
- The non-OC edition is arguably the better buy.
- Limited overclocking headroom.
KitGuru says: ASUS has impressed me greatly with the TUF Gaming RTX 3080. If this is the sort of quality we are seeing from the TUF lineup, I do wonder just how special the ROG Strix model could be…