
The dust has hardly settled from the launch of Nvidia's RTX 3080, but already we are back with a look at the next GPU in the stack. Sitting at the head of the Ampere family, the RTX 3090 is nothing short of a monster in terms of its spec, boasting 82 Streaming Multiprocessors, 10496 CUDA Cores, 24GB (!) of GDDR6X memory, and total memory bandwidth approaching 1TB per second. Here we look at Gigabyte's implementation of this GPU in its Eagle OC graphics card, and see just how fast this GPU is.
The Gigabyte RTX 3090 Eagle OC will look very familiar. Just last week, we reviewed the RTX 3080 Eagle OC, finding it to be a very capable card that also offers excellent value. ‘Value' is not something that applies to the RTX 3090, and this model is priced at £1449 here in the UK. For that price, we get a triple-fan cooler, metal backplate, factory overclocked core and a hint of RGB lighting – on top of the performance of the RTX 3090 GPU itself.
| GPU | RTX 3090 | RTX 3080 | RTX 2080 Ti (FE) | RTX 2080 SUPER | RTX 2080 (FE) |
| SMs | 82 | 68 | 68 | 48 | 46 |
| CUDA Cores | 10496 | 8704 | 4352 | 3072 | 2944 |
| Tensor Cores | 328 | 272 | 544 | 384 | 368 |
| RT Cores | 82 | 68 | 68 | 48 | 46 |
| Texture Units | 328 | 272 | 272 | 192 | 184 |
| ROPs | 112 | 96 | 88 | 64 | 64 |
| GPU Boost Clock | 1695 MHz | 1710 MHz | 1635 MHz | 1815 MHz | 1800 MHz |
| Memory Data Rate | 19.5 Gbps | 19 Gbps | 14 Gbps | 15.5 Gbps | 14 Gbps |
| Total Video Memory | 24GB GDDR6X | 10GB GDDR6X | 11GB GDDR6 | 8GB GDDR6 | 8GB GDDR6 |
| Memory Interface | 384-bit | 320-bit | 352-bit | 256-bit | 256-bit |
| Memory Bandwidth | 936 GB/Sec | 760 GB/Sec | 616 GB/sec | 496.1 GB/sec | 448 GB/sec |
| TGP | 350W | 320W | 260W | 250W | 225W |
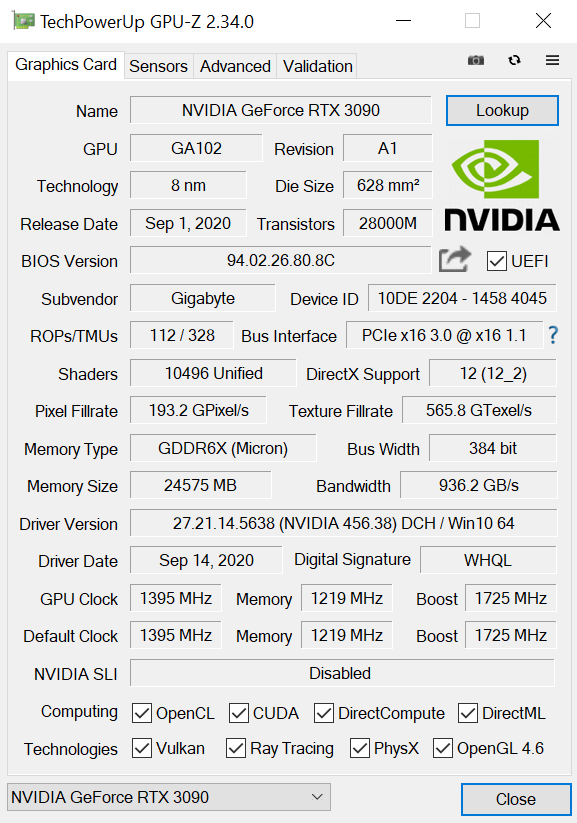
RTX 3090 uses the GA102 GPU, which also forms the basis for RTX 3080. Even with its 82 SMs, however, this is not actually a full implementation of GA102, as a fully populated die houses 84 SMs, so just two are missing from the RTX 3090. Ampere has doubled the number of FP32 shaders per SM, so there's a total of 128 CUDA Cores in each of those 82 SMs, for a grand total of 10496.
Each SM also houses a single RT Core, as well as four Tensor cores, giving us 328 with the RTX 3090. Additionally, there's 328 texture units and 112 ROPs.
As for the memory, this is a significant step up from the RTX 3080. RTX 3090 of course still uses GDDR6X memory, but it has over double the amount with 24GB. Additionally, the modules are clocked slightly faster at 19.5Gbps, and the memory interface is also slightly wider than RTX 3080, with a 384-bit interface. Total memory bandwidth comes in just shy of 1TB/s, hitting 936 GB/s.
Finally, the one are where Gigabyte has tweaked things is with the clock speed. RTX 3090 defaults to a boost clock of 1695MHz, but Gigabyte has added 30MHz to this, bringing it up to 1725MHz. Later in the review we test exactly how fast this GPU actually operates, as we would expect GPU Boost to bring clock speed well above the rated speed.
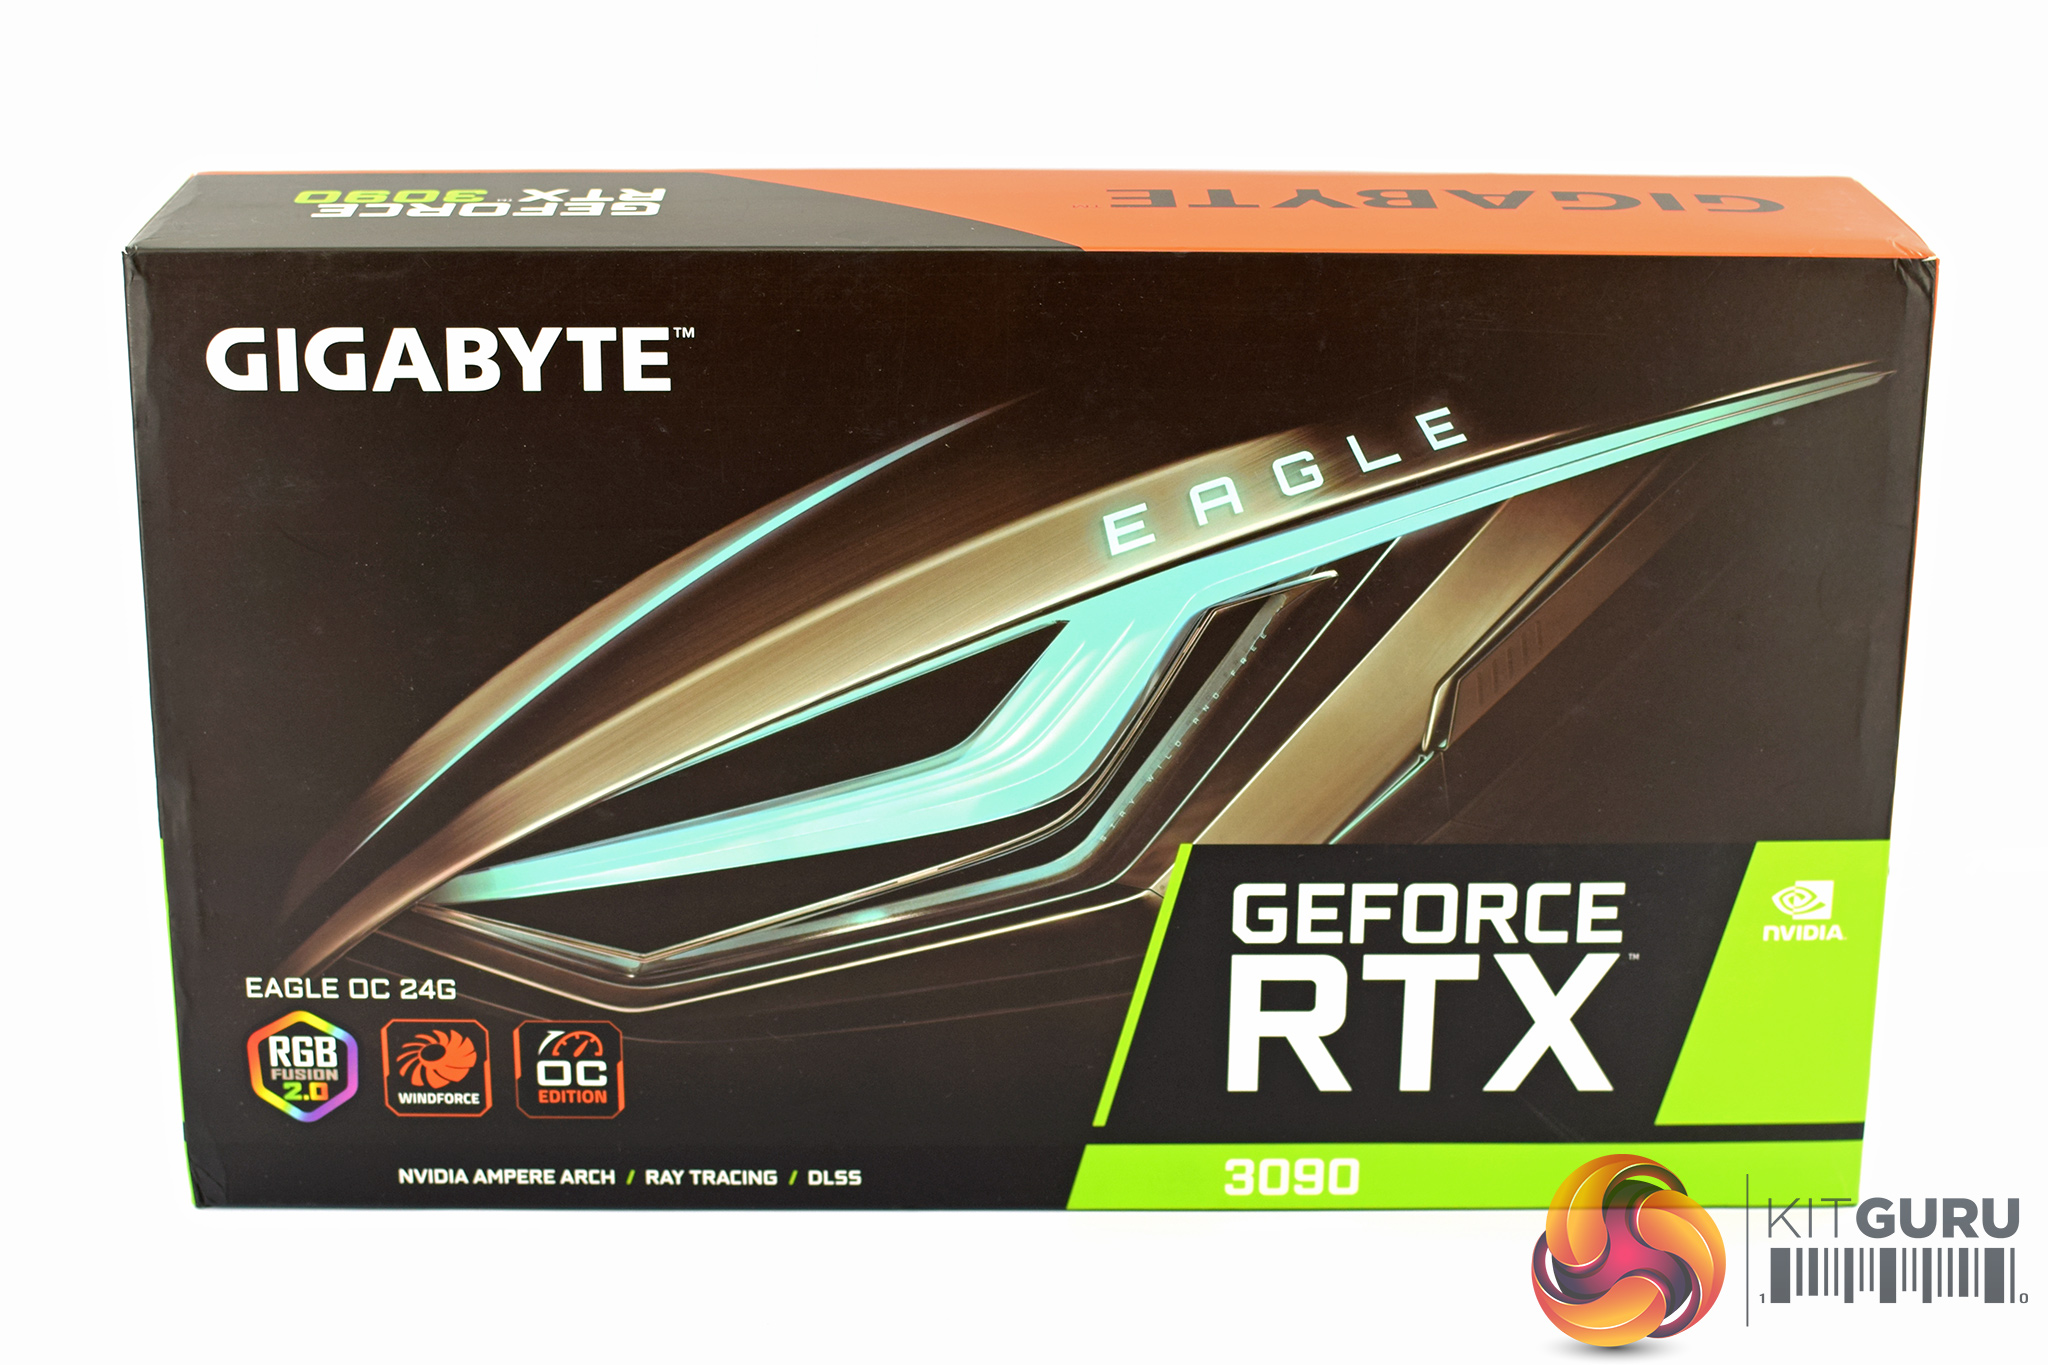
The Gigabyte RTX 3090 Eagle OC ships in a dark box, with the Eagle logo and branding visible on the front.
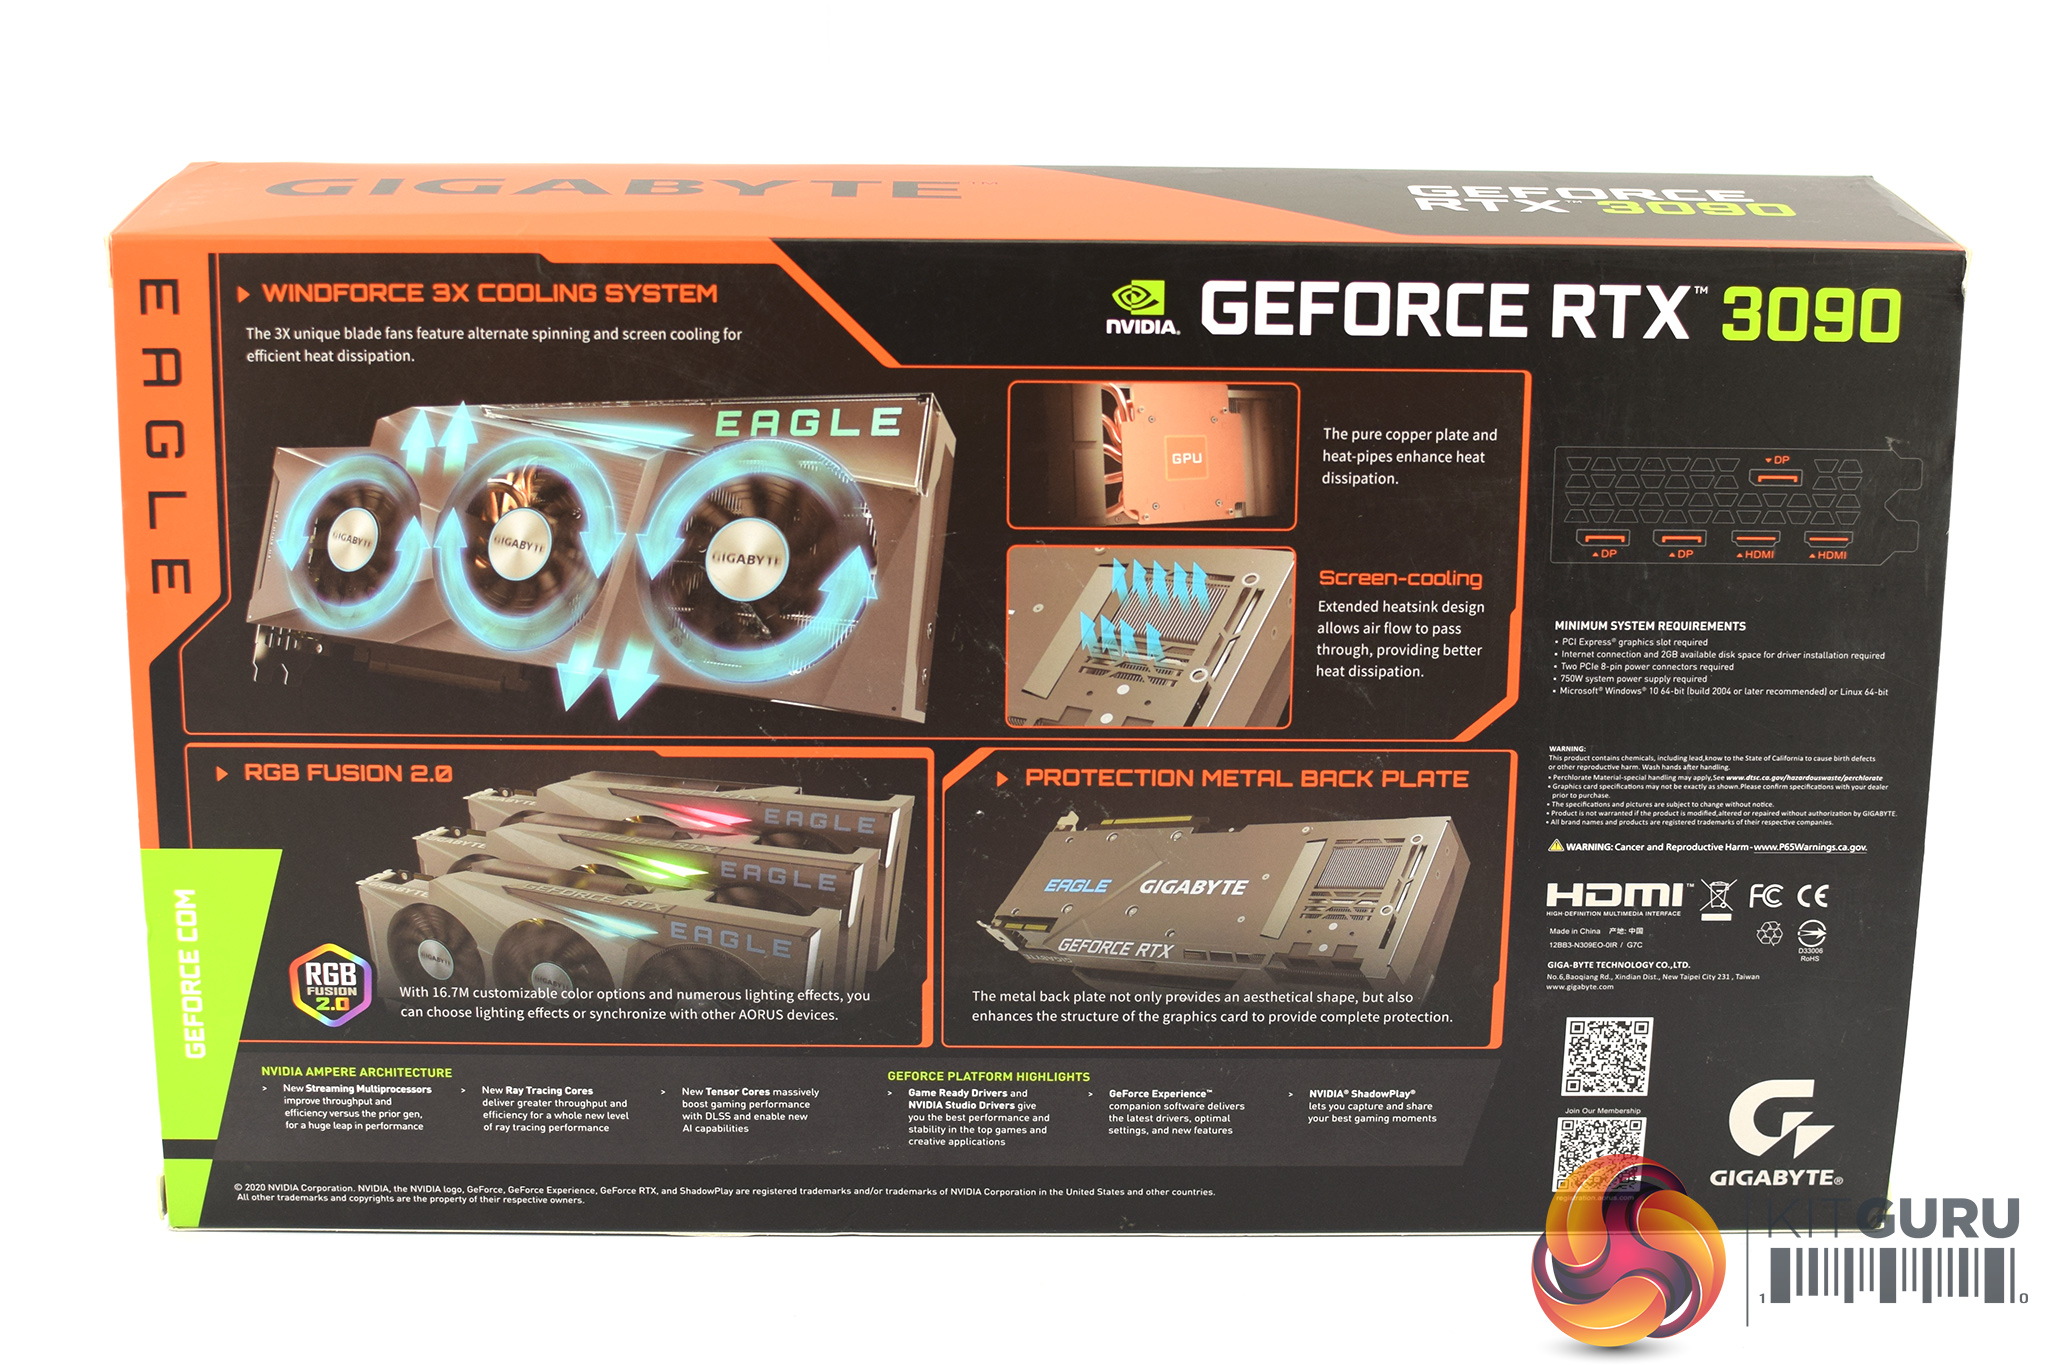
On the back Gigabyte highlights a few key areas of the card design, including its RGB lighting, triple-fan cooler and backplate.
The only included accessory is a small quick start guide.
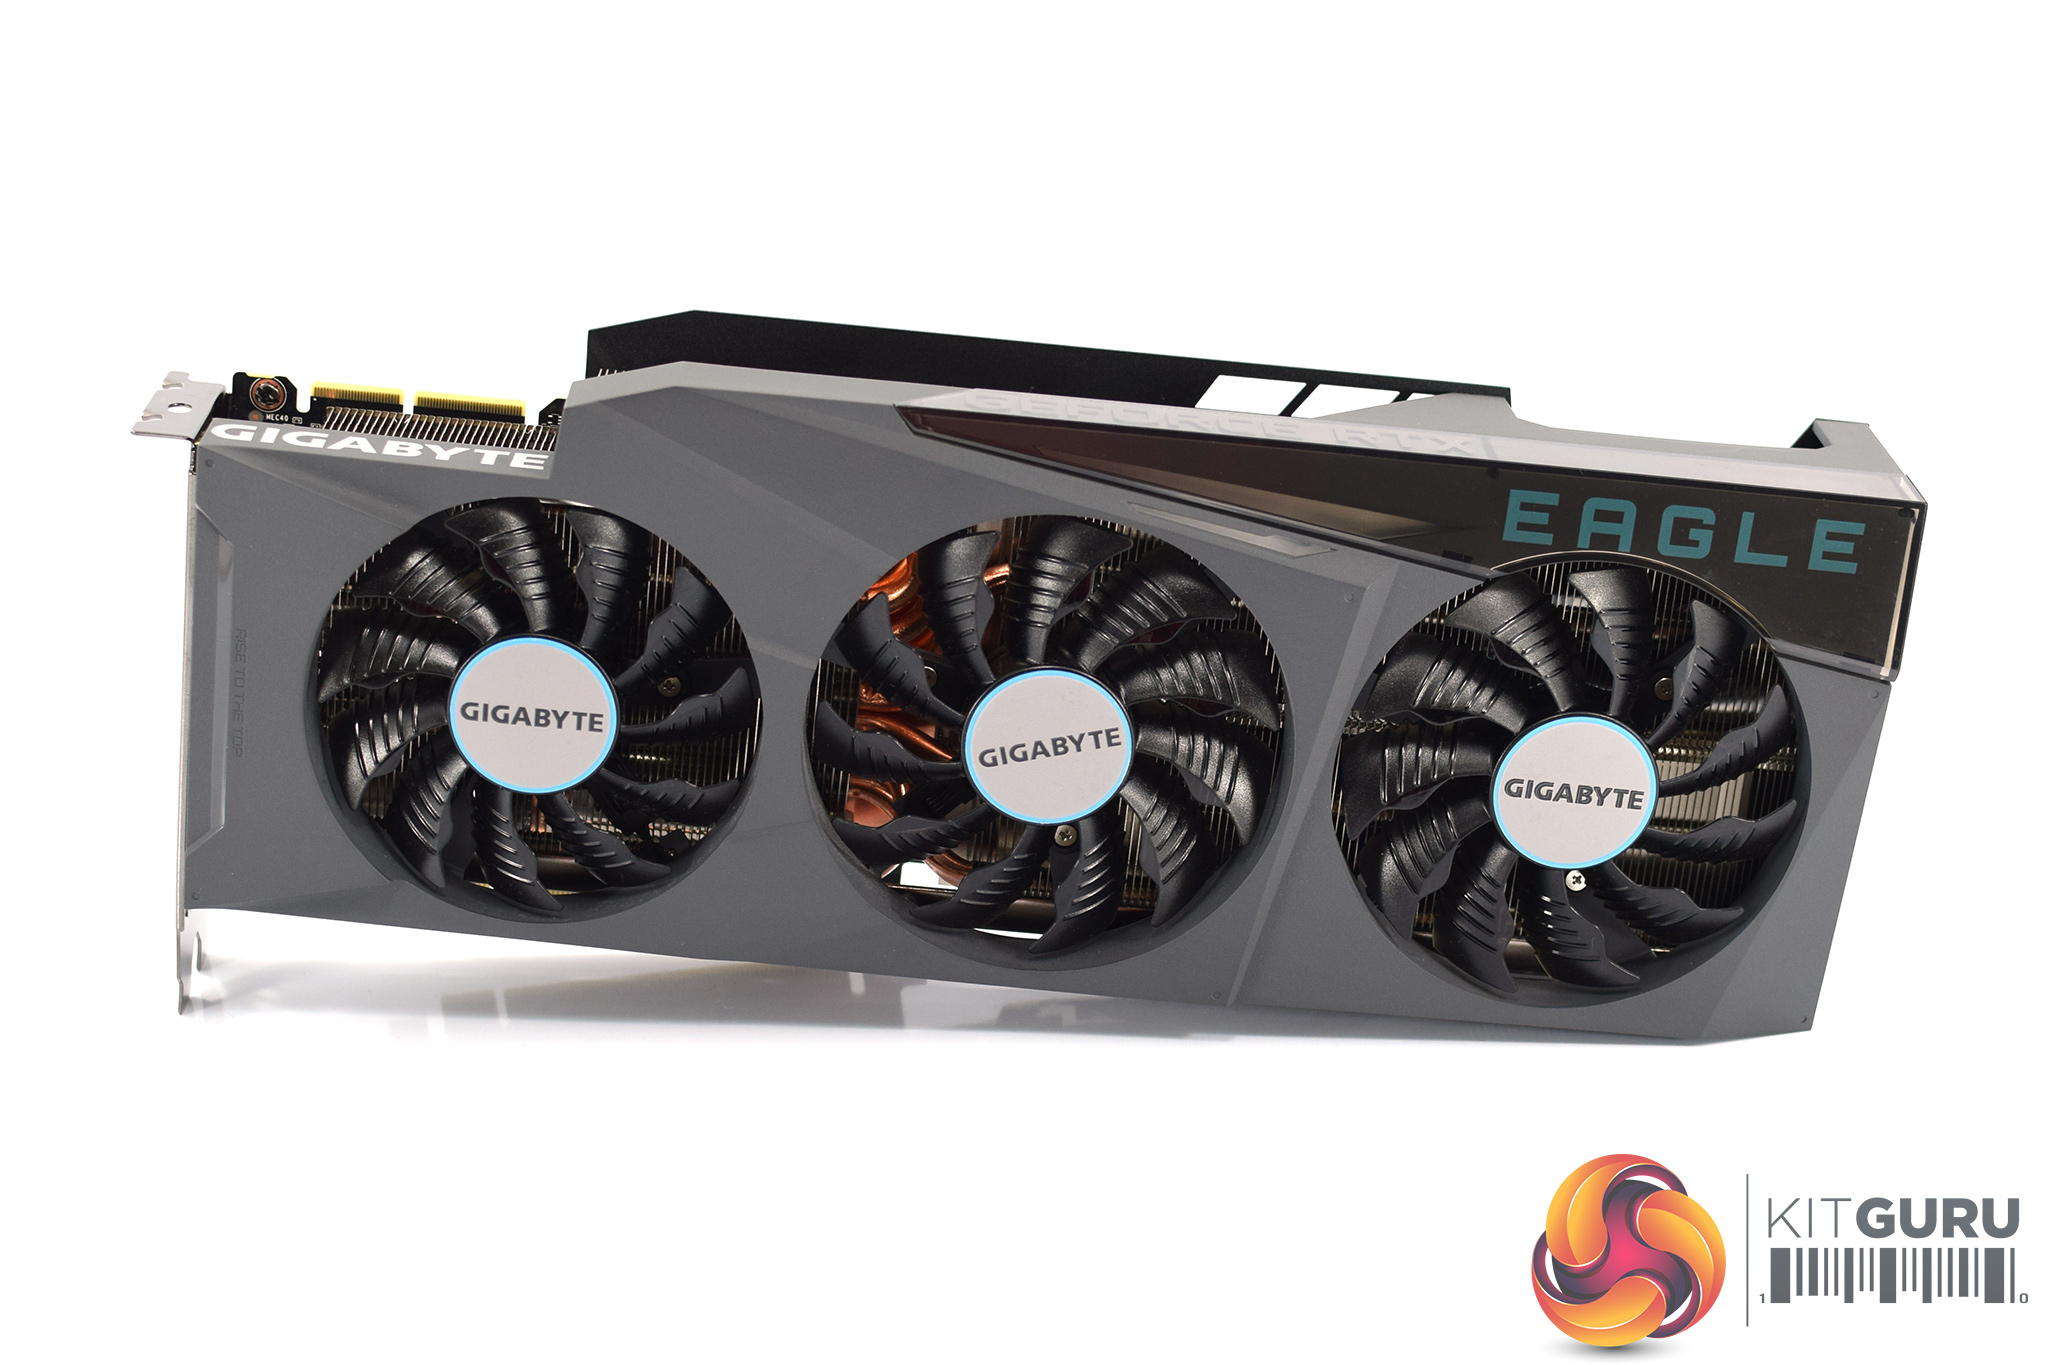
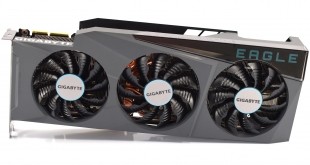
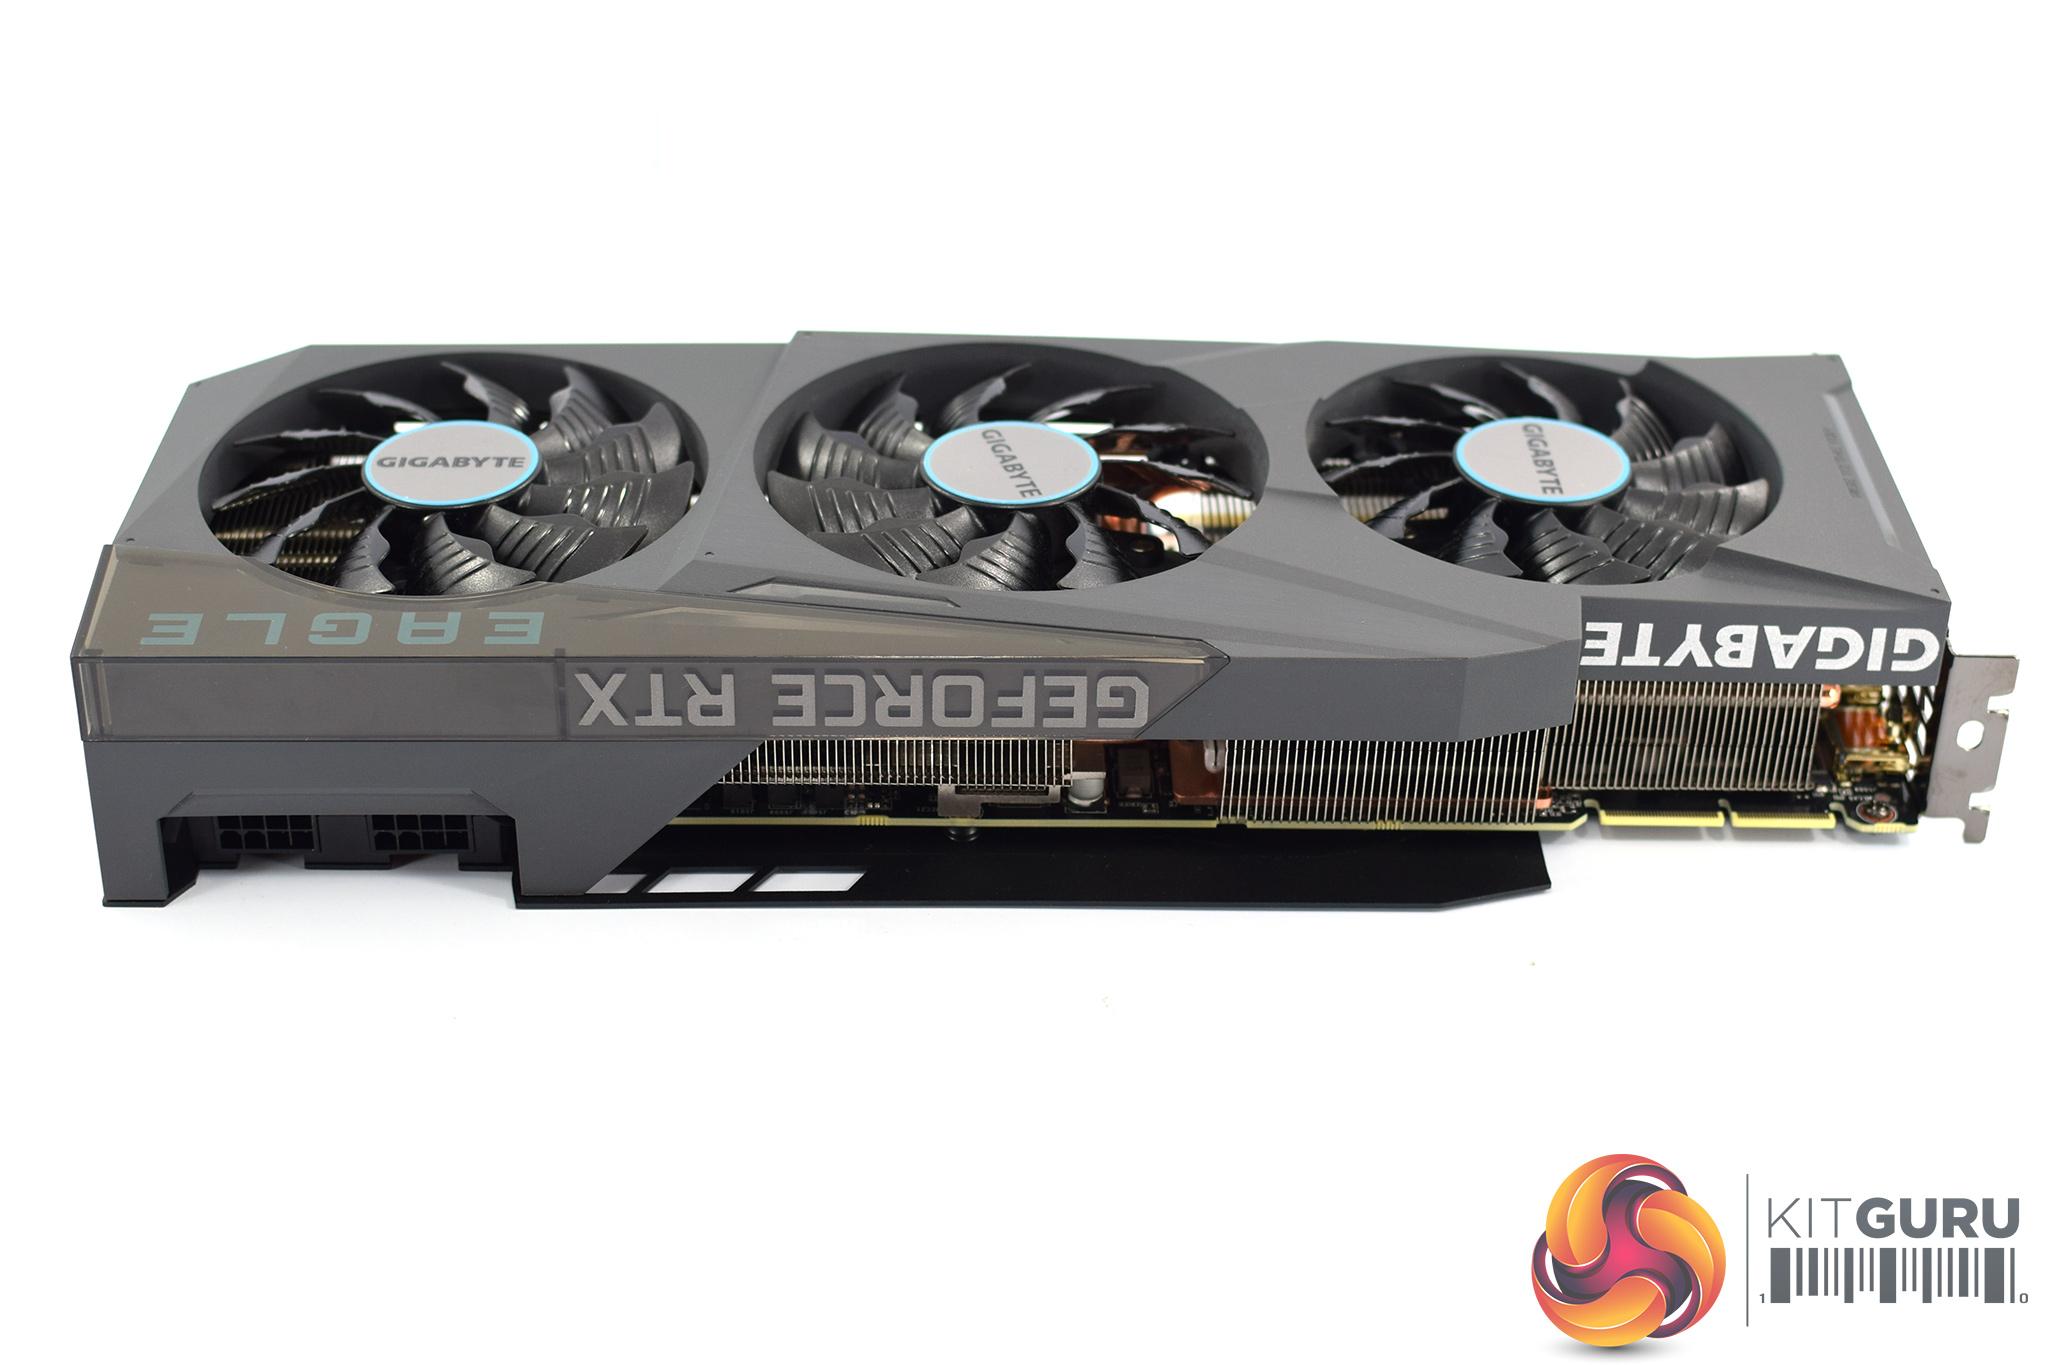
For the graphics card itself, as we alluded to on the first page, this is the exact same cooler and shroud as per the RTX 3080 Eagle OC. This means the card uses a relatively stripped-back design, with a mostly grey plastic shroud. We can also note the translucent area which is home to the Eagle brand name.
As for the cooler, this is another of Gigabyte's Windforce 3X designs. Of course, it's a triple-fan solution, with the fan closest to the I/O bracket measuring 80mm, while the other two are 90mm. The central fan also spins in reverse, which is designed to reduce airflow turbulence.
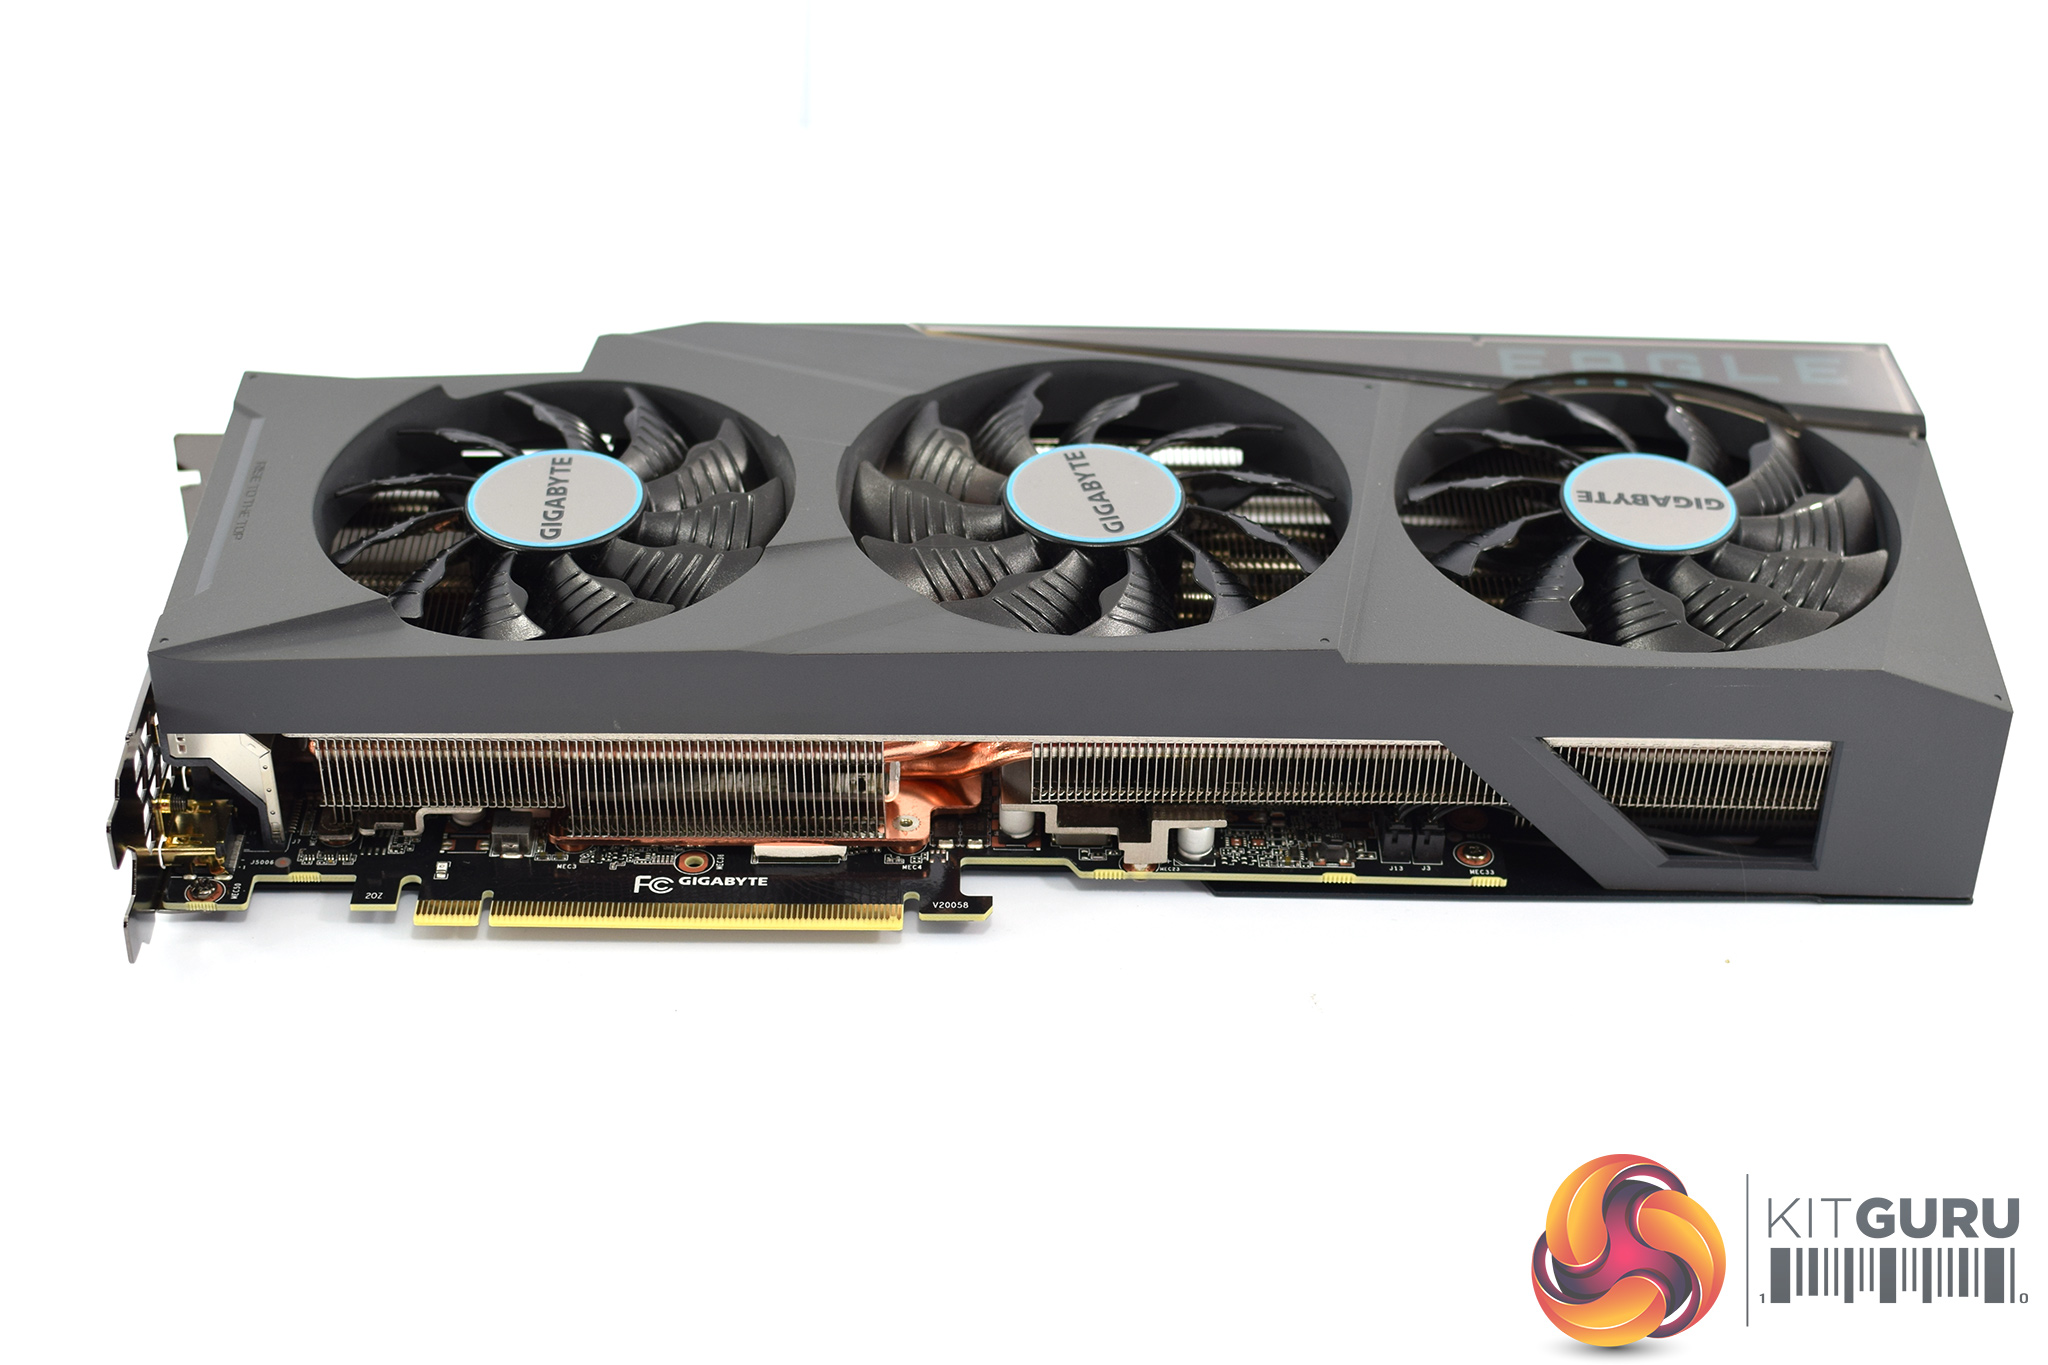
It's certainly a big card. While we don’t have official dimensions from Gigabyte at the time of writing, my measurements put the overall size at approximately 32cm x 13cm x 5.5cm. It requires three expansion slots in your system.
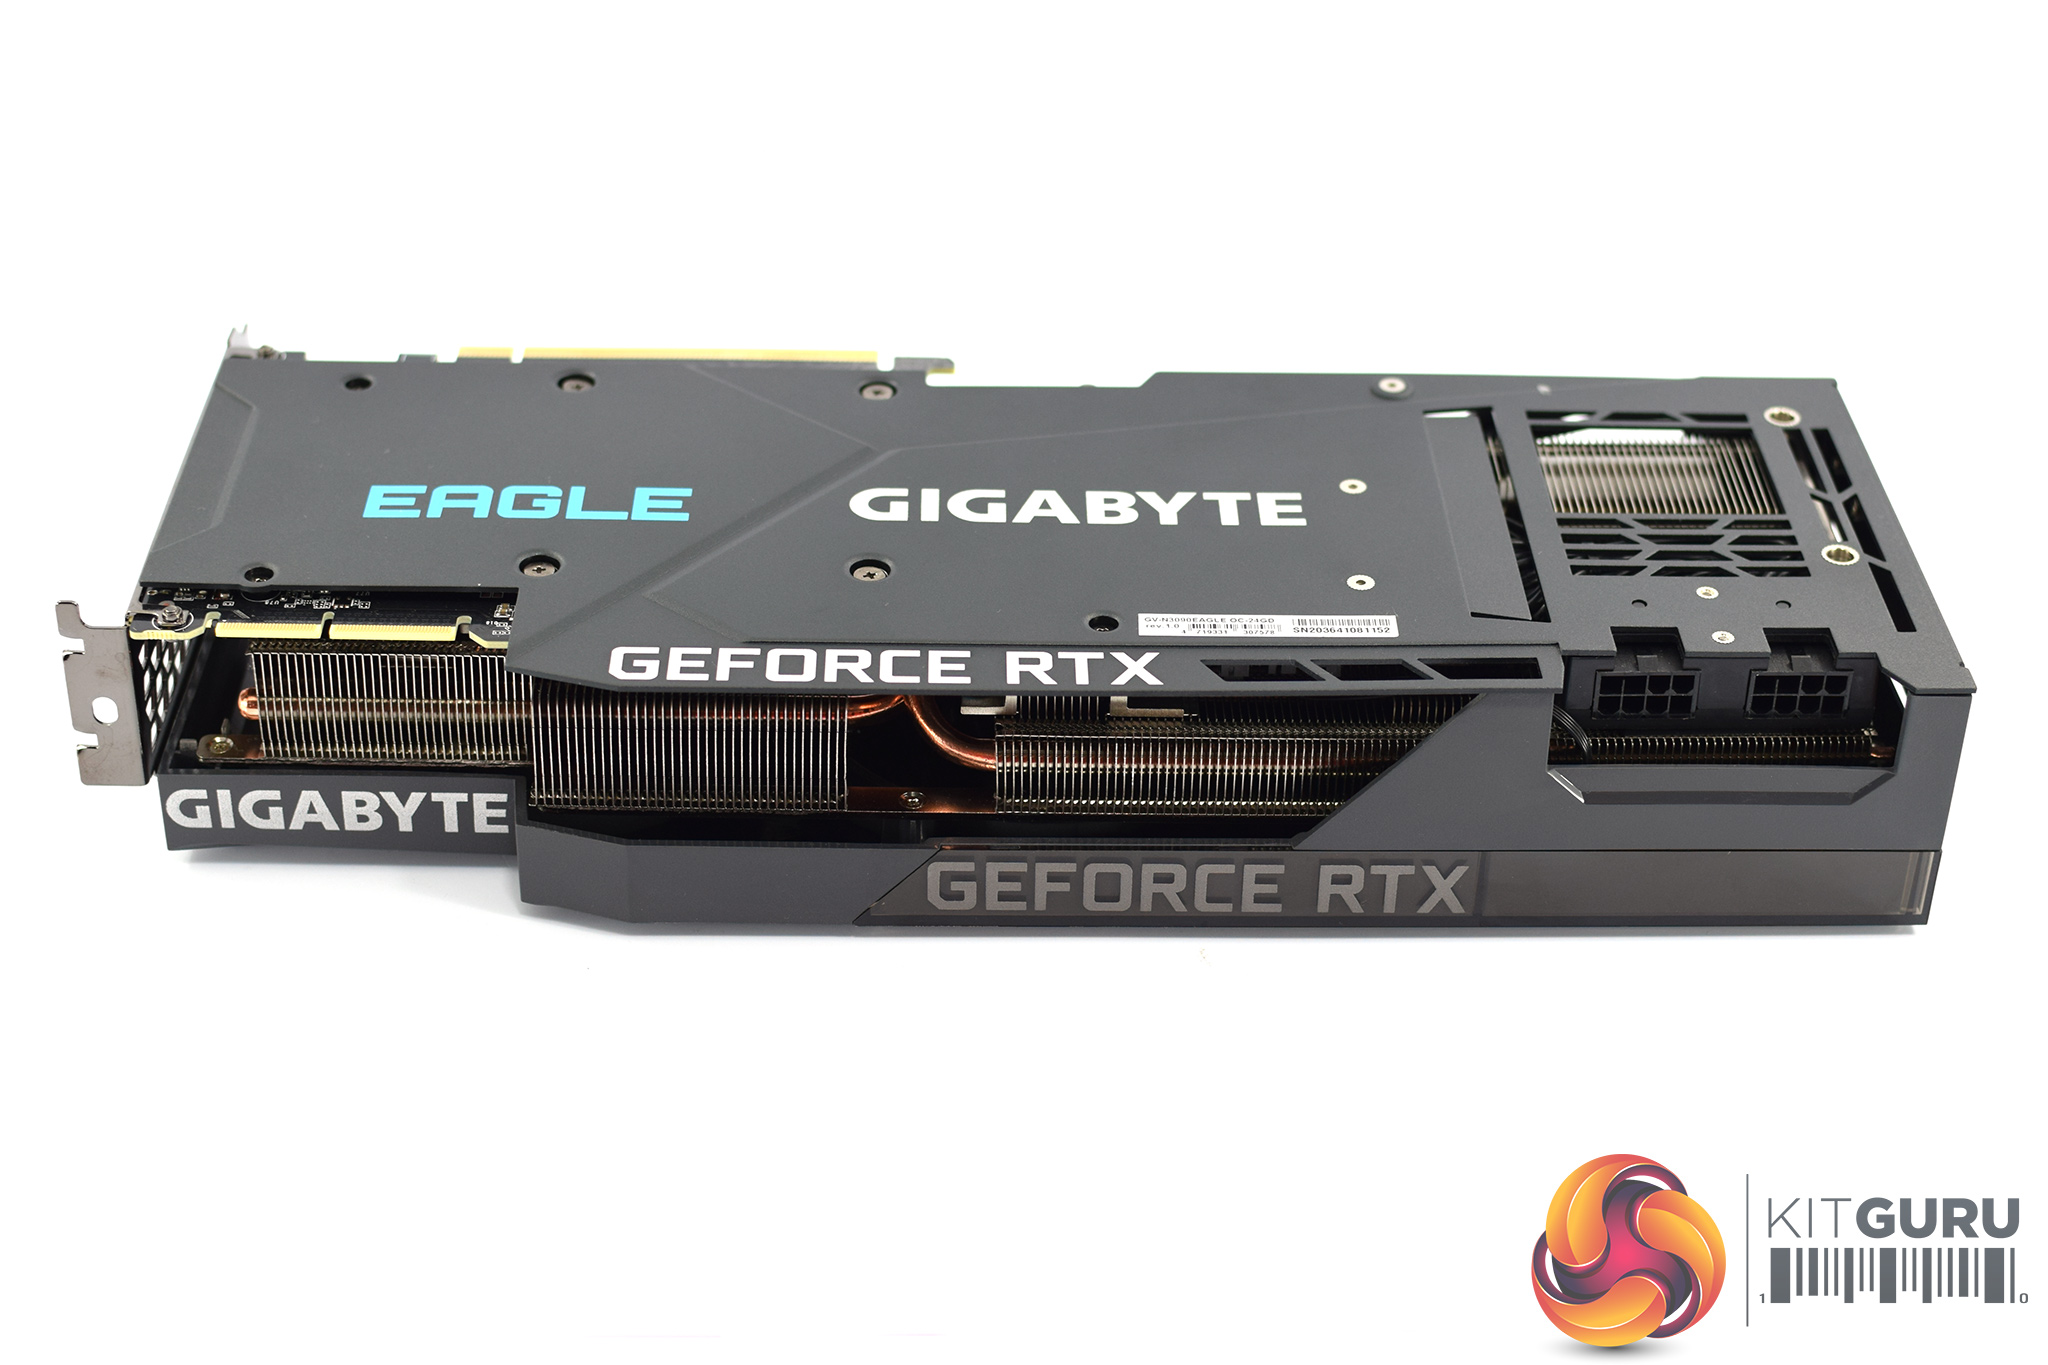
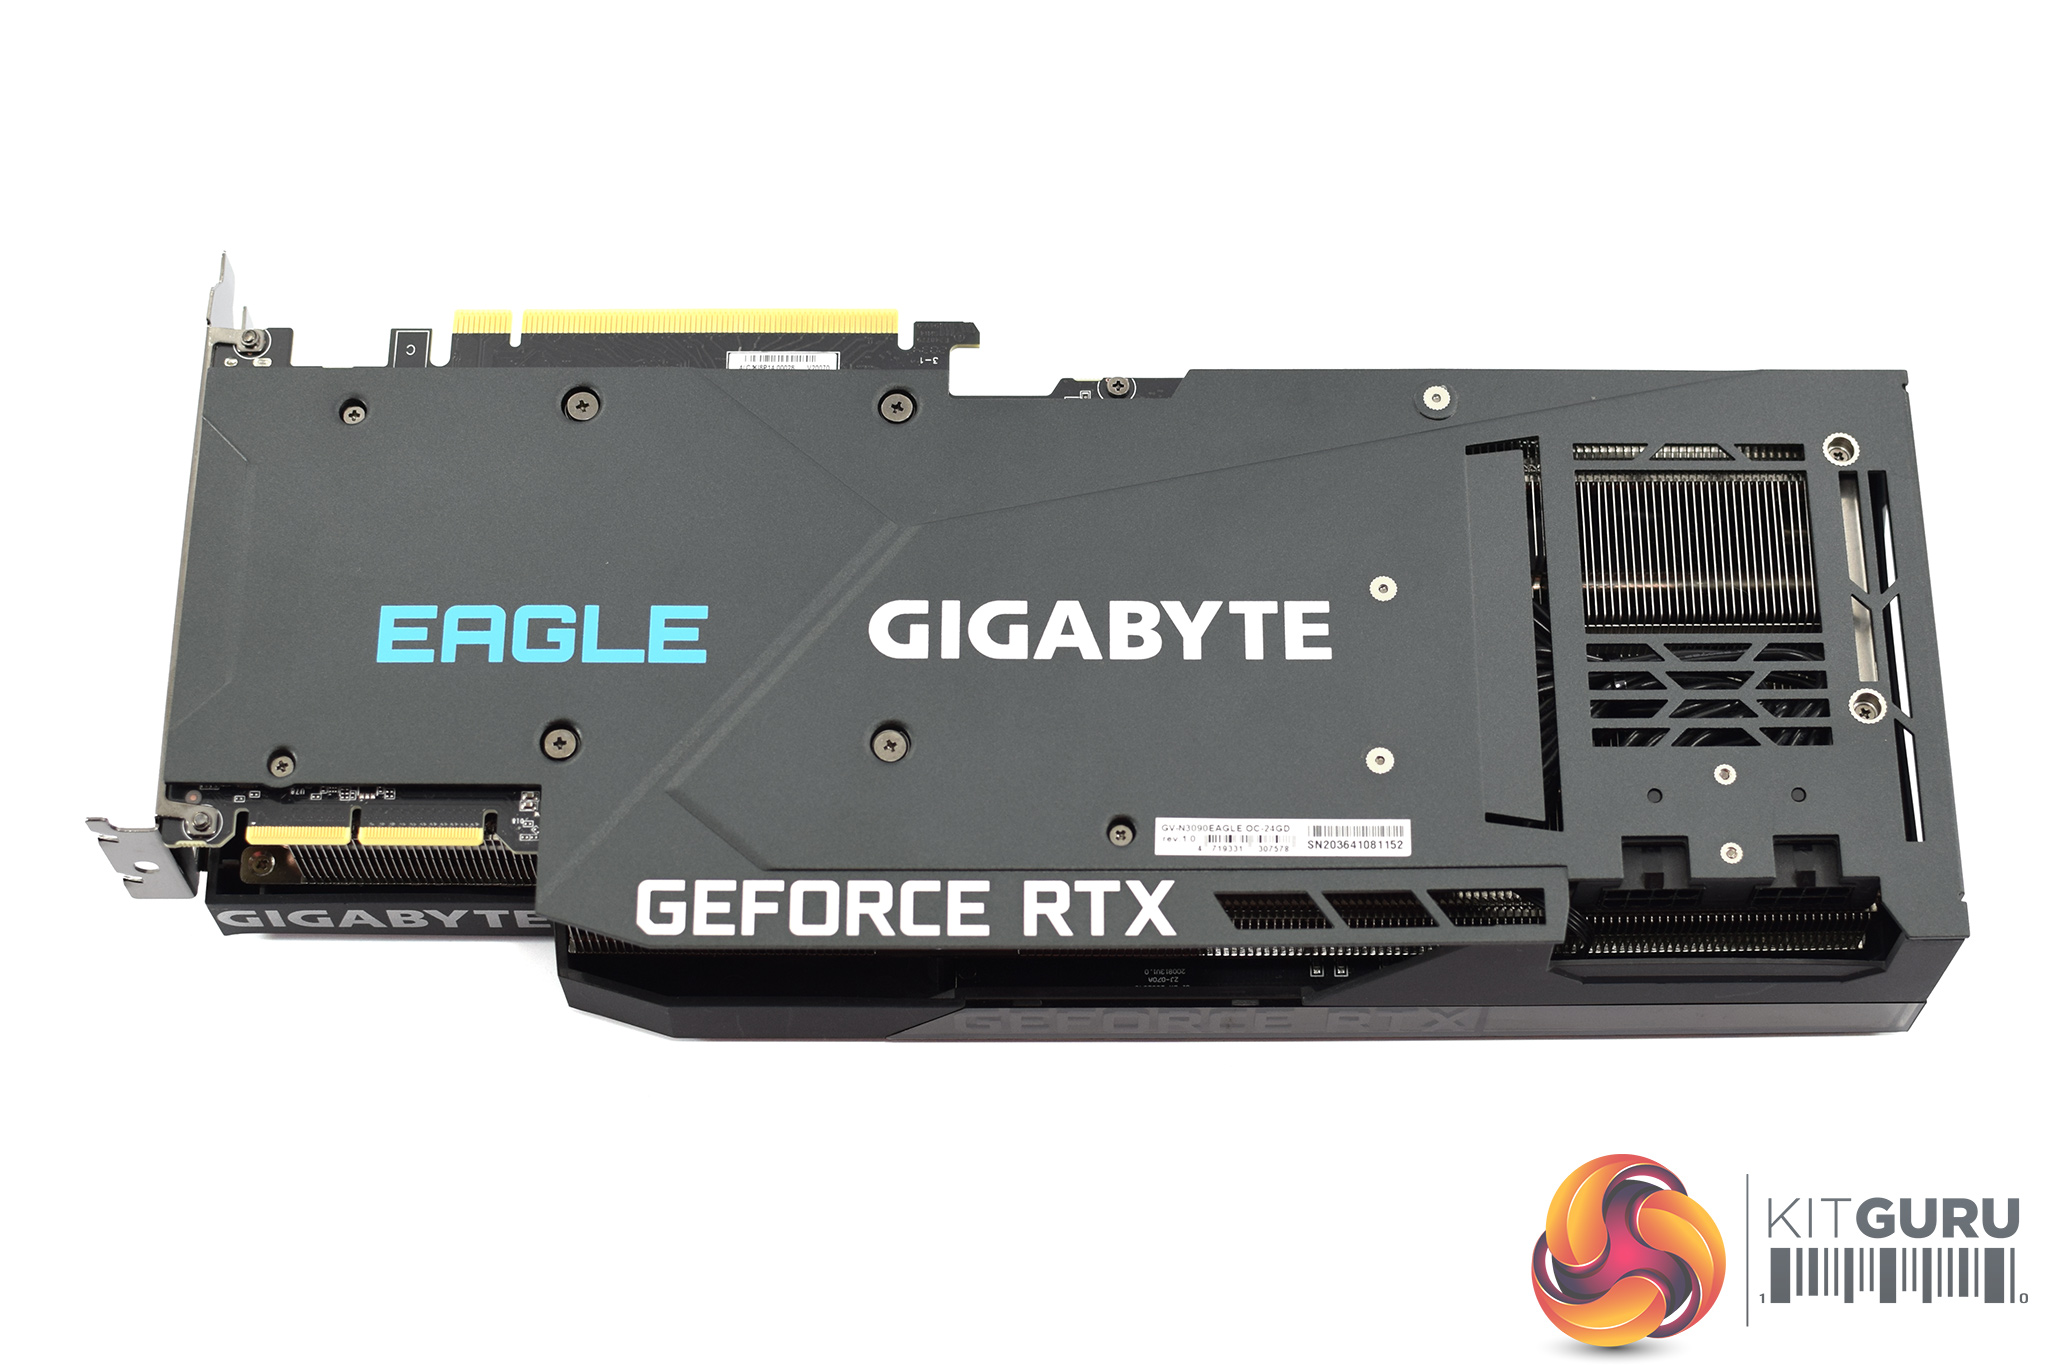
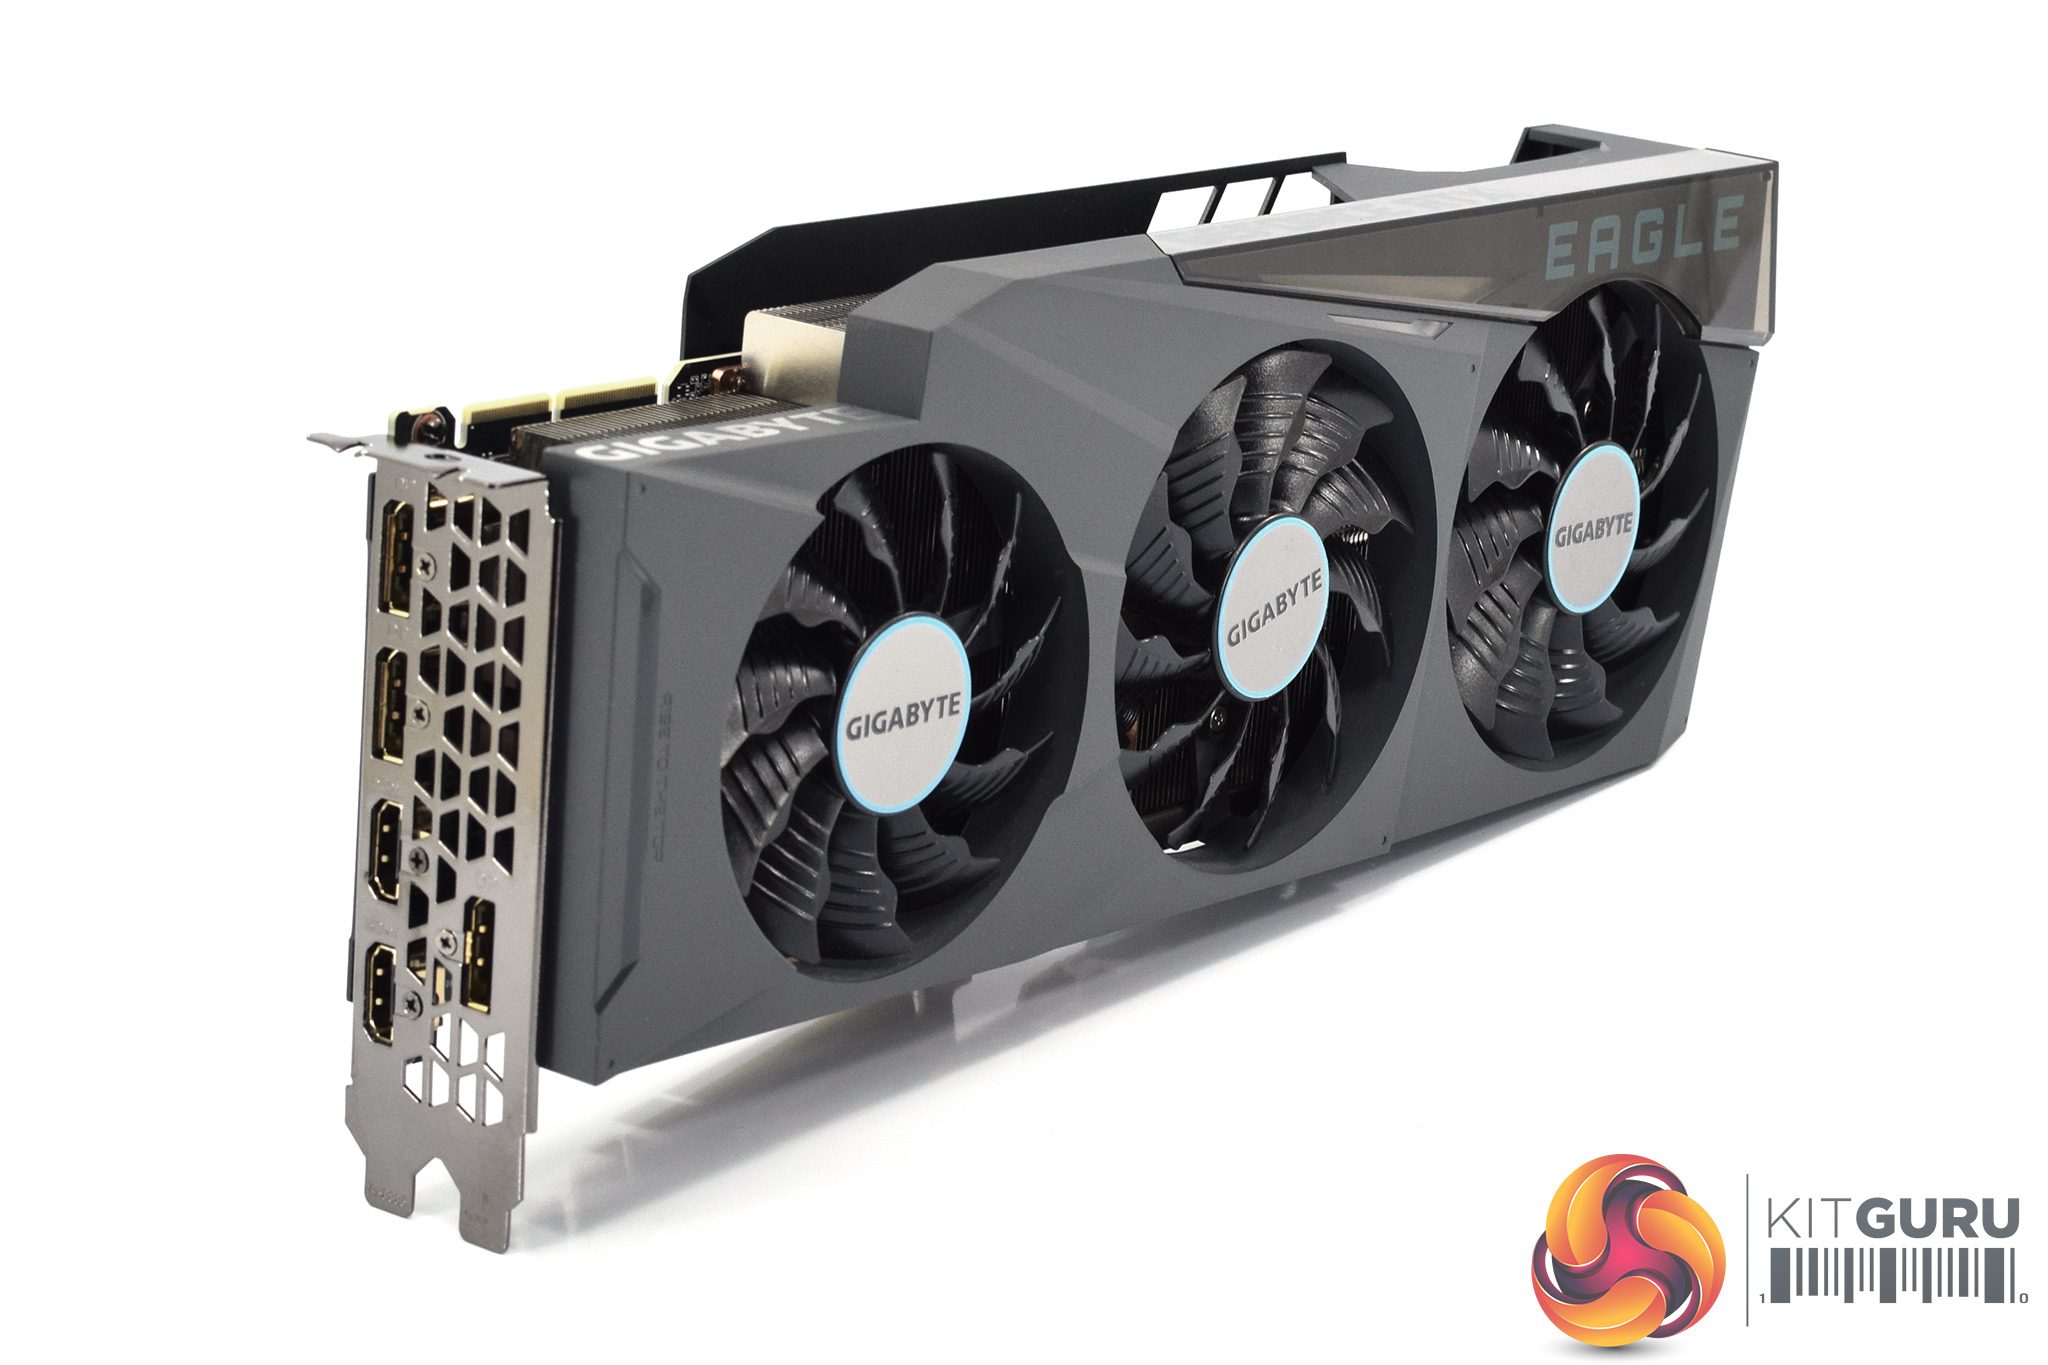
The front side of the card's shroud is home to the Gigabyte and GeForce RTX logos, and these can also be found on the full-length metal backplate, with an additional Eagle logo printed in blue. Additionally, we can get a look at the two small NVLink fingers positioned next to the I/O bracket. RTX 3090 is the only Ampere GPU with SLI support.
We can also see a large cut-out in the backplate at the end of the card, allowing air to pass directly through the heatsink and out of the back of the card into your chassis.
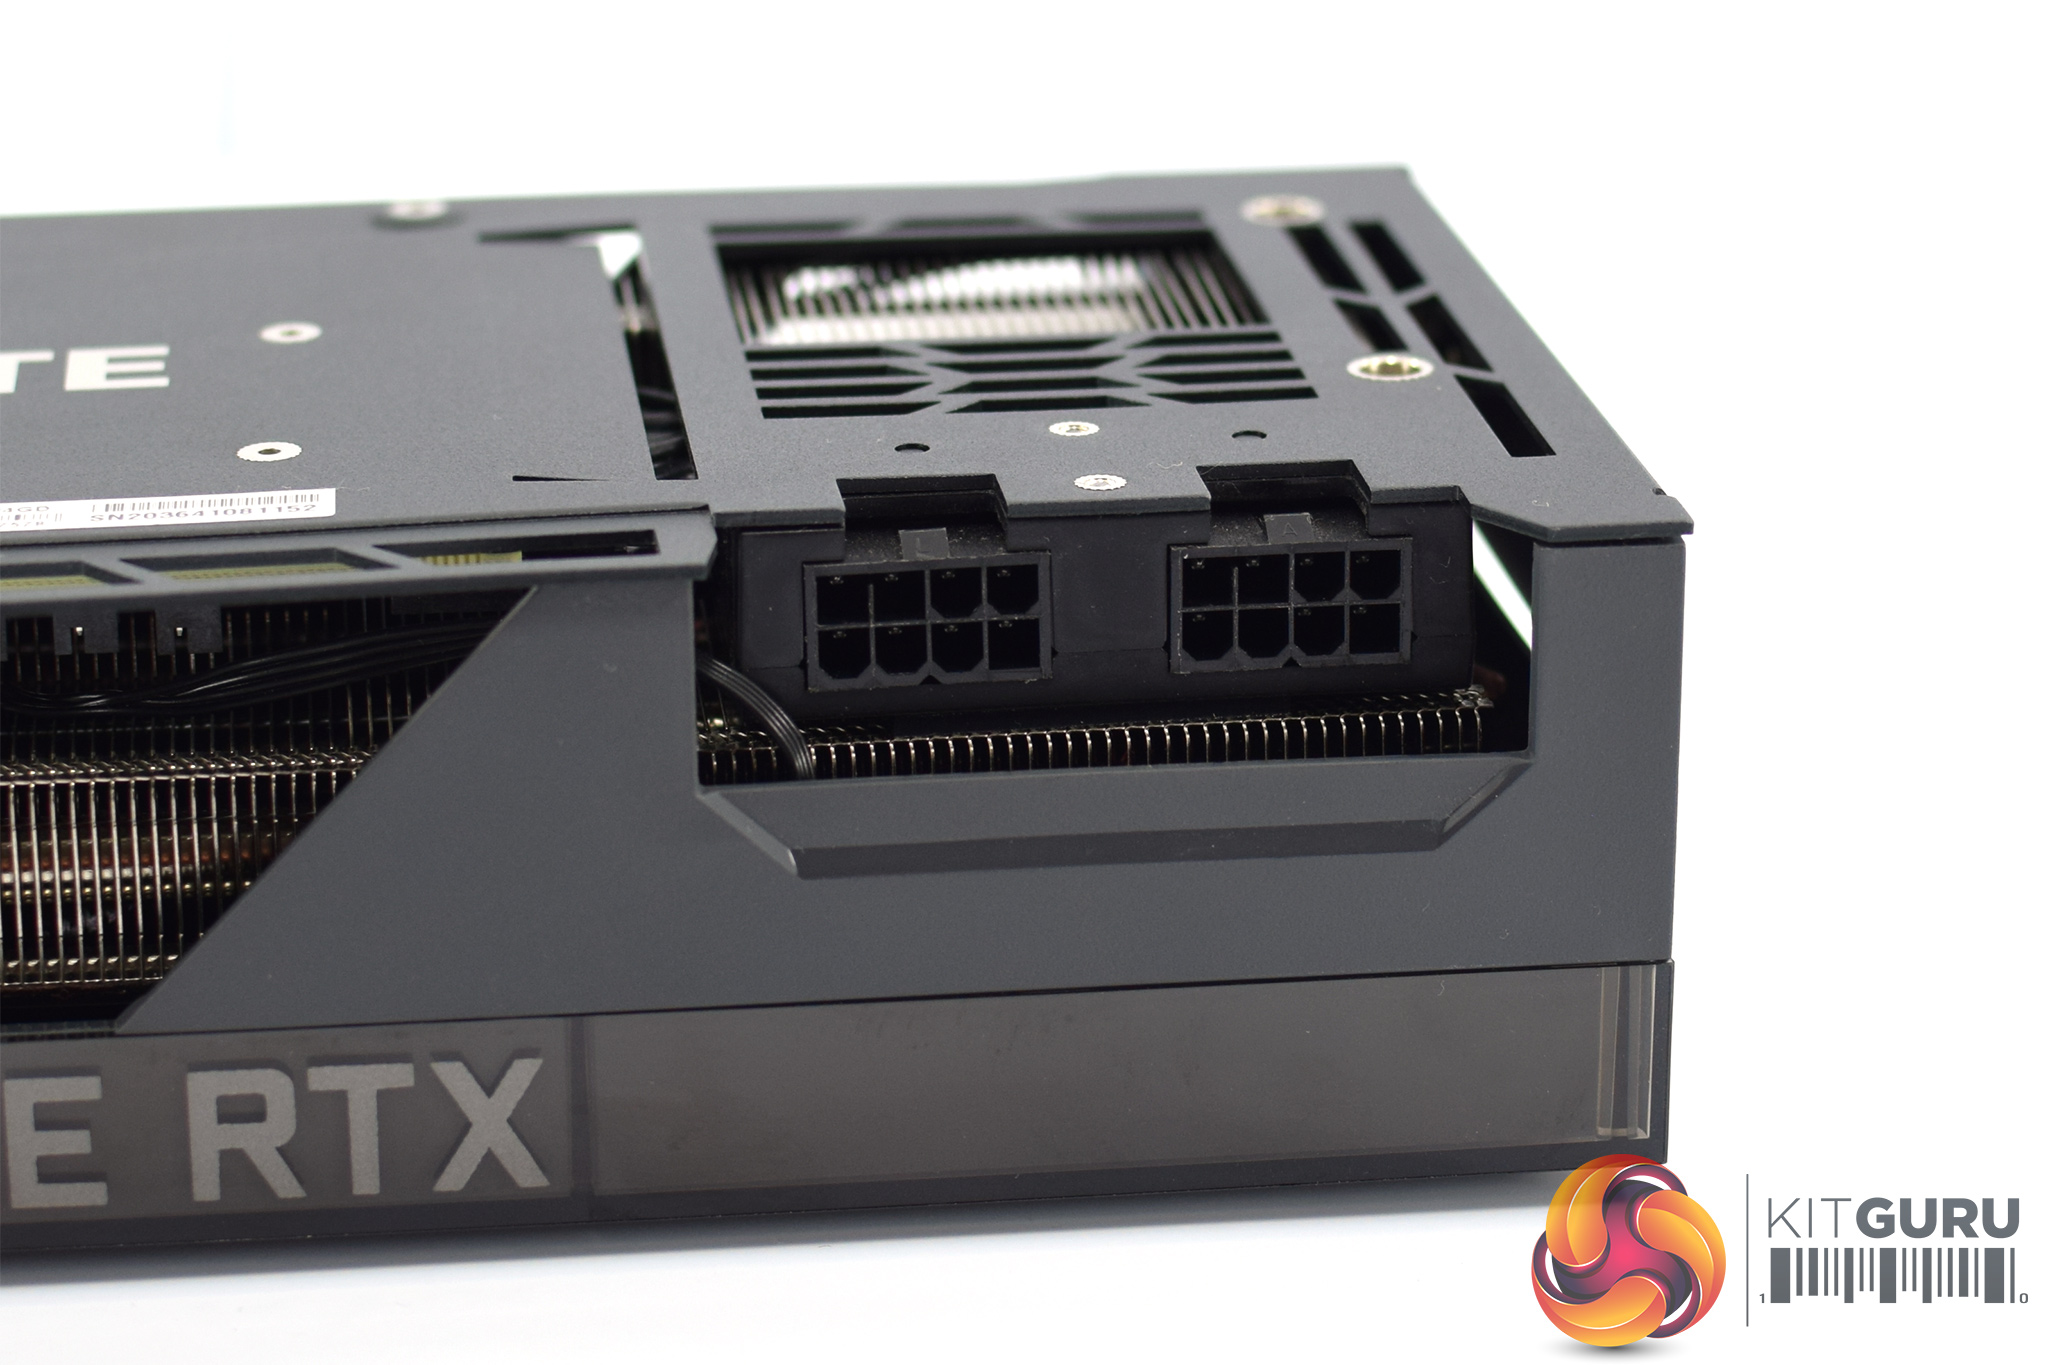
Despite a rated TGP of 350W, Gigabyte has stuck with 2x 8-pin power connectors for the RTX 3090 Eagle OC. These can each provide 150W, while another 75W from the PCIe slot gives about 25W headroom for the card.
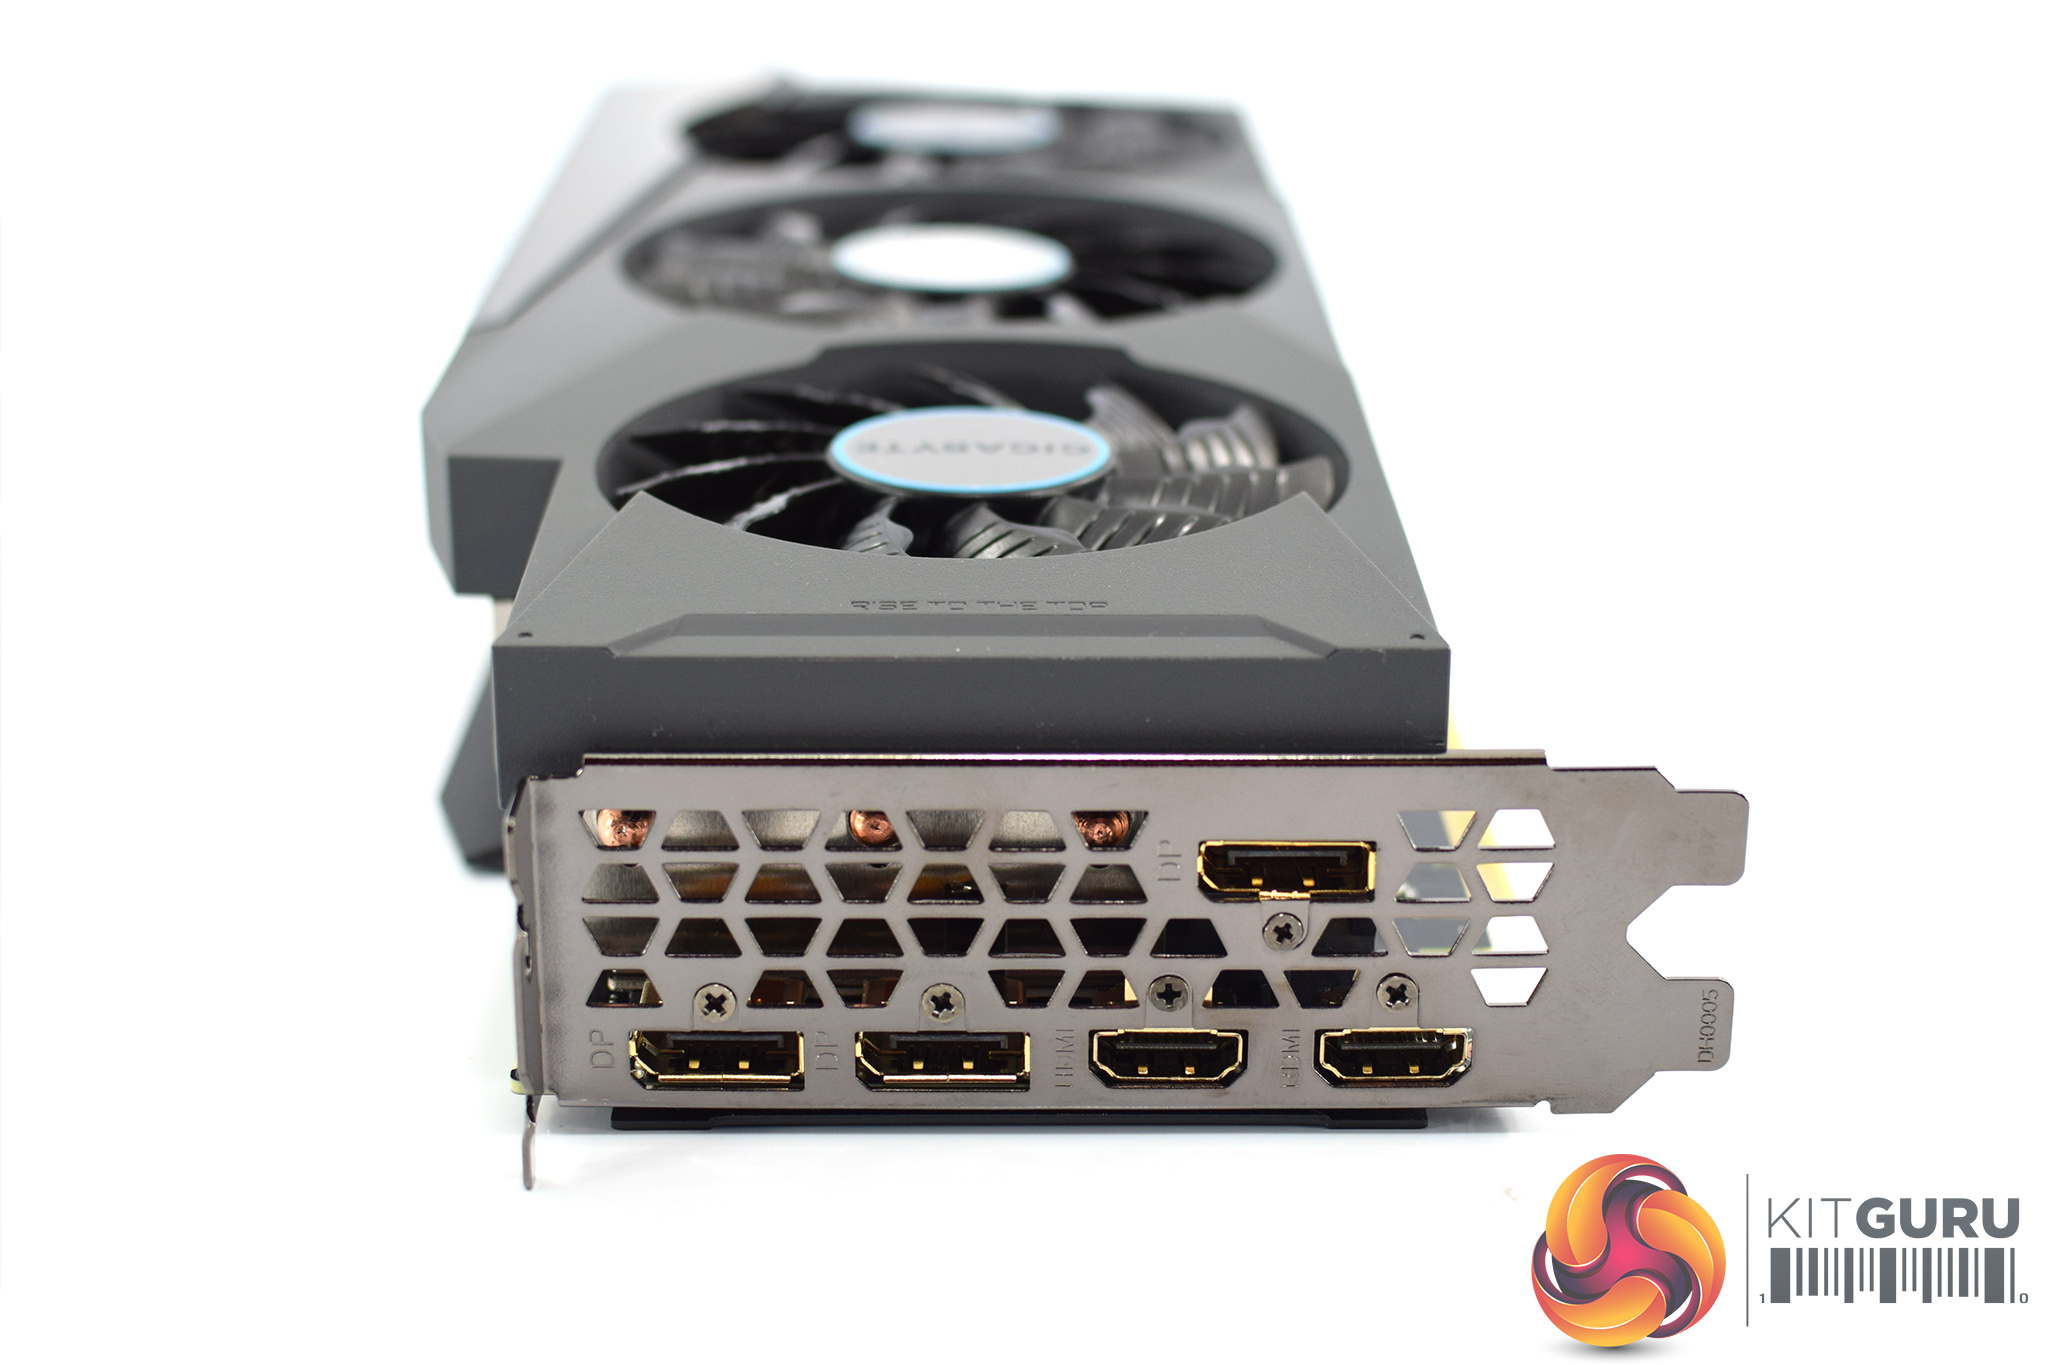
As for display outputs, the Eagle OC features three DisplayPort 1.4a connectors and two HDMI 2.1 ports.
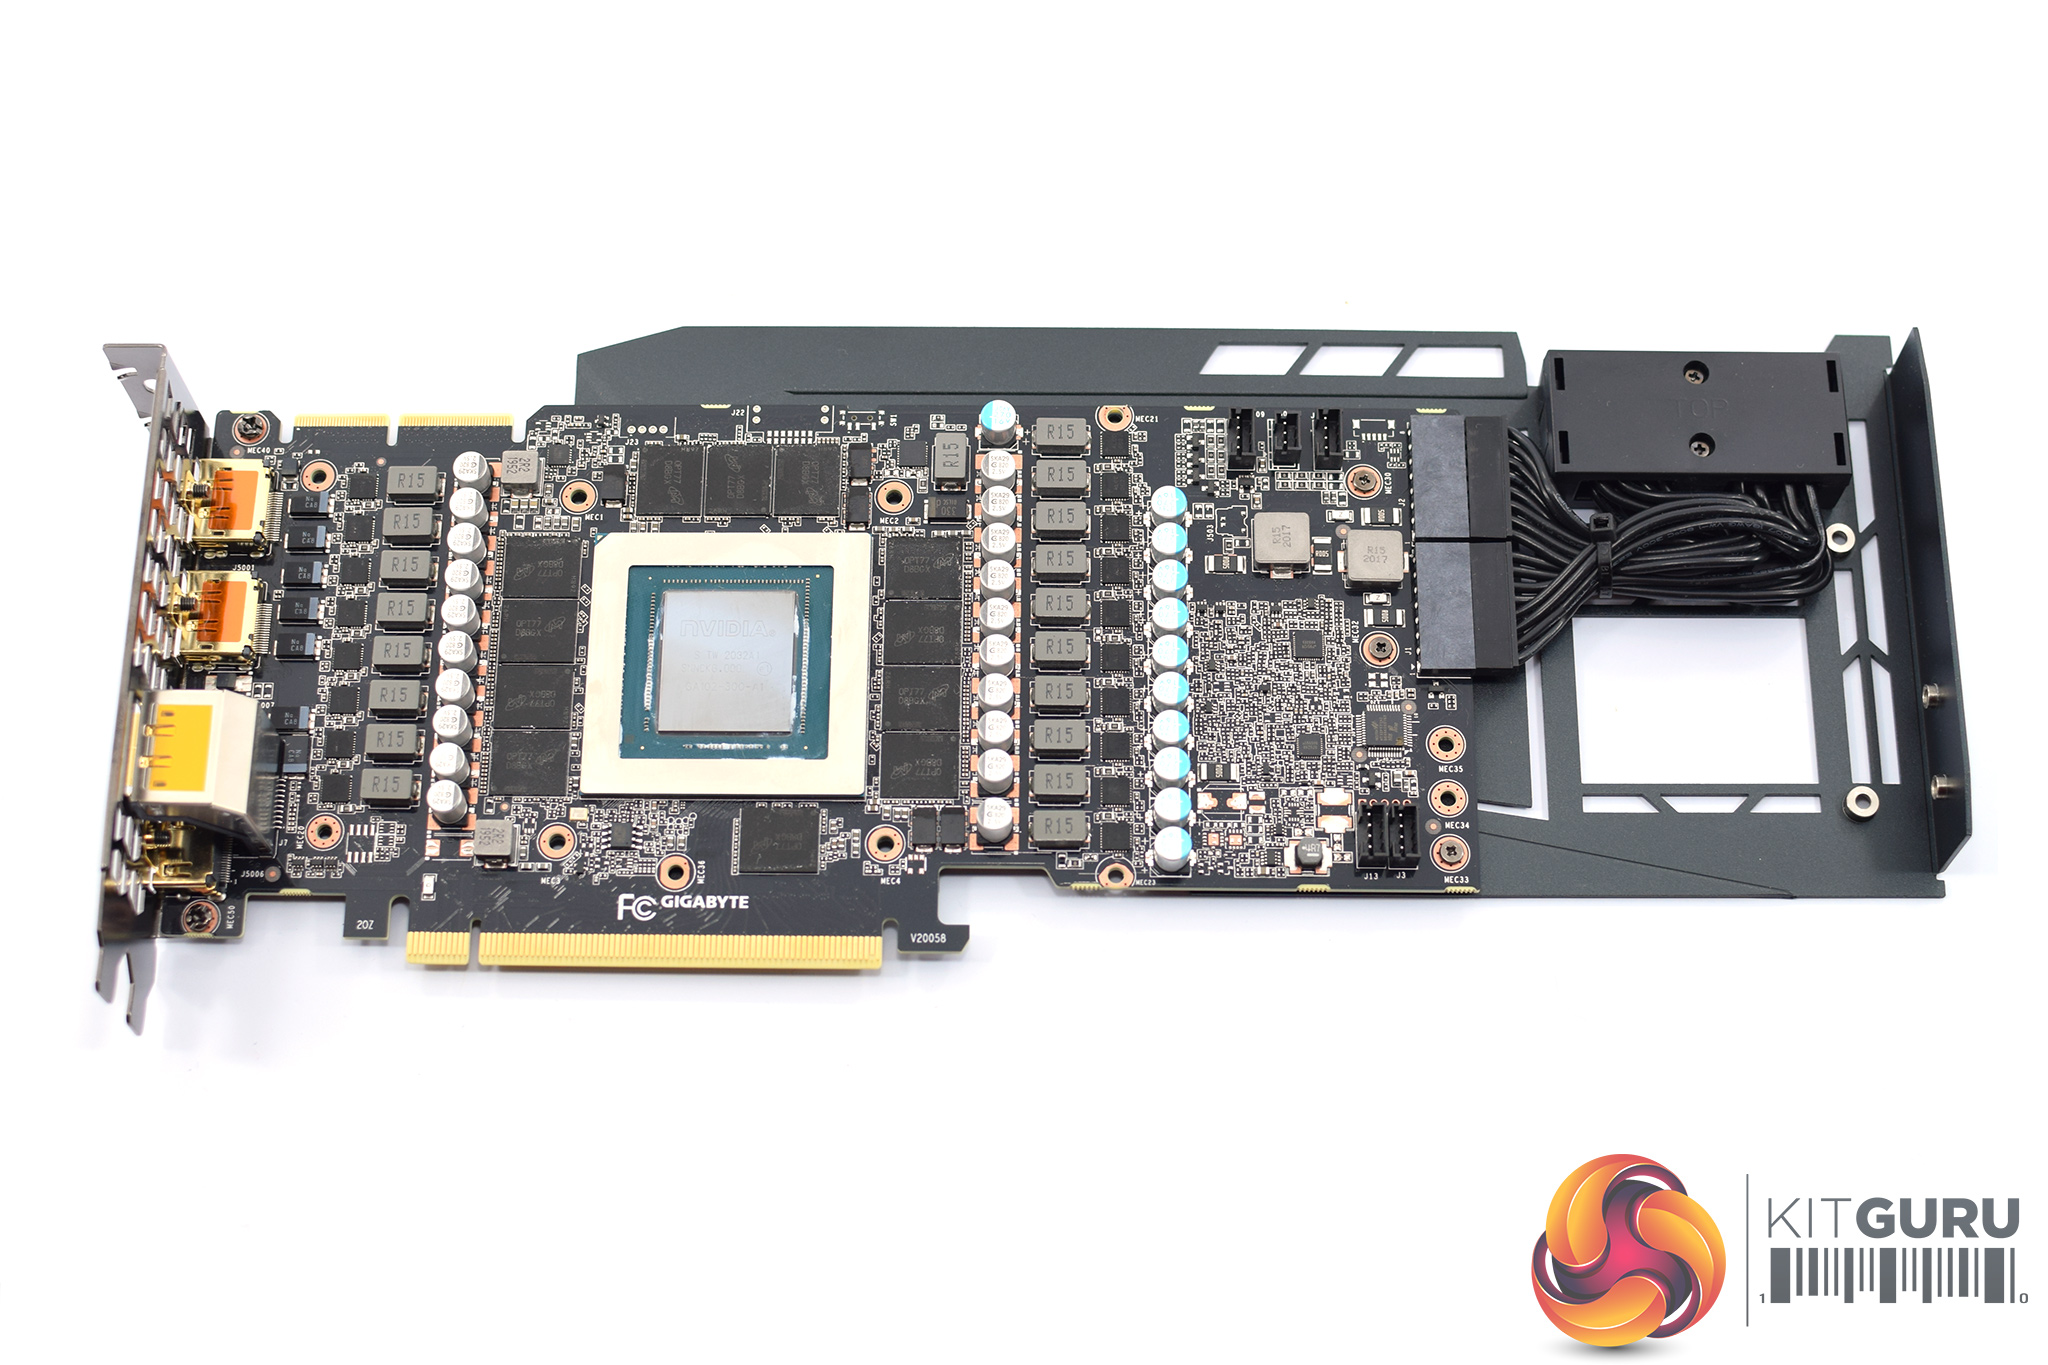
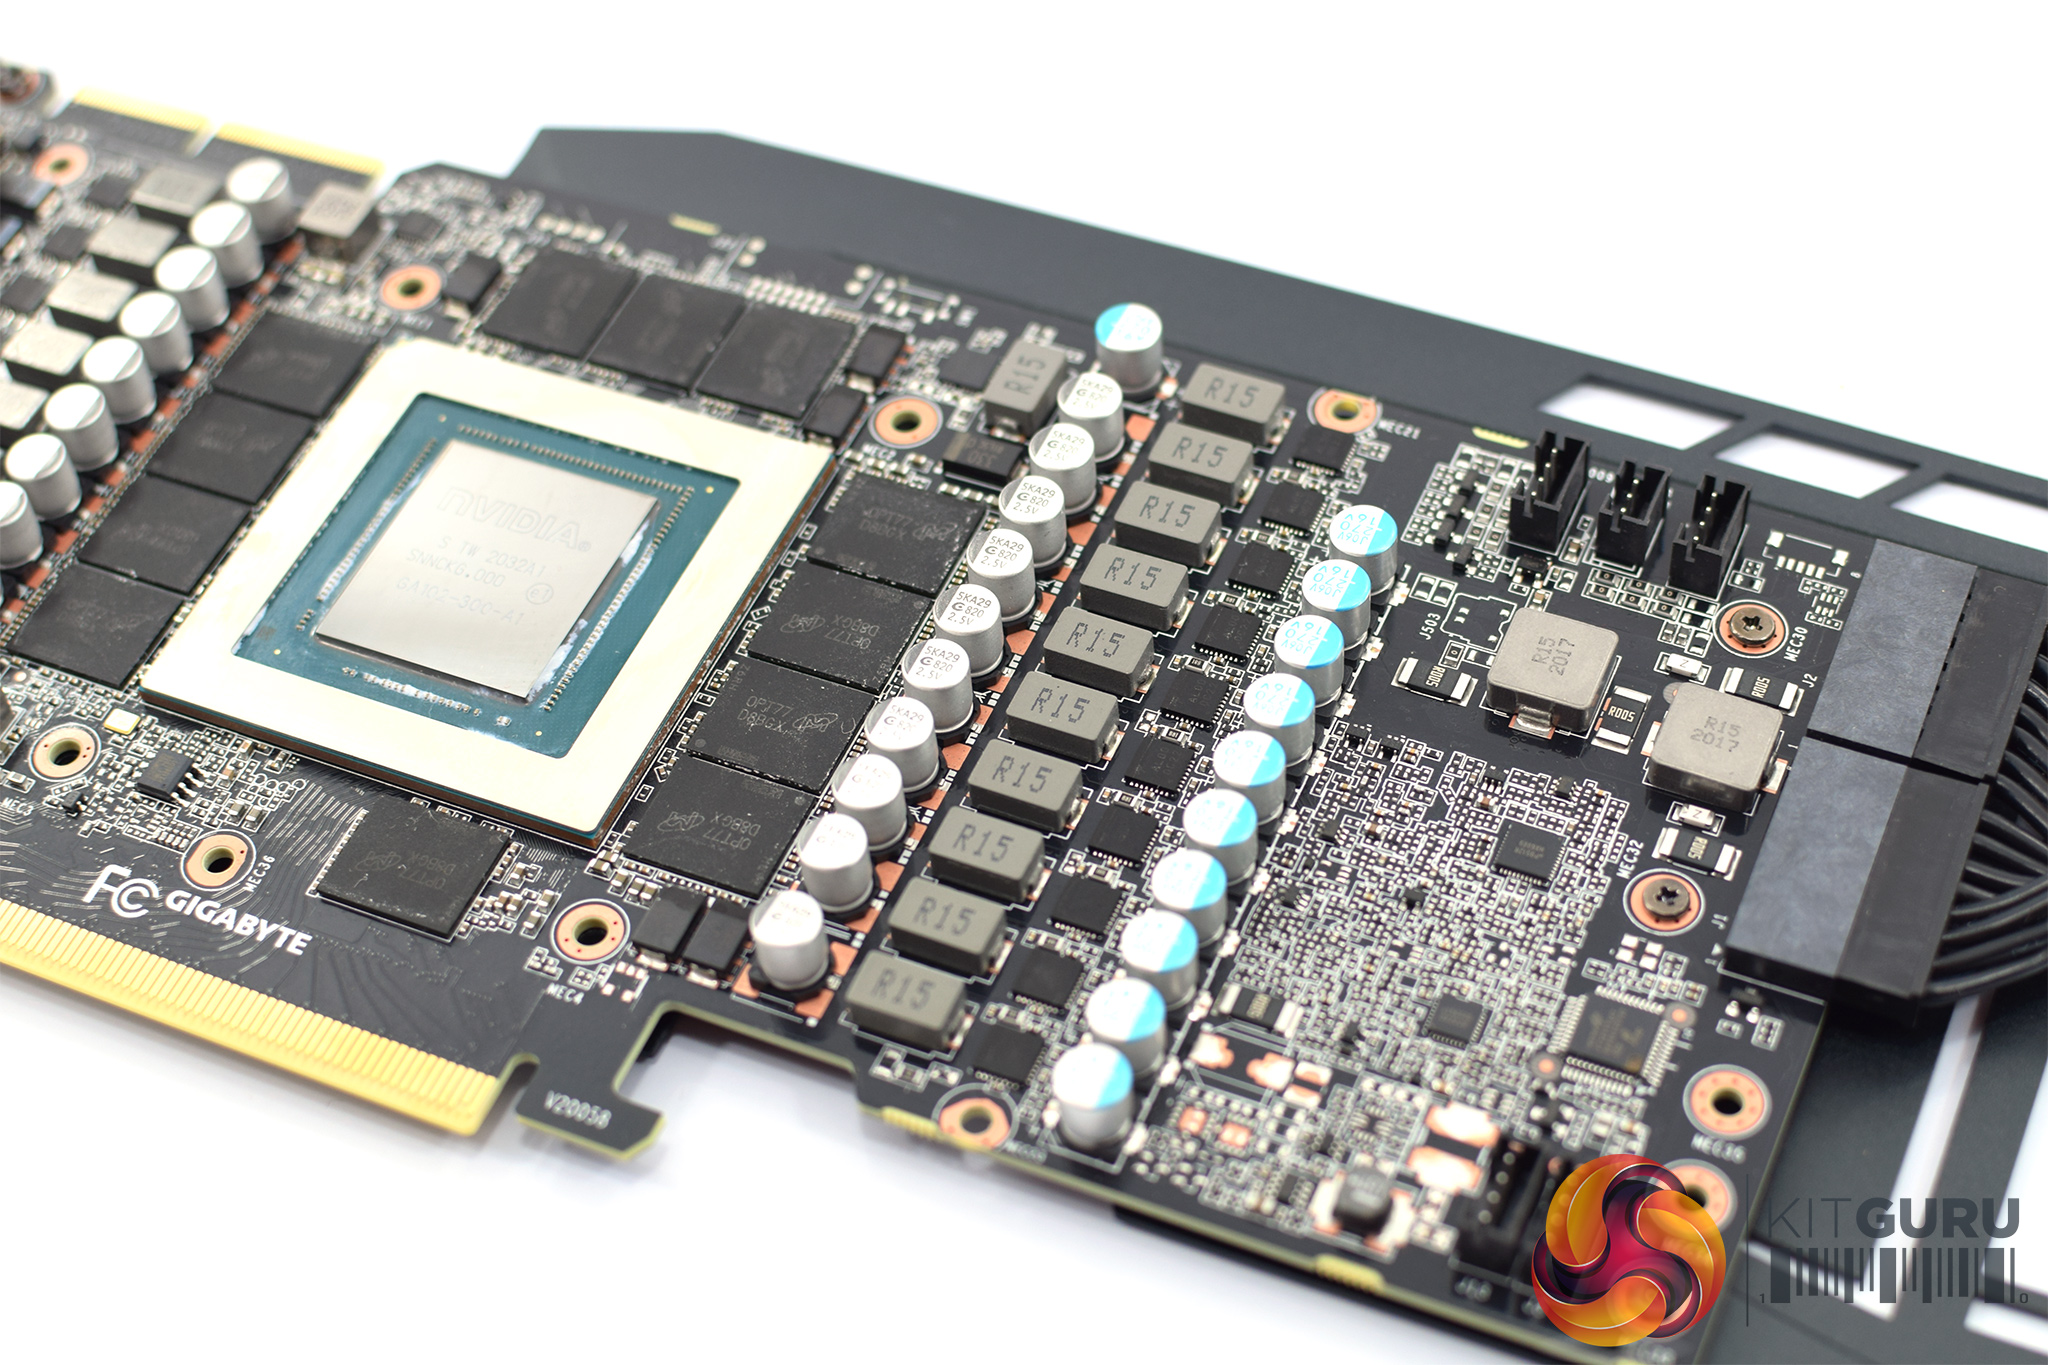
In terms of its PCB, here we can note some differences compared to the RTX 3080 Eagle OC. The overall design is the same, but the power delivery has been beefed up to a 15+4 configuration. The RTX 3080 Eagle OC uses a 13+4 VRM.
Gigabyte is still using power extensions for the 8-pin PCIe connectors, as these are not directly soldered onto the PCB.
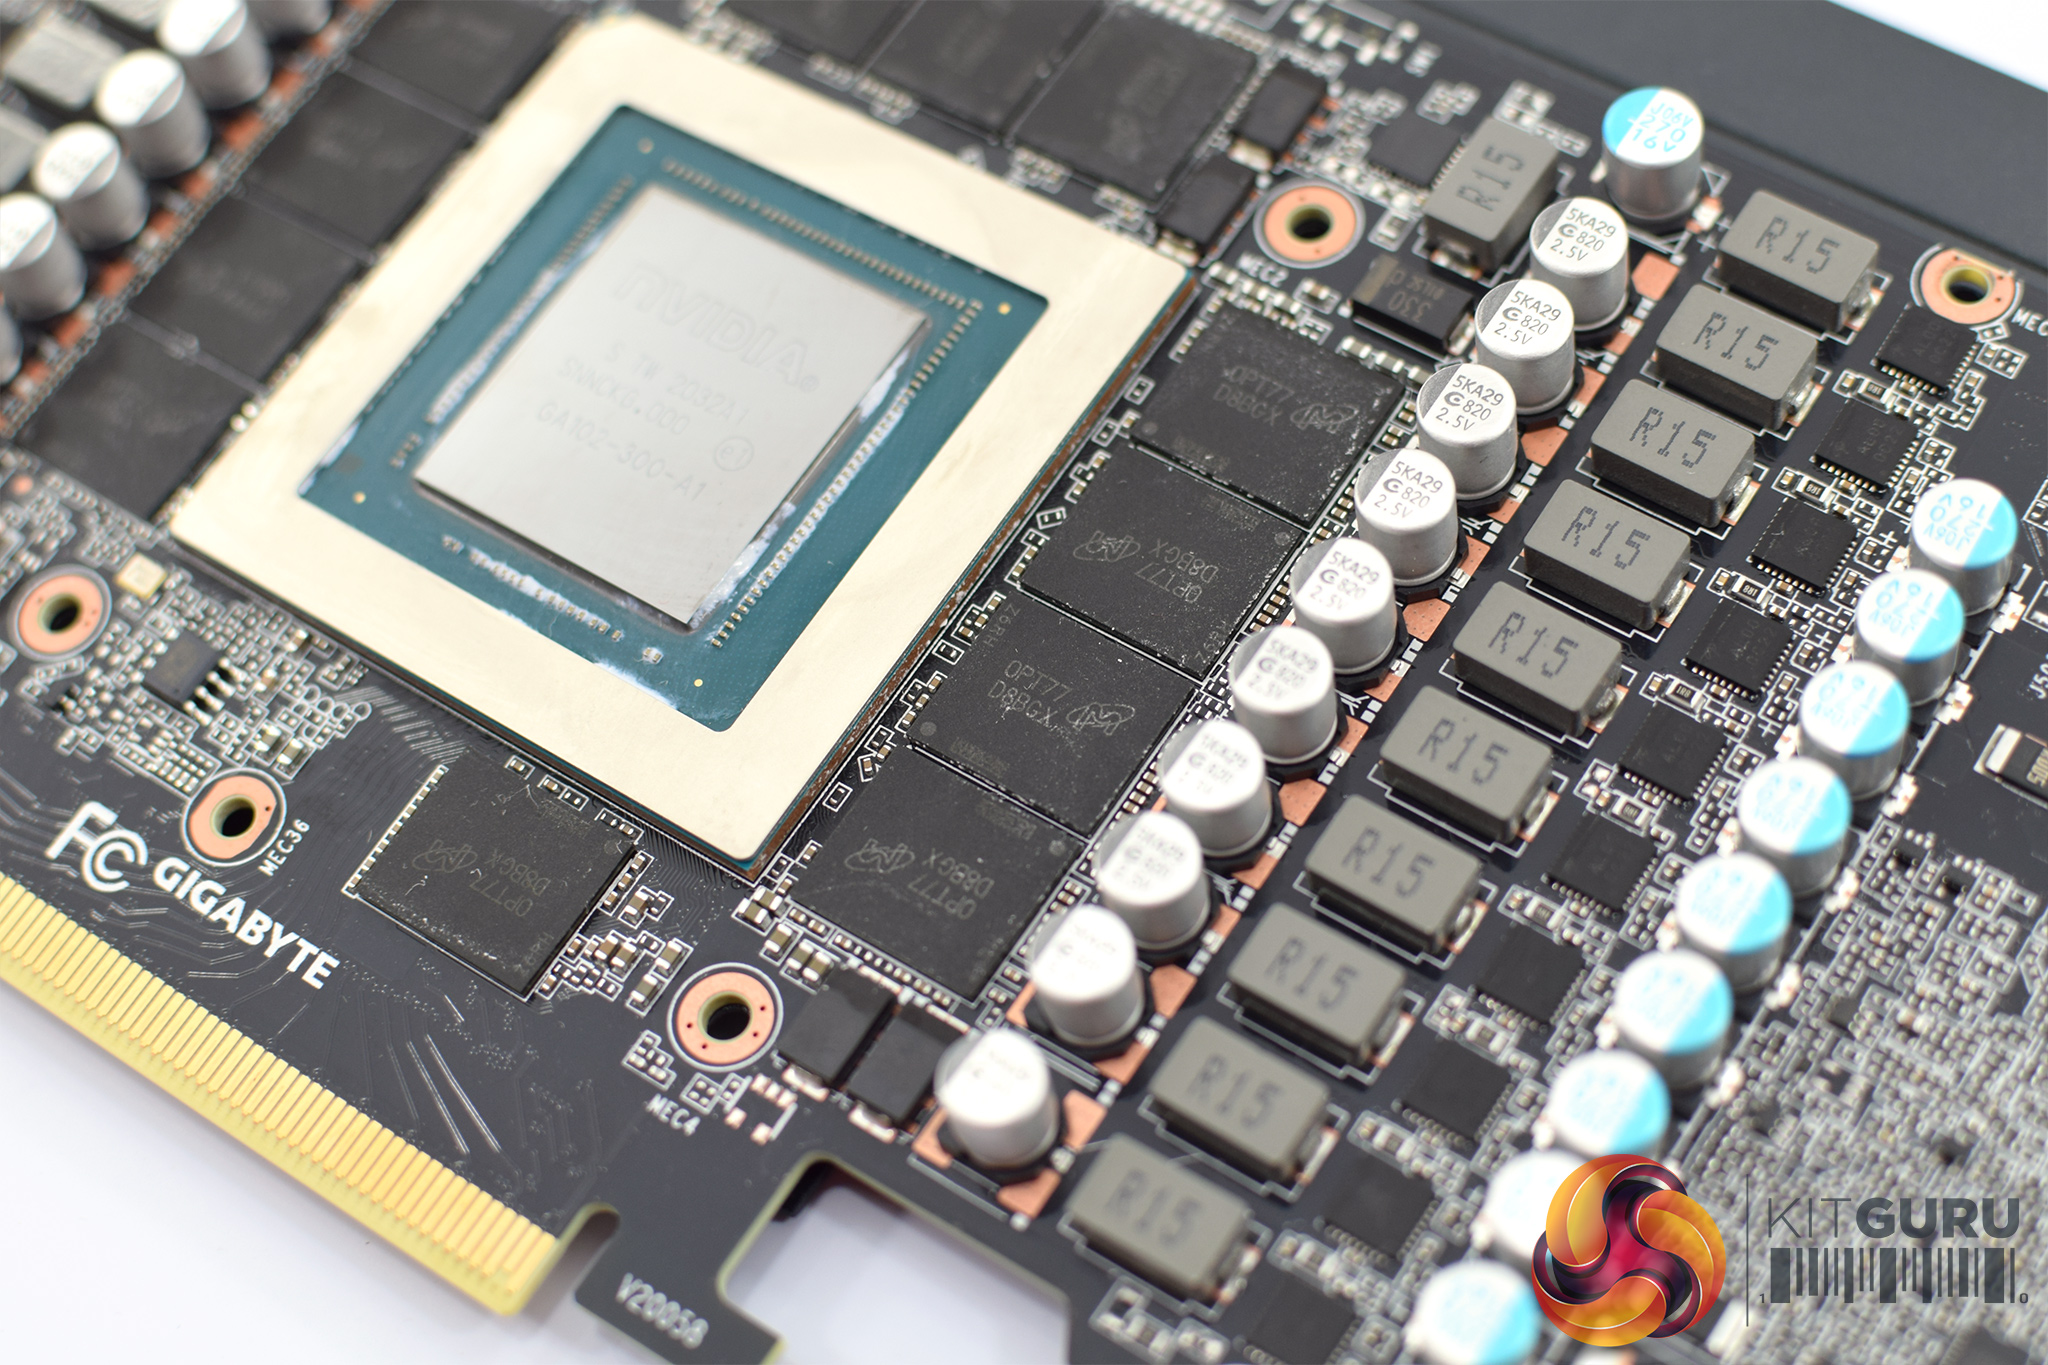
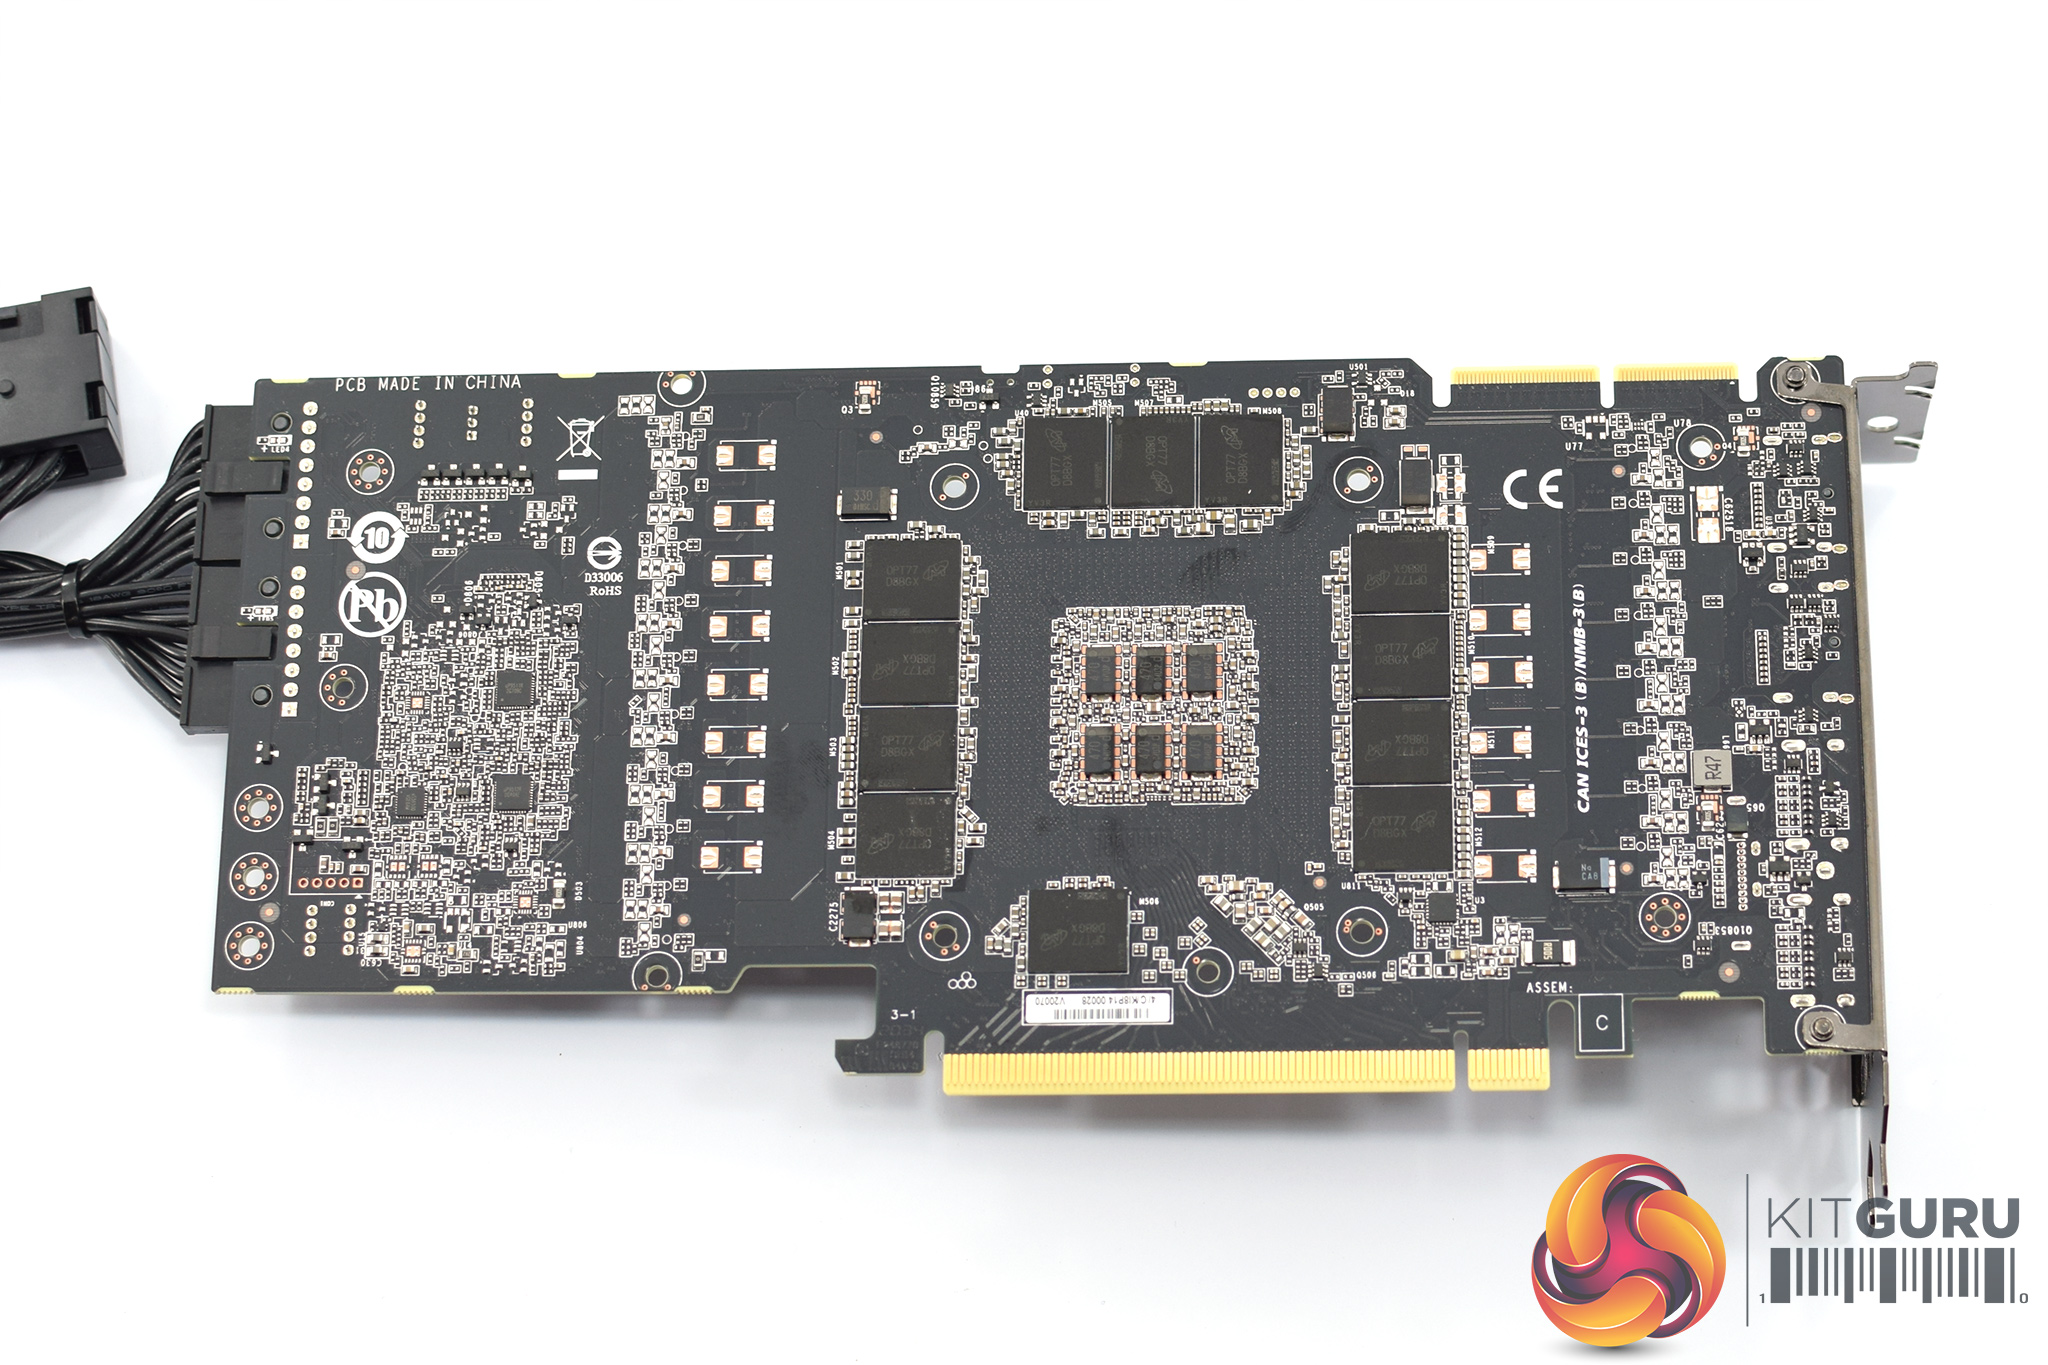
As for the memory, given the RTX 3090 sports 24GB GDDR6X, manufacturers needed to find space for 24 memory modules, so we have 12 on either side of the PCB. These are of course from Micron, and each module is labelled D8BGX – meaning 19.5Gbps memory.
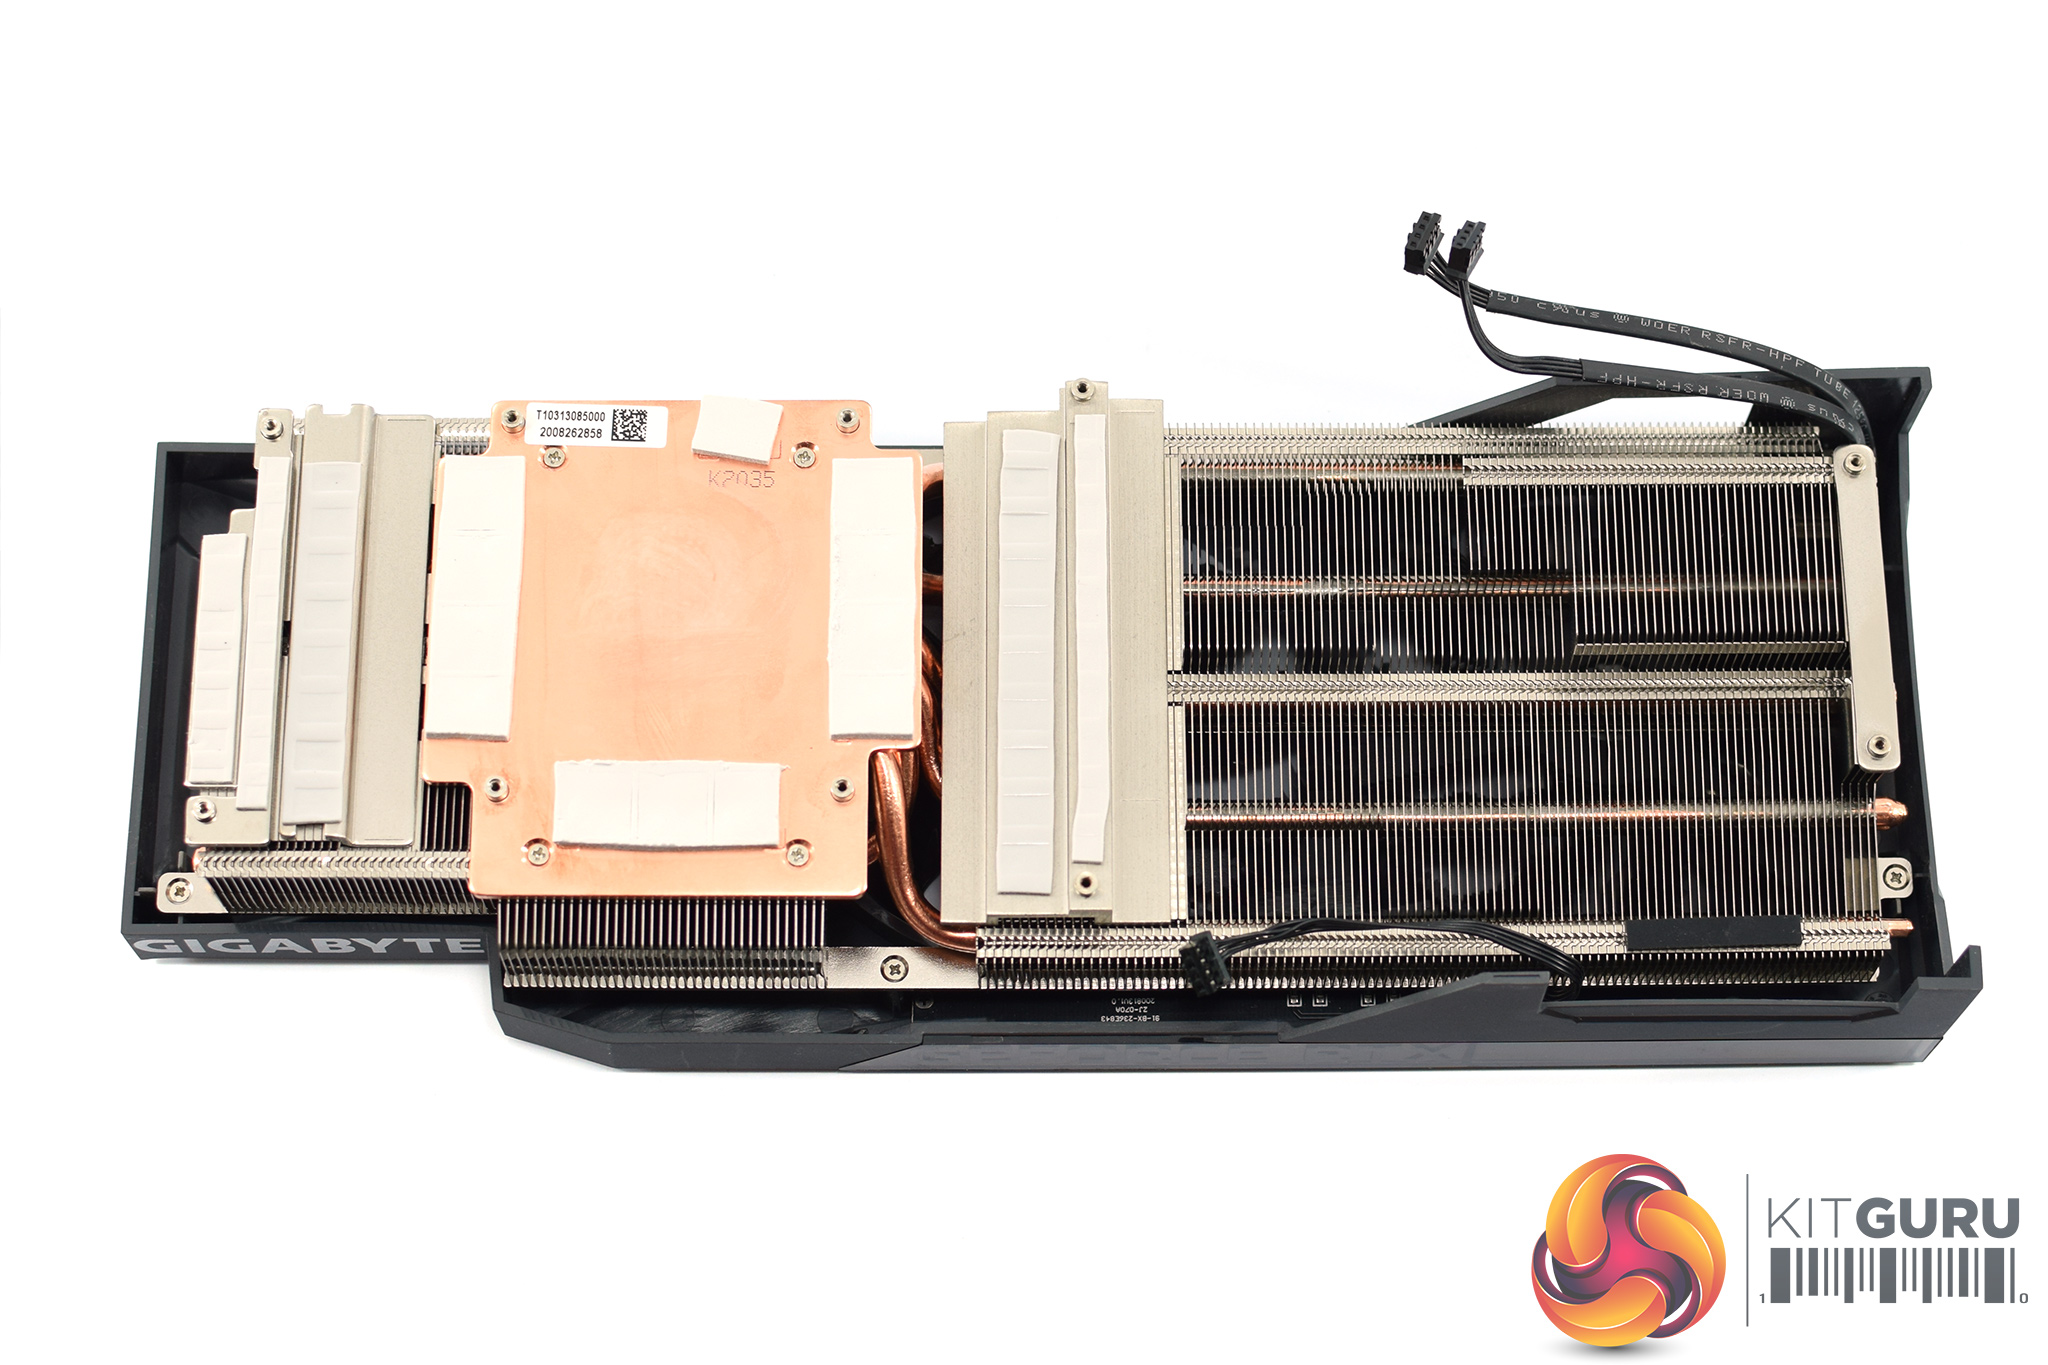
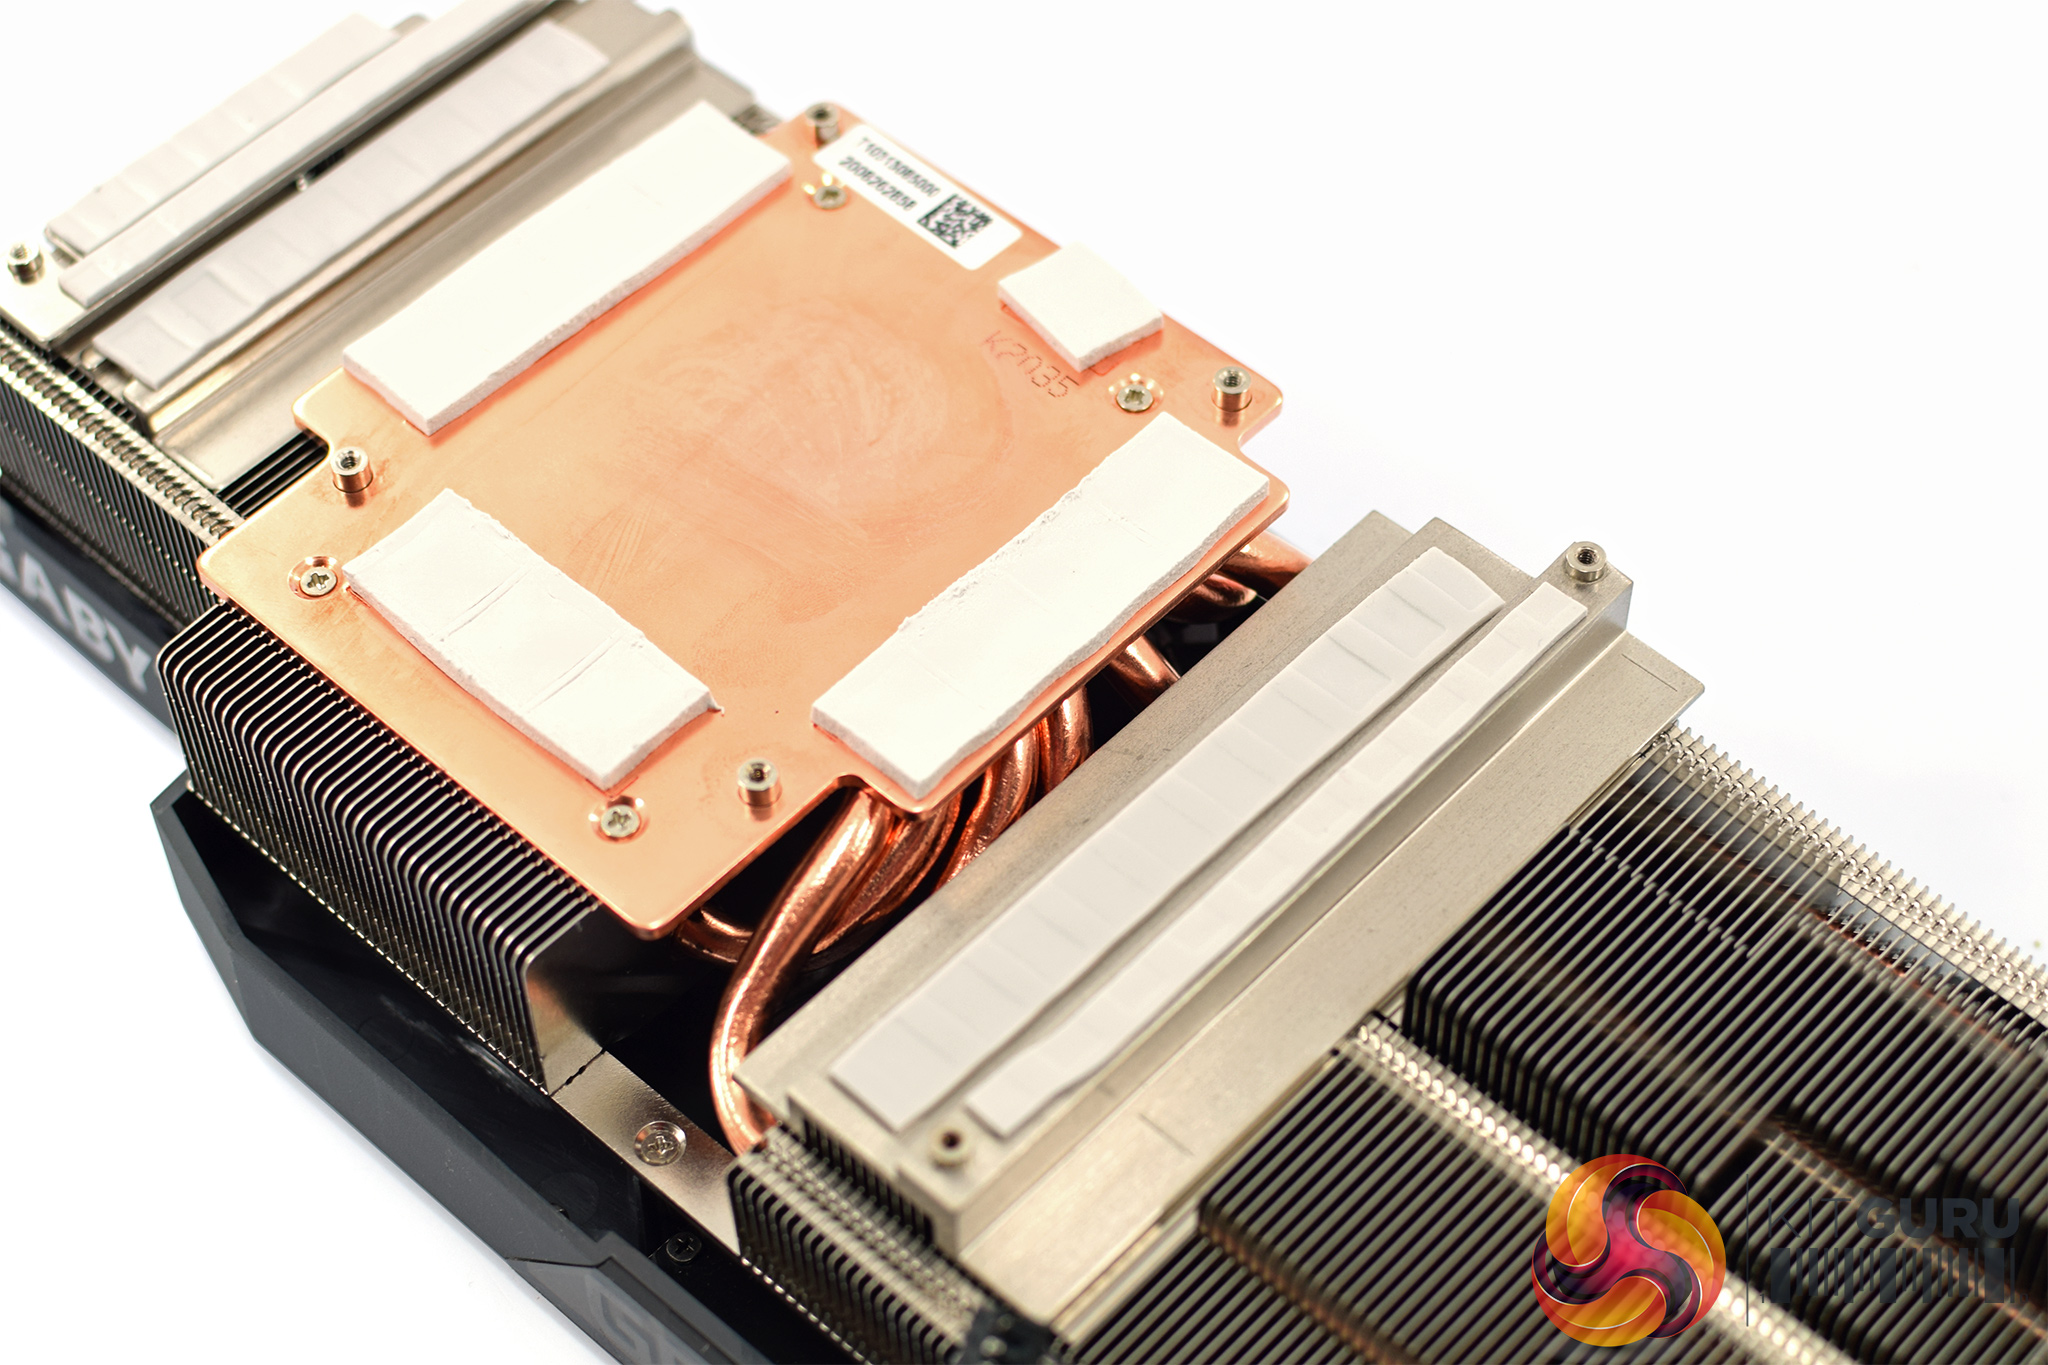
Lastly, the Eagle OC's cooler is unchanged compared to the RTX 3080 model. That means it uses two fin stacks, with a total of 7x 6mm copper heatpipes. The GPU contacts directly with a copper plate, as do the memory modules (via thermal pads). Smaller plates are also used to contact with the VRM and MOSFETs, again via thermal pads.
Driver Notes
- All Nvidia GPUs (except RTX 3000) were benchmarked with the 452.06 driver.
- RTX 3080 was benchmarked with the 456.16 driver supplied to press.
- RTX 3090 was benchmarked with 456.38 public driver.
- All AMD GPUs were benchmarked with the Adrenalin 20.8.2 driver.
Test System
We test using the a custom built system from PCSpecialist, based on Intel's latest Comet Lake-S platform. You can read more about it over HERE, and configure your own system from PCSpecialist HERE.
| CPU |
Intel Core i9-10900K
Overclocked to 5.1GHz on all cores |
| Motherboard |
ASUS ROG Maximus XII Hero Wi-Fi
|
| Memory |
Corsair Vengeance DDR4 3600MHz (4 X 8GB)
CL 18-22-22-42
|
| Graphics Card |
Varies
|
| System Drive |
500GB Samsung 970 Evo Plus M.2
|
| Games Drive | 2TB Samsung 860 QVO 2.5″ SSD |
| Chassis | Fractal Meshify S2 Blackout Tempered Glass |
| CPU Cooler |
Corsair H115i RGB Platinum Hydro Series
|
| Power Supply |
Corsair 1200W HX Series Modular 80 Plus Platinum
|
| Operating System |
Windows 10 2004
|
Comparison Graphics Cards List
- ASUS RTX 3080 TUF Gaming OC 10GB
- Gigabyte RTX 3080 Eagle OC 10GB
- MSI RTX 3080 Gaming X Trio 10GB
- Nvidia RTX 3080 FE 10GB
- Nvidia RTX 2080 Ti FE 11GB
- Nvidia RTX 2080 Super FE 8GB
- Nvidia RTX 2080 FE 8GB
- Nvidia RTX 2070 Super FE 8GB
- MSI RTX 2070 Armor 8GB
- Nvidia GTX 1080 Ti FE 11GB
- Gigabyte GTX 1080 G1 Gaming 8GB
- AMD Radeon VII 16GB
- AMD RX 5700 XT 8GB
- AMD RX 5700 8GB
- AMD RX Vega 64 8GB
Software and Games List
- 3DMark Fire Strike & Fire Strike Ultra (DX11 Synthetic)
- 3DMark Time Spy (DX12 Synthetic)
- 3DMark Port Royal (DXR Synthetic)
- Control (DX12)
- Death Stranding (DX12)
- The Division 2 (DX12)
- Far Cry New Dawn (DX11)
- Gears 5 (DX12)
- Ghost Recon: Breakpoint (Vulkan)
- Metro: Exodus (DX12)
- Middle Earth: Shadow of War (DX11)
- Red Dead Redemption 2 (Vulkan)
- Shadow of the Tomb Raider (DX12)
- Total War Saga: Troy (DX11)
We run each benchmark/game three times, and present mean averages in our graphs. We use OCAT to measure average frame rates as well as 1% low values across our three runs.
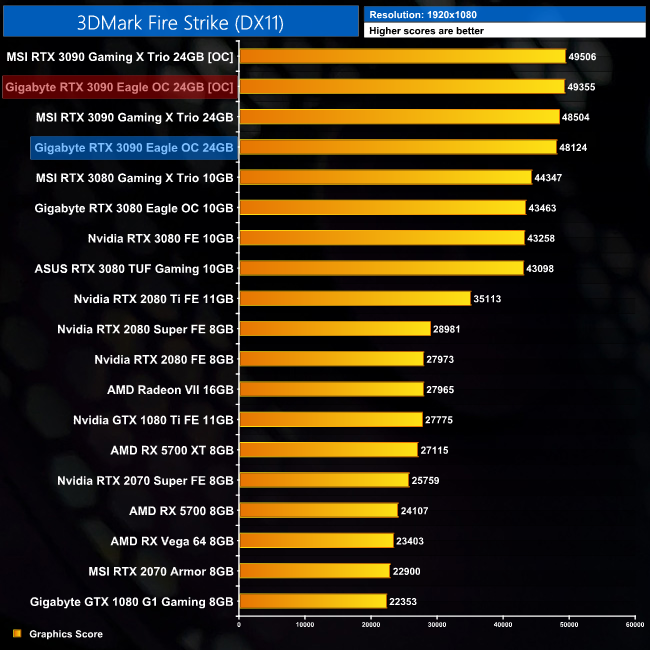
3DMark Fire Strike is a showcase DirectX 11 benchmark designed for today’s high-performance gaming PCs. It is our [FutureMark’s] most ambitious and technical benchmark ever, featuring real-time graphics rendered with detail and complexity far beyond what is found in other benchmarks and games today.
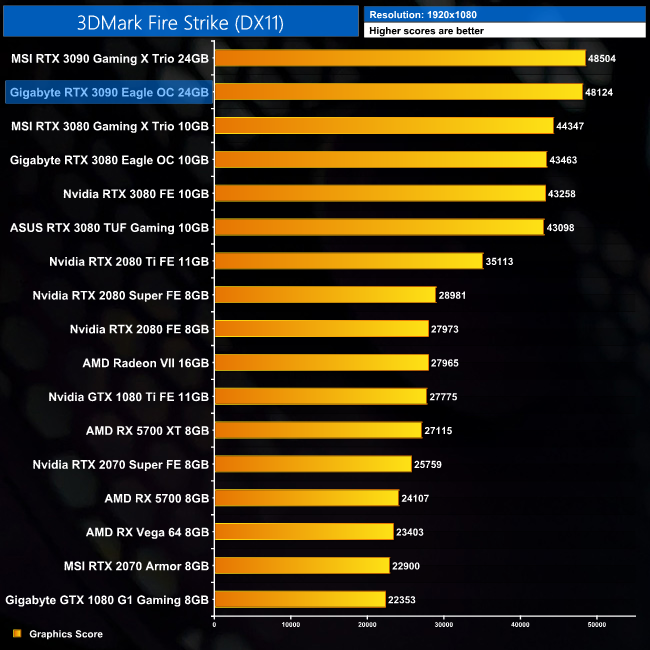
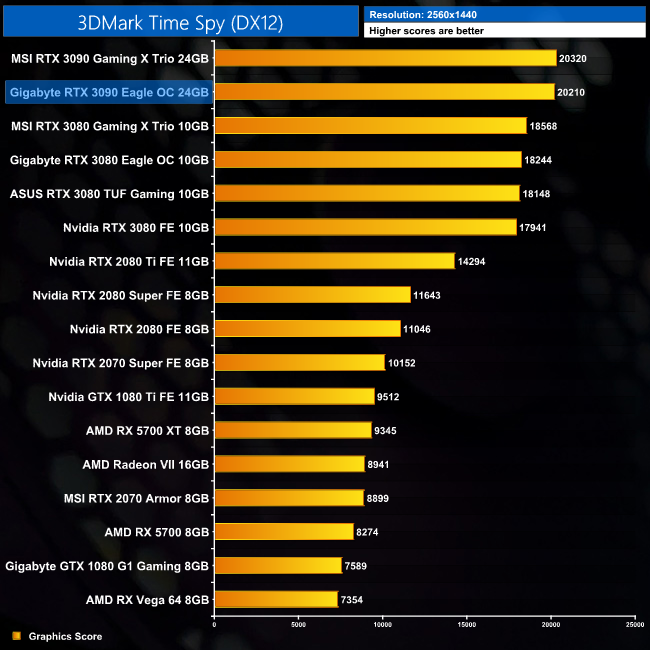
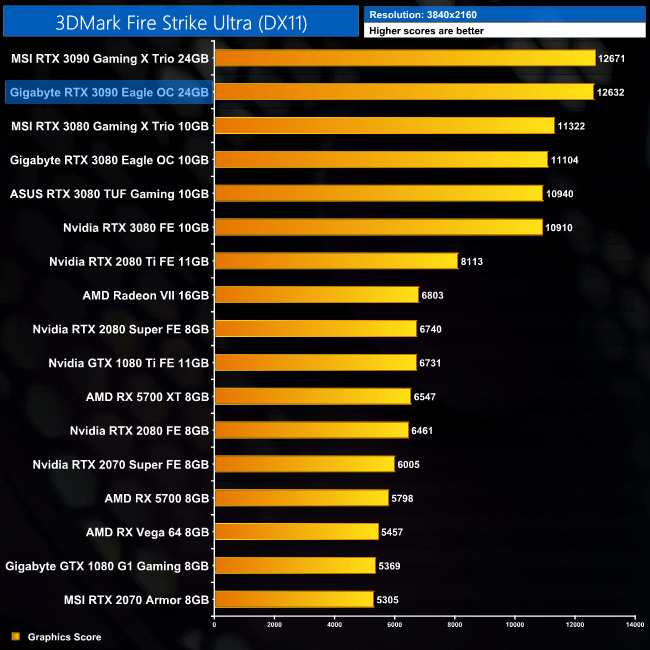
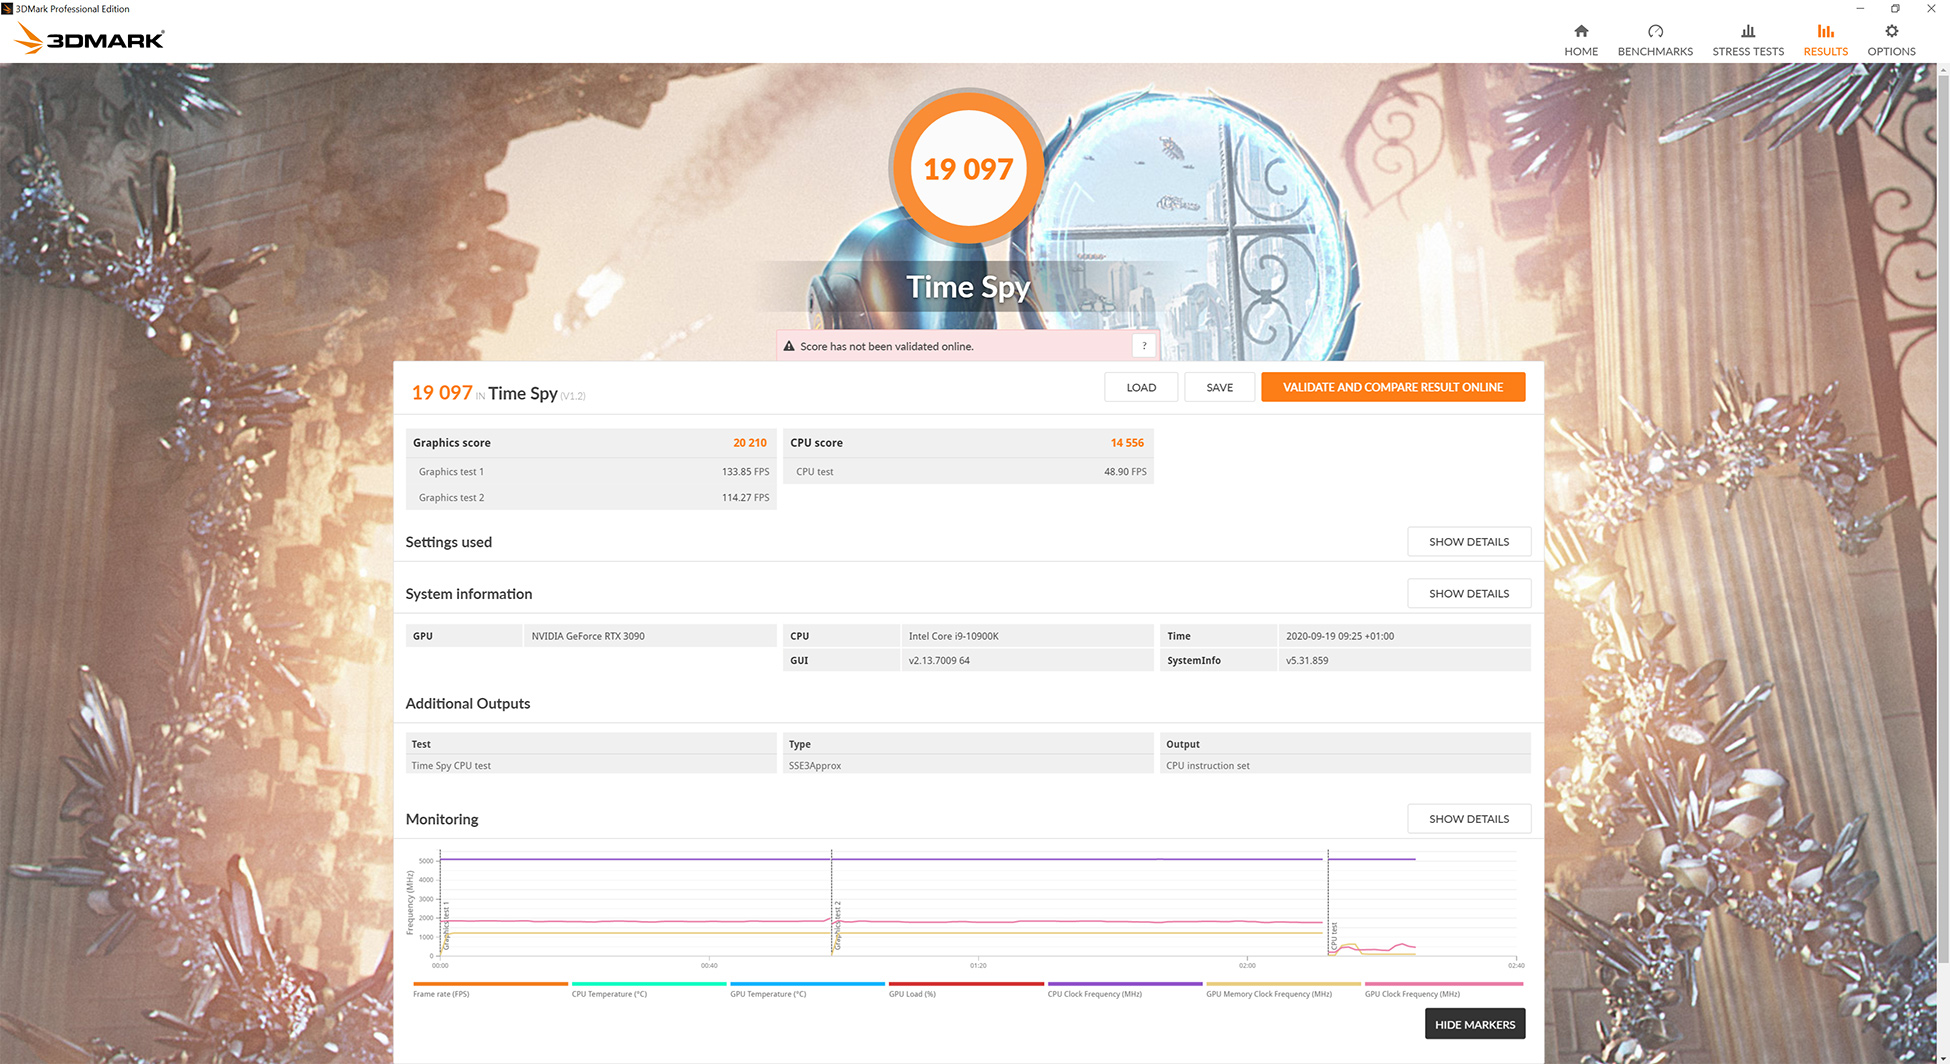
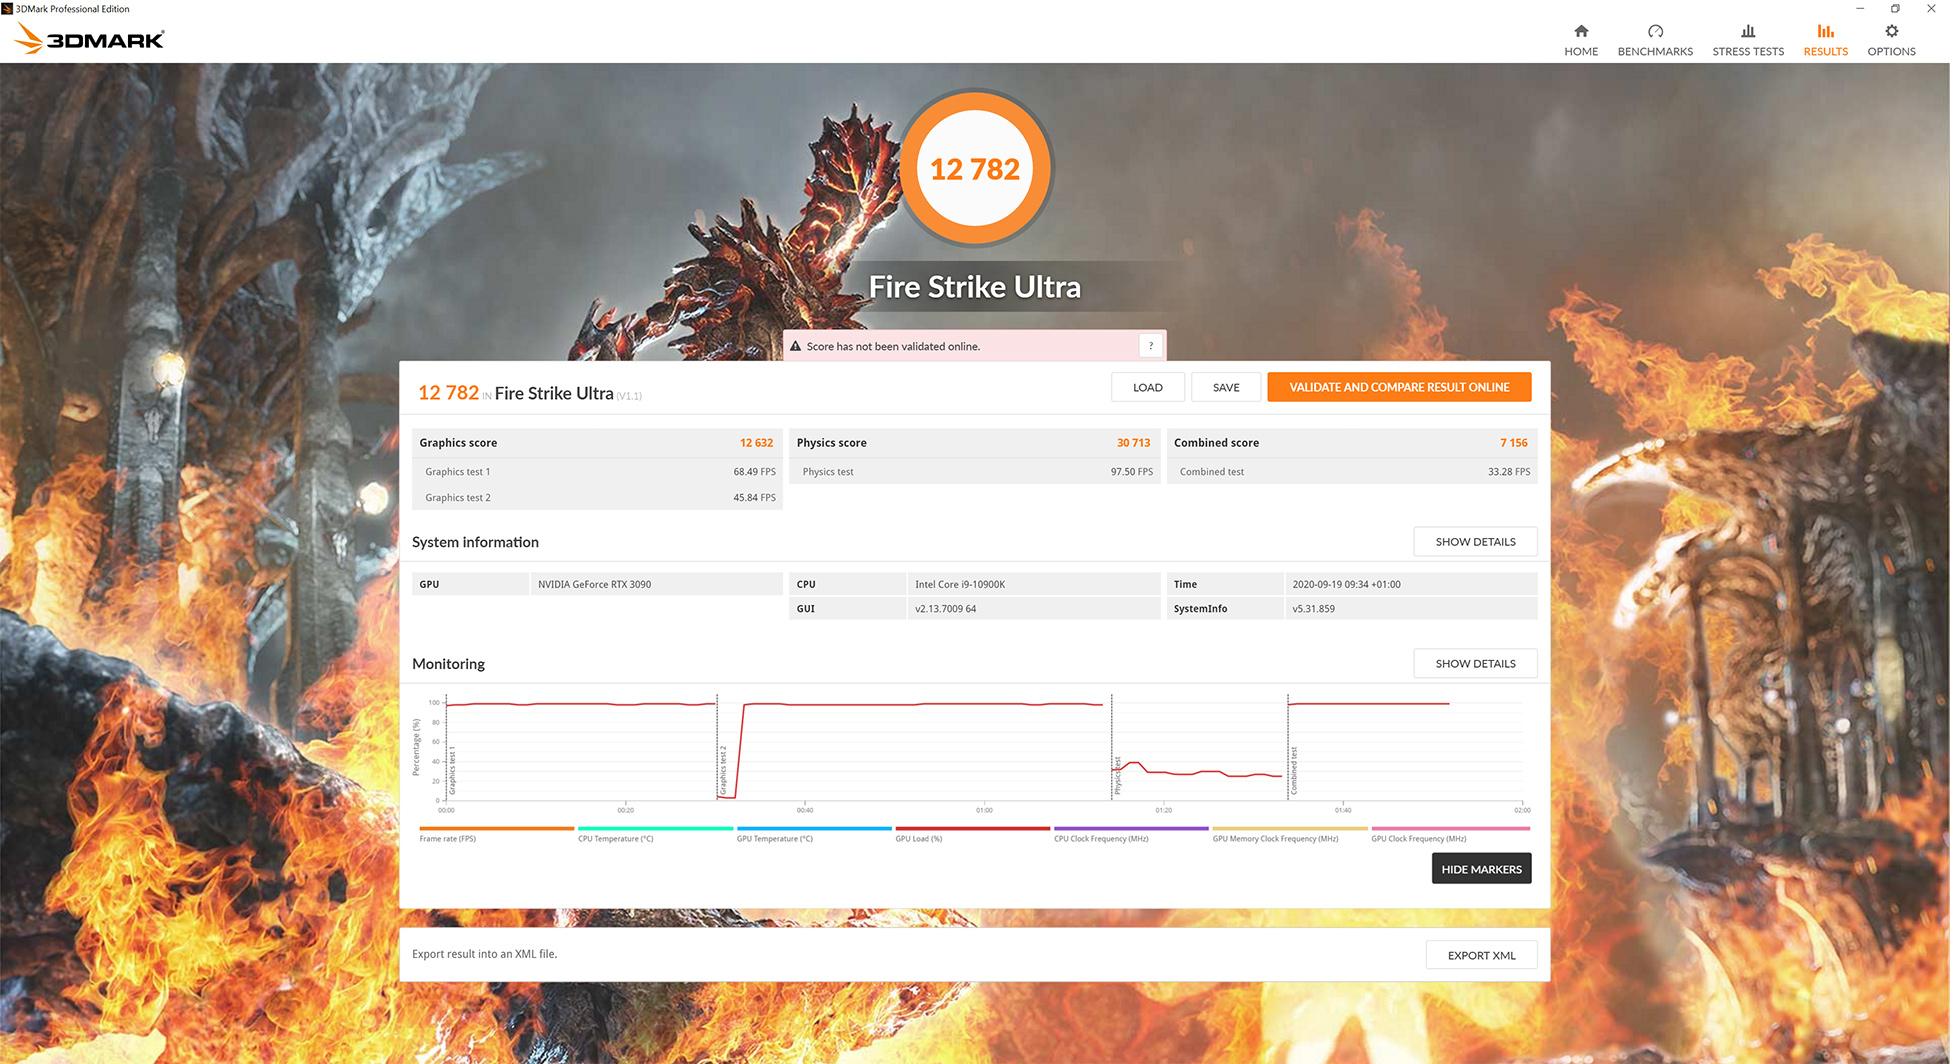
3DMark scores aren't hugely increased compared to the RTX 3080. Fire Strike sees the Gigabyte RTX 3090 Eagle OC improve on the 3080 Founders Edition by 11%, though this increases to 13% for Time Spy, and then 16% for Fire Strike Ultra.
3DMark Port Royal is the world’s first dedicated real-time ray tracing benchmark for gamers. You can use Port Royal to test and compare the real-time ray tracing performance of any graphics card that supports Microsoft DirectX Raytracing. As well as benchmarking performance, 3DMark Port Royal provides a realistic and practical example of what to expect from ray tracing in upcoming games.
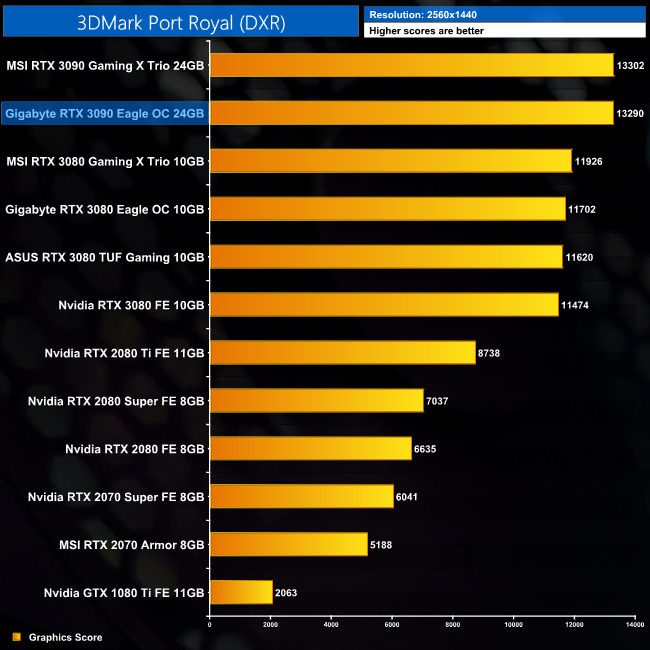
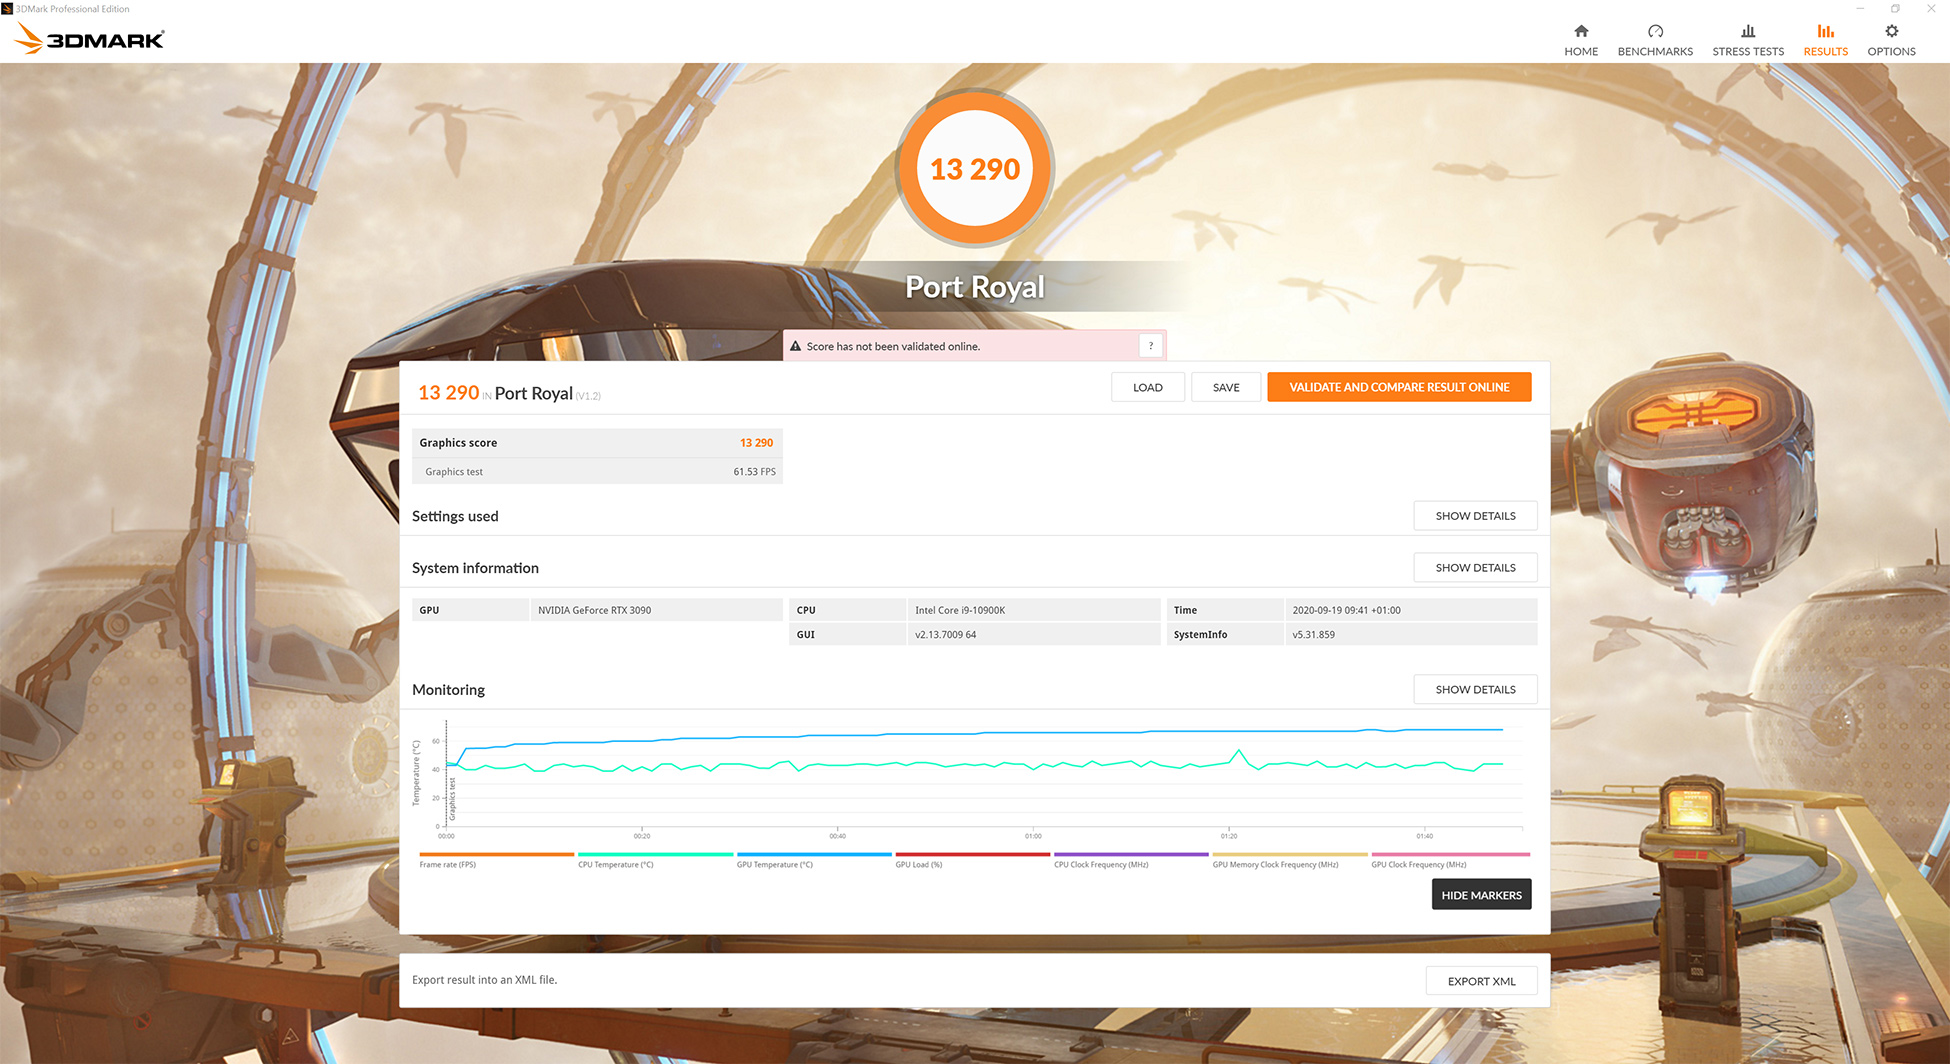
Port Royal picks up where Fire Strike Ultra left off, as we see the Gigabyte RTX 3090 outperforming the 3080 Founders Edition by 16%. This gives us a glimpse of what to expect in terms of the 3090's ray tracing performance, but we test this in more detail later in the review.
Control is an action-adventure video game developed by Remedy Entertainment and published by 505 Games. Control was released on 27 August 2019 for Microsoft Windows, PlayStation 4, and Xbox One. (Wikipedia).
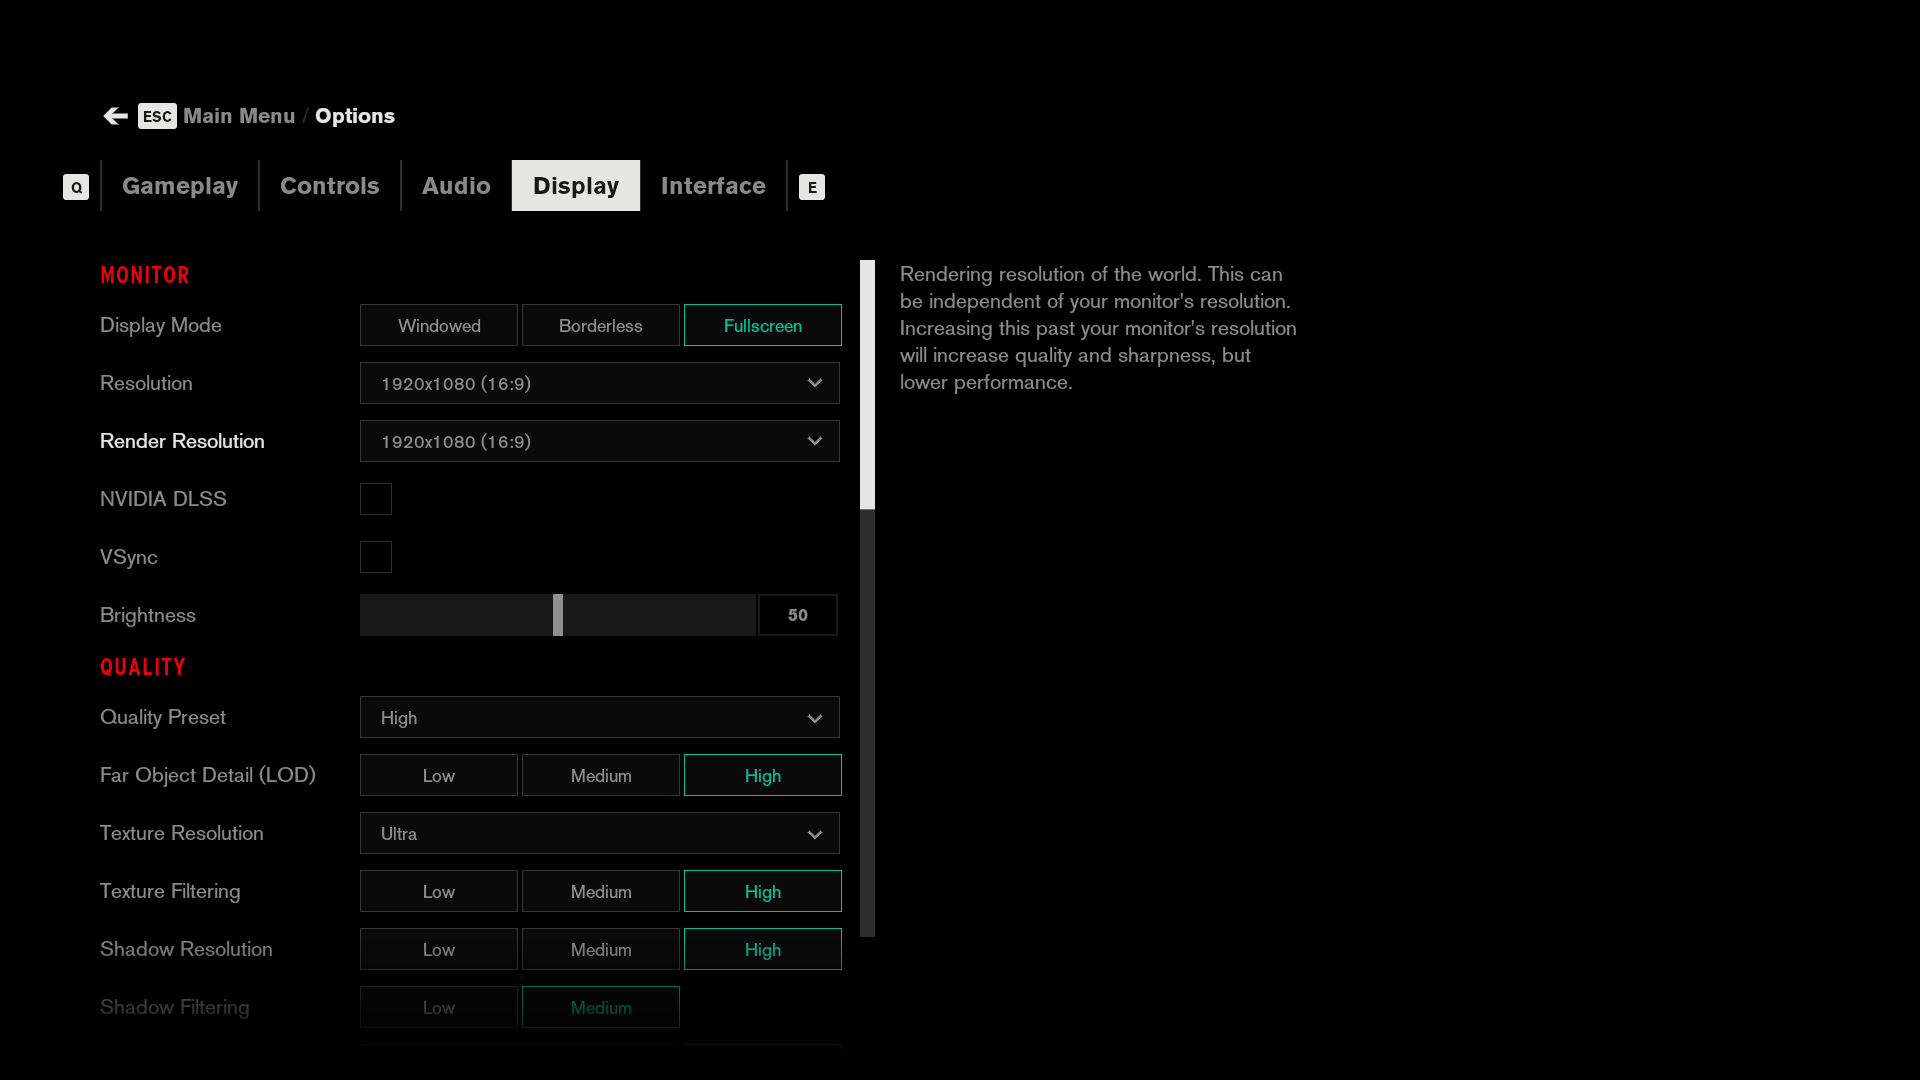
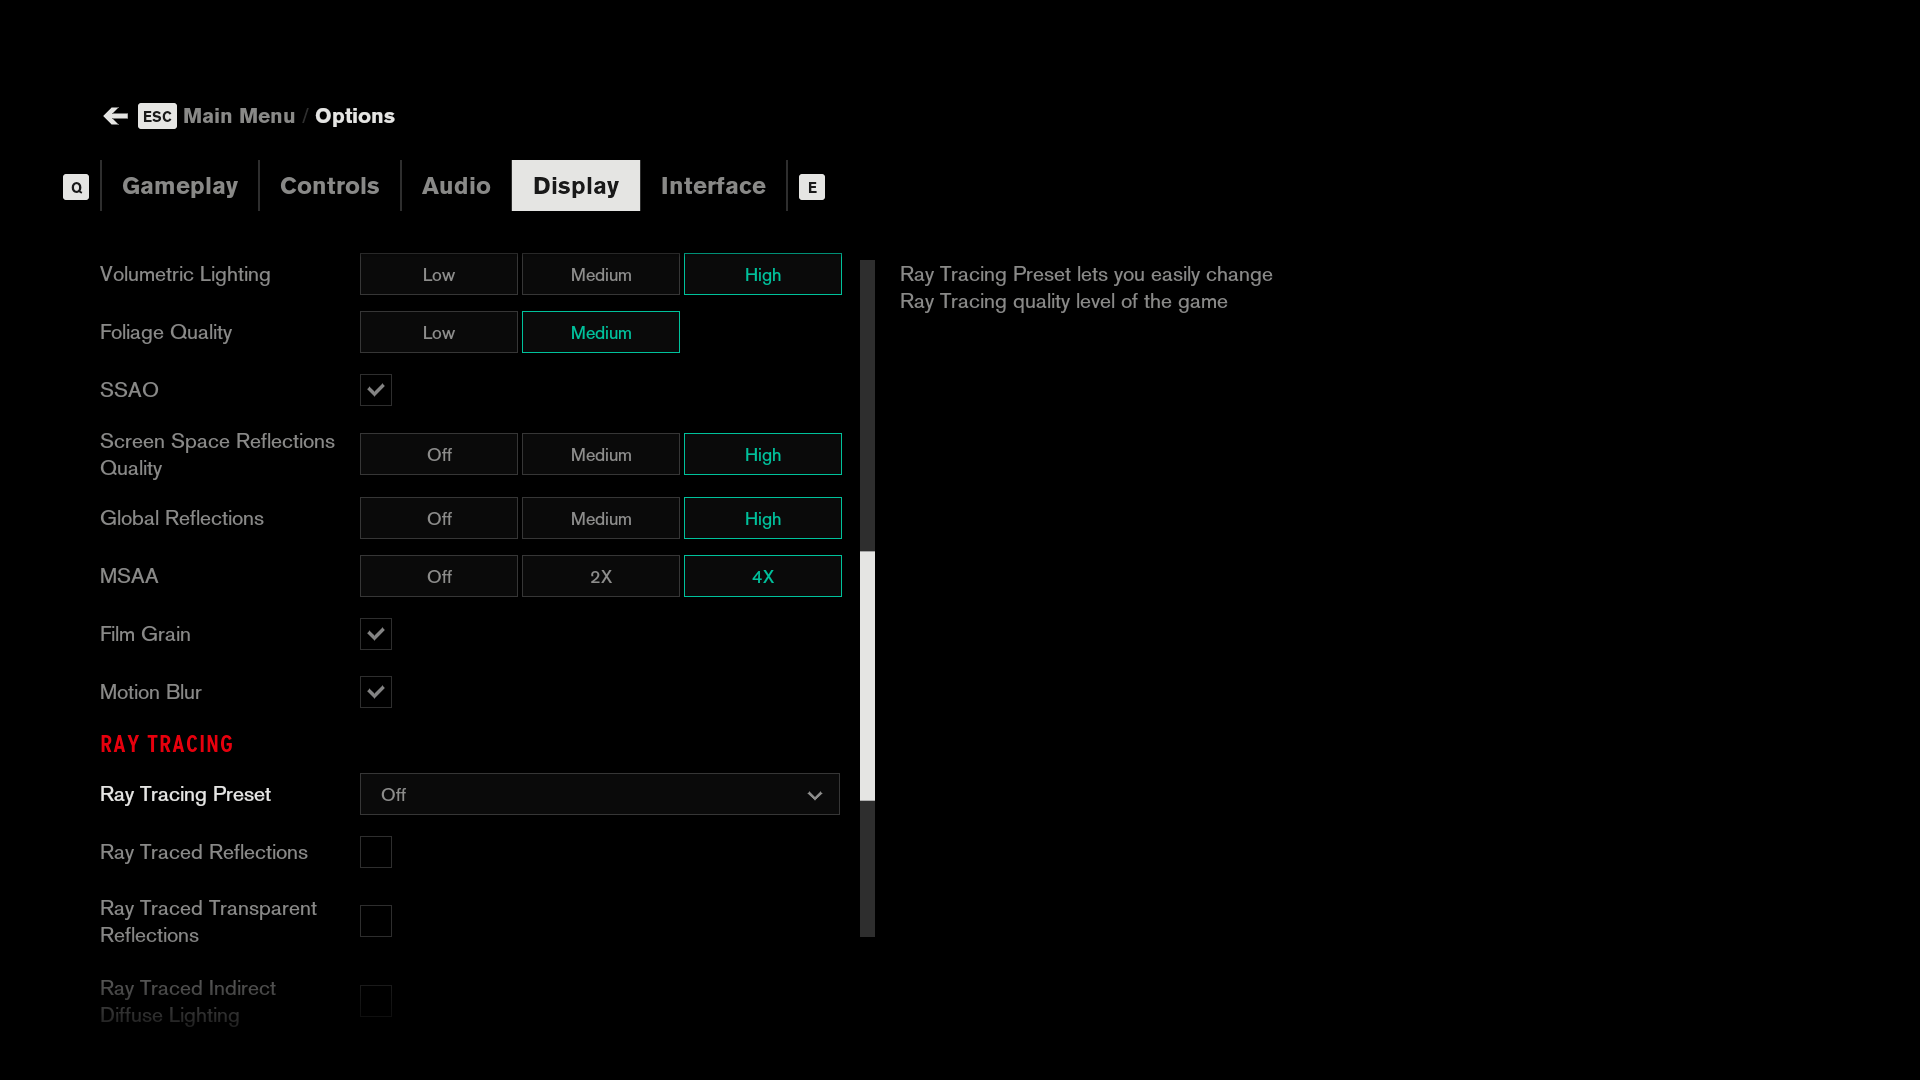
Engine: Northlight Engine. We test using the High preset, with 4x MSAA, DX12 API.
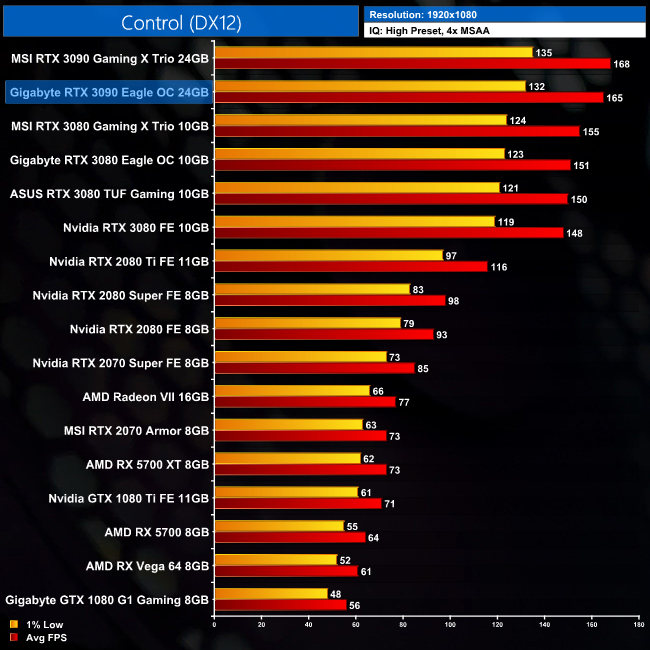
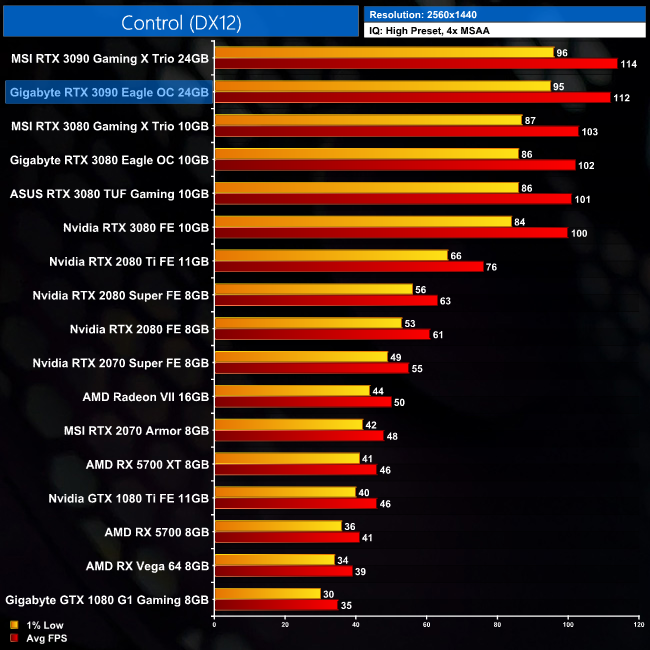
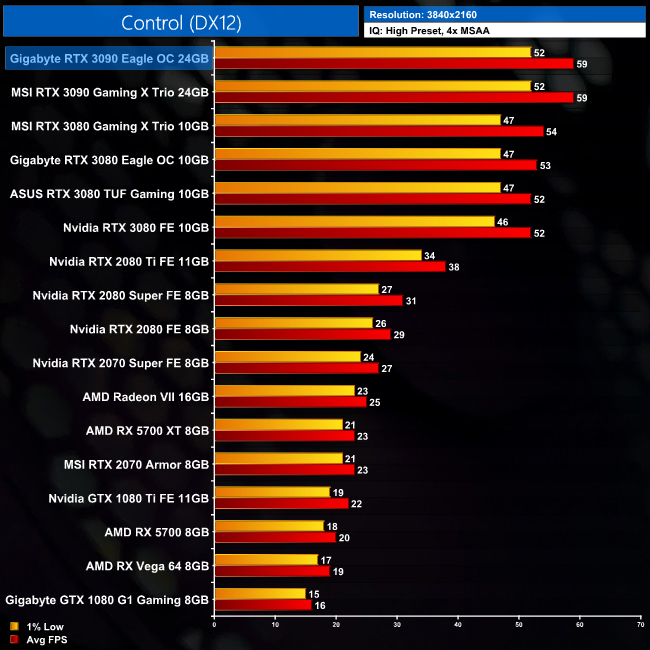
Our first game of the day is Control, and here the Gigabyte RTX 3090 increases its relative lead over the RTX 3080 Founders Edition as we step up in resolution. It's 11% faster at 1080p, 12% faster at 1440p and finally 13% faster at 4K.
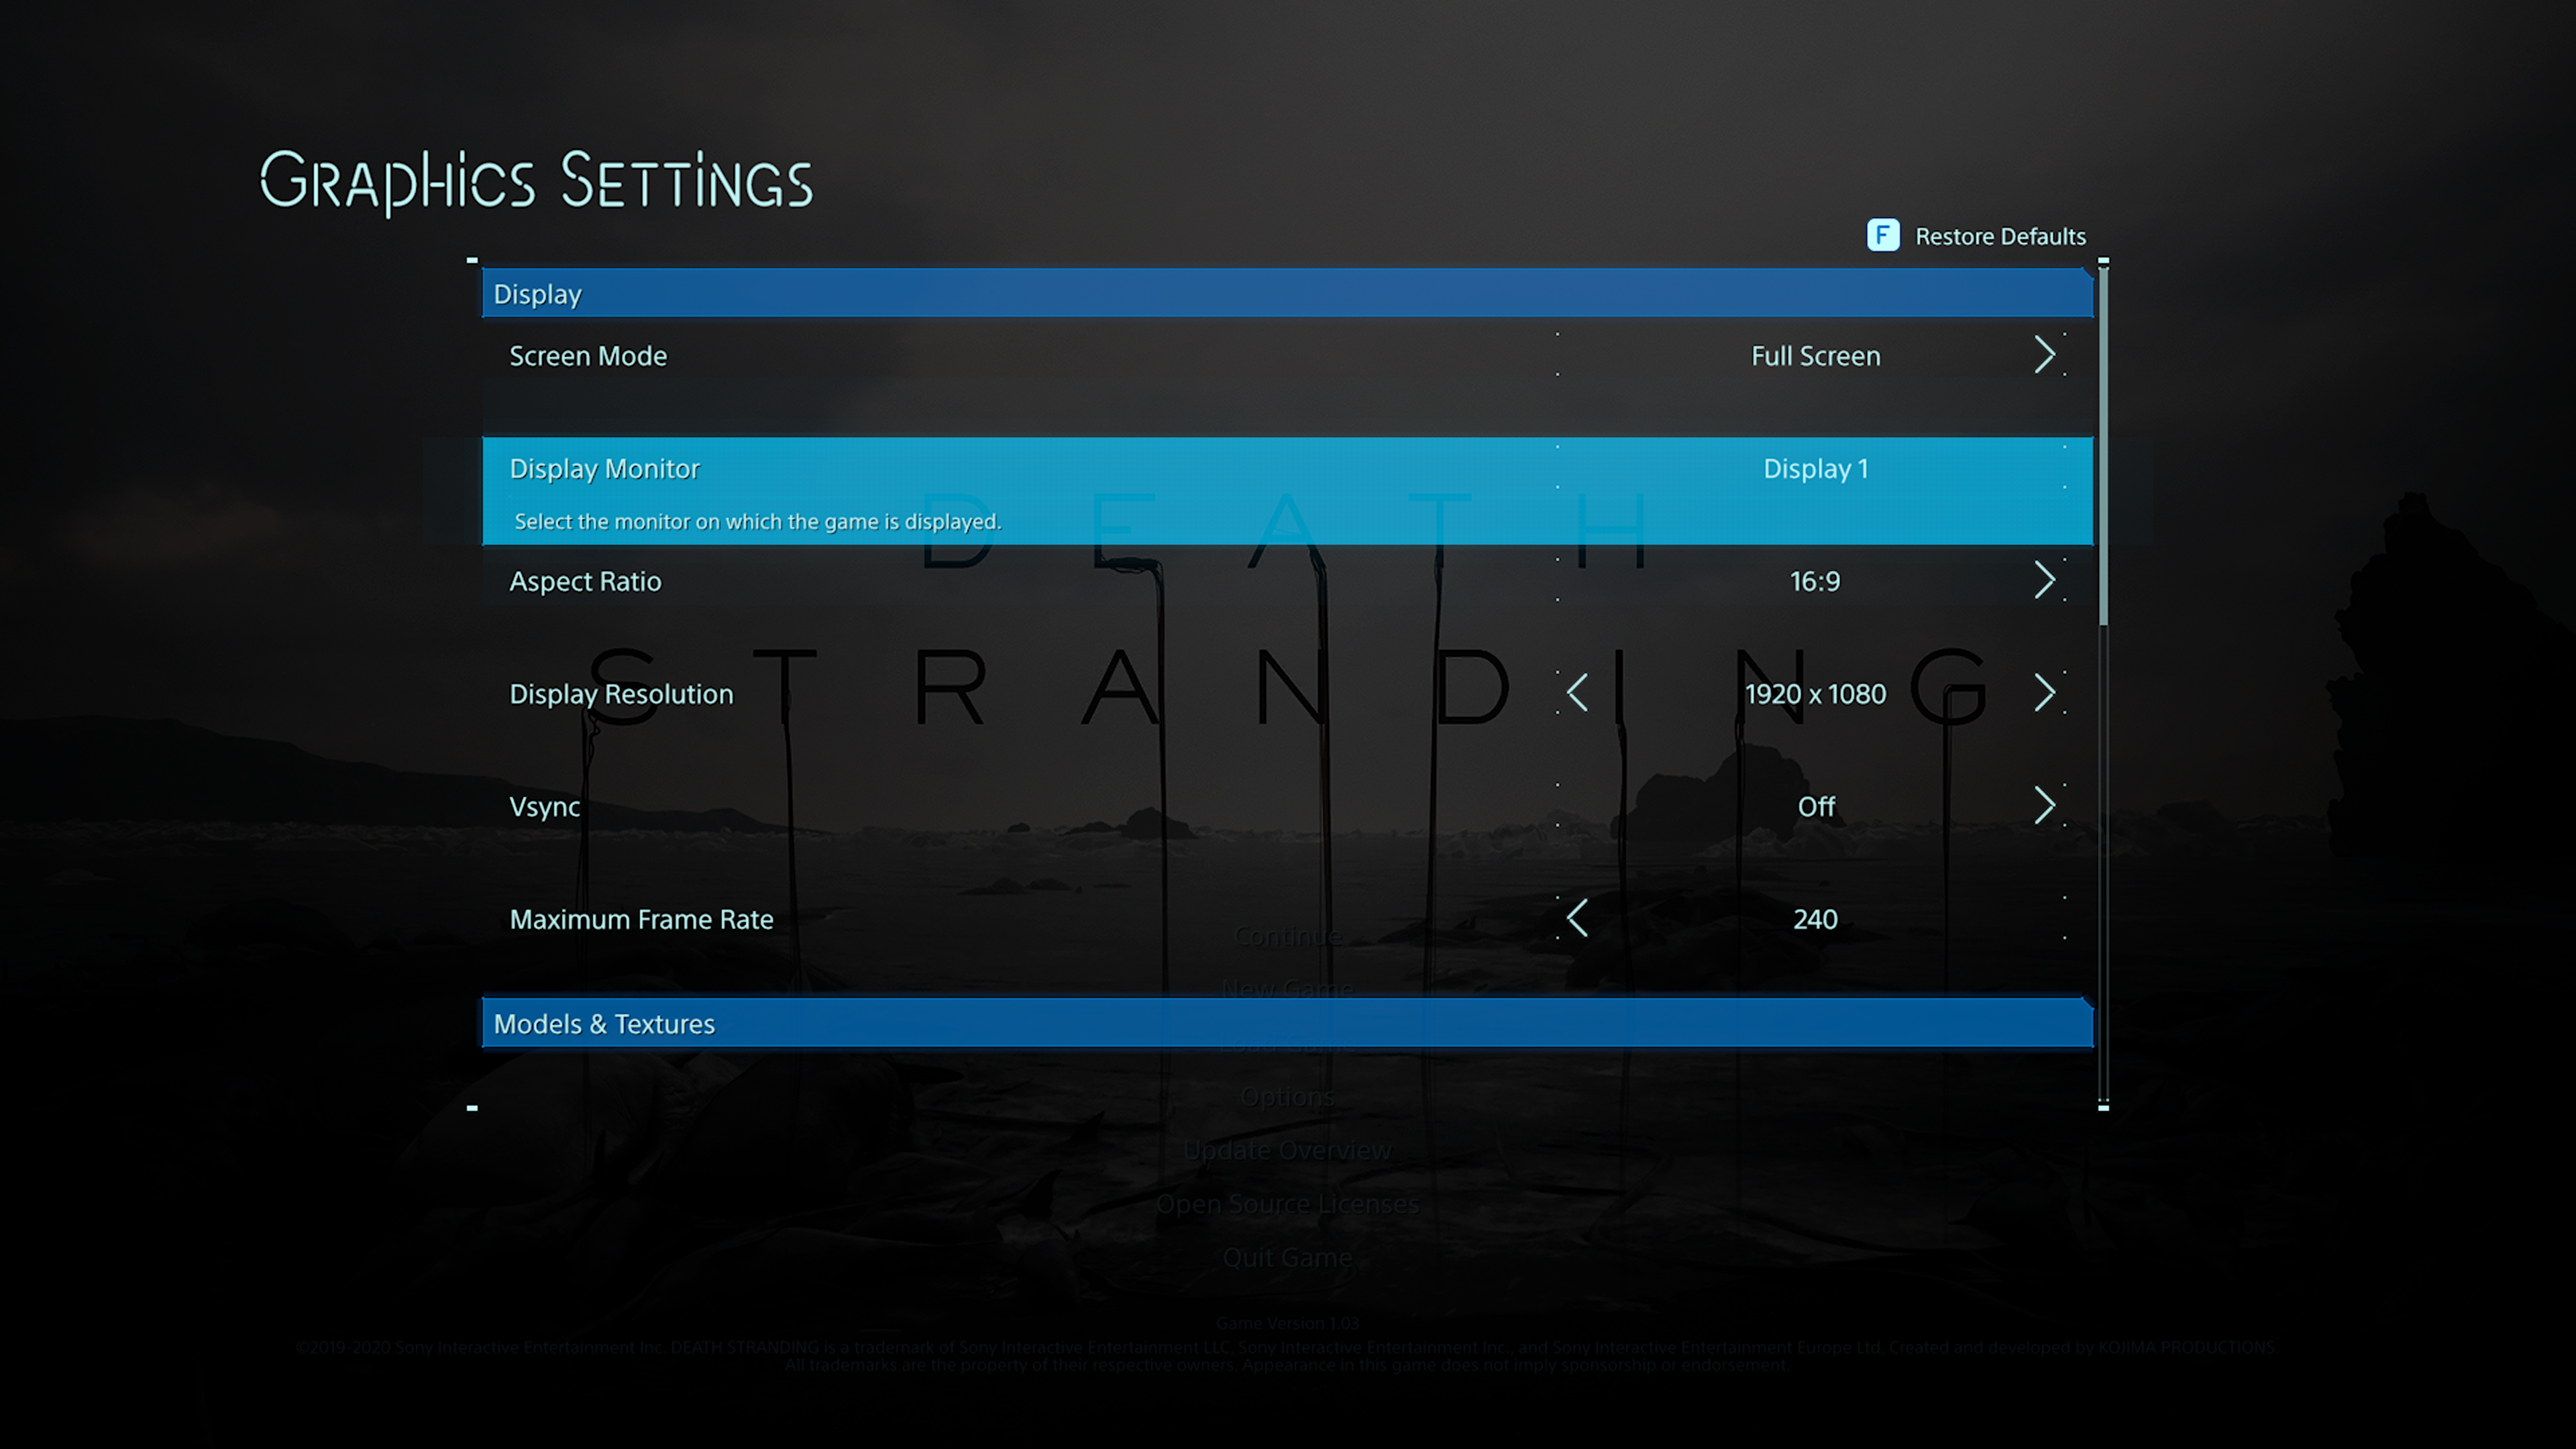
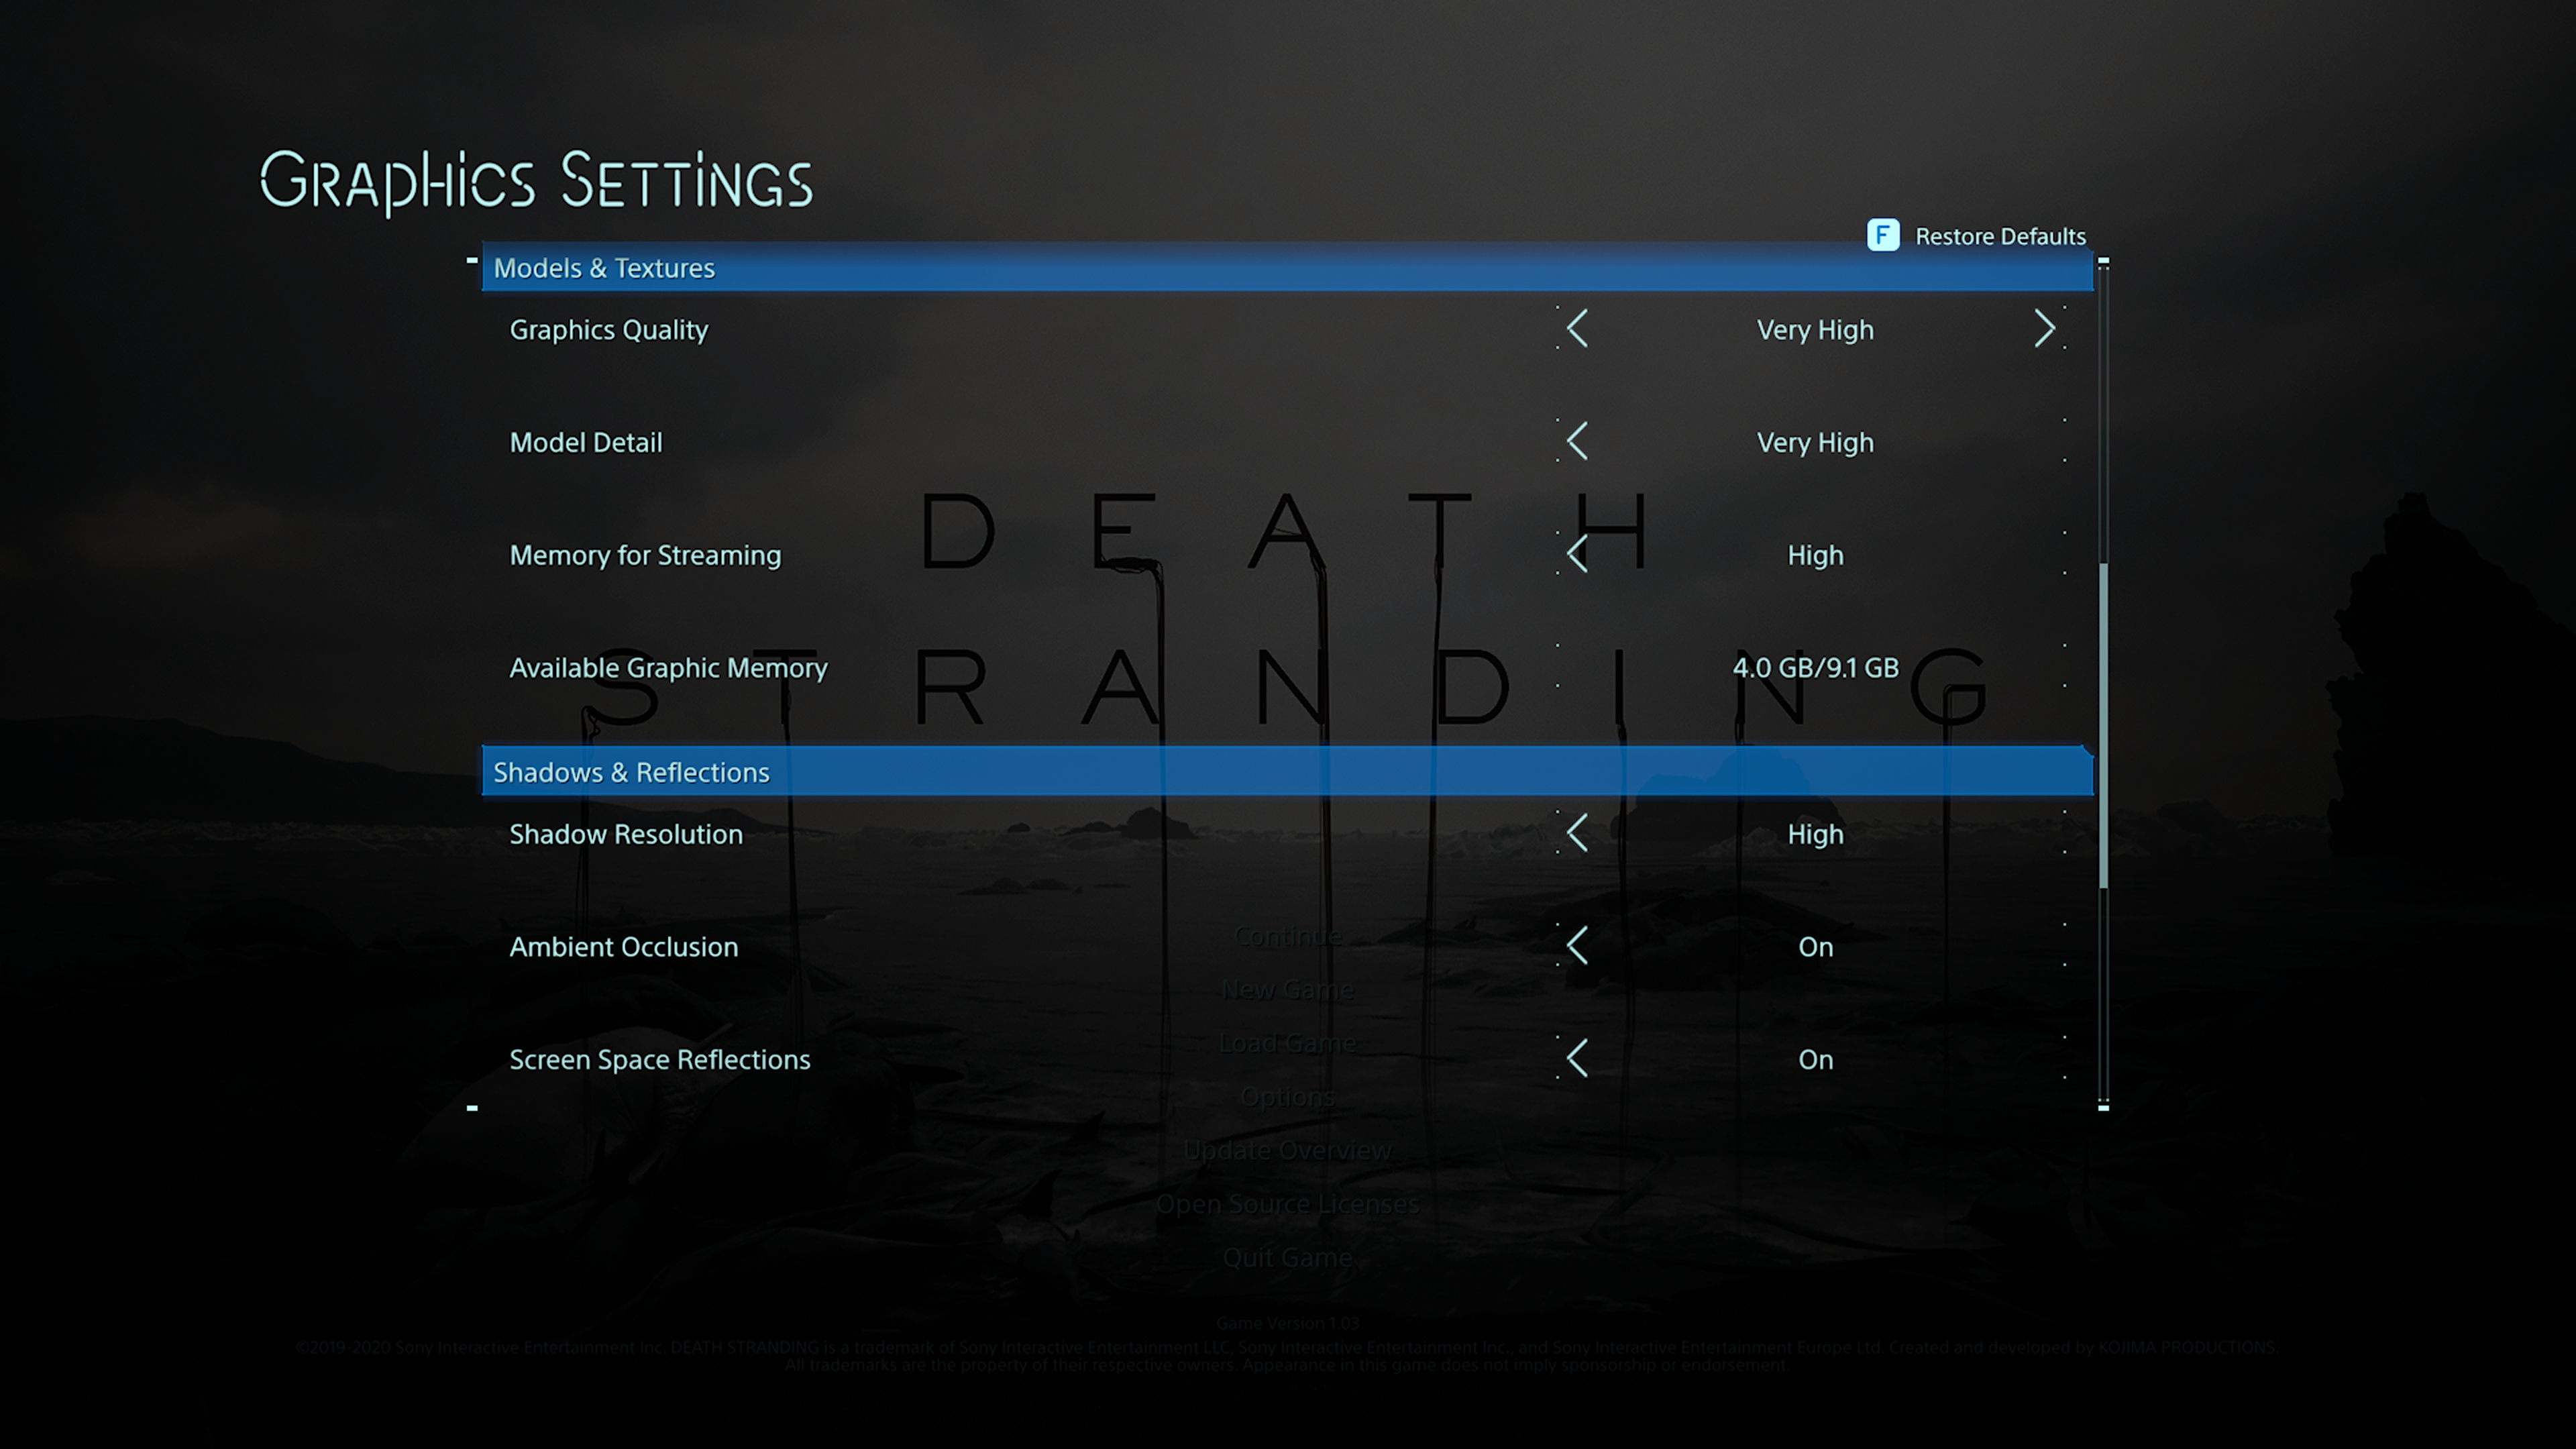
Death Stranding is an action game developed by Kojima Productions. It is the first game from director Hideo Kojima and Kojima Productions after their split from Konami in 2015. It was released by Sony Interactive Entertainment for the PlayStation 4 in November 2019 and by 505 Games for Windows in July 2020. (Wikipedia).
Engine: Decima. We test using the Very High preset, with TAA, DX12 API.
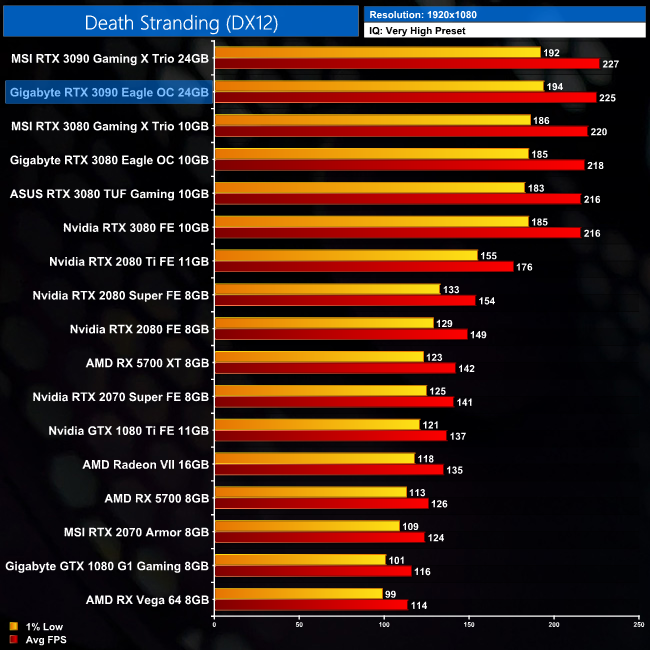
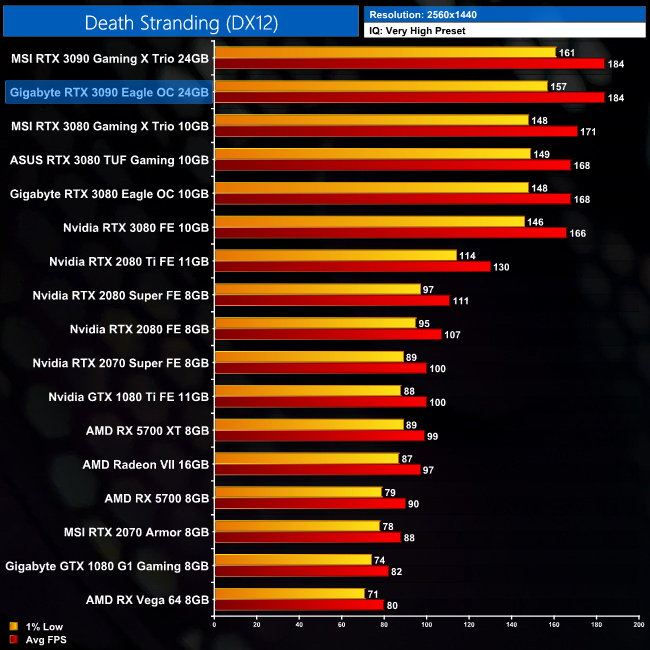
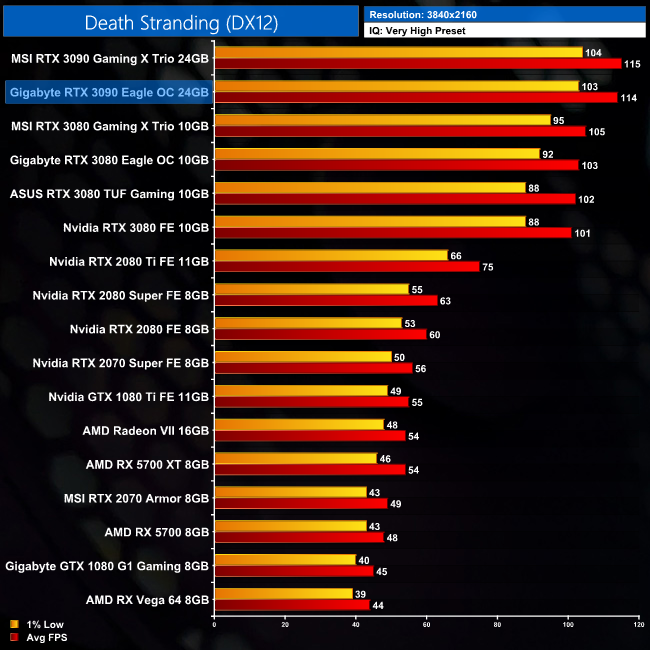
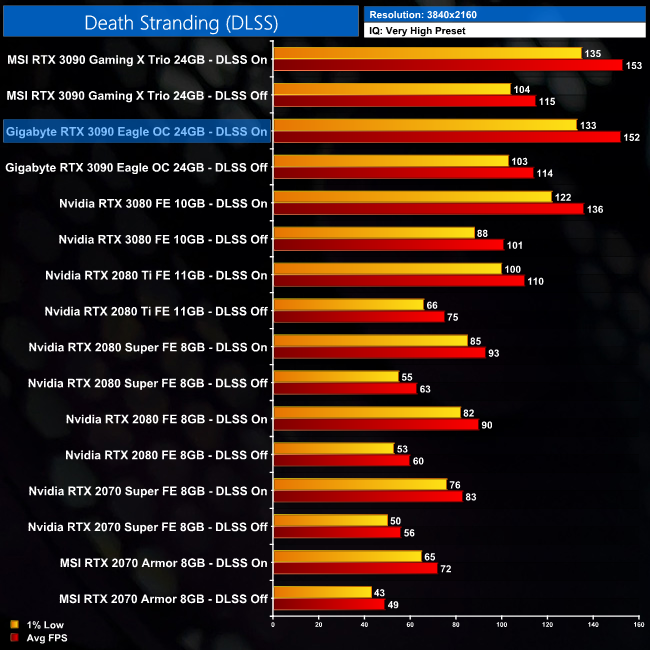
In Death Stranding, the RTX 3090 is able to maintain over 100FPS at 4K, even in terms of its 1% lows frame-times. With an average of 113FPS at this resolution, it is 13% faster than the RTX 3080 Founders Edition.
Tom Clancy's The Division 2 is an online action role-playing video game developed by Massive Entertainment and published by Ubisoft. The sequel to Tom Clancy's The Division (2016), it is set in a near-future Washington, D.C. in the aftermath of a smallpox pandemic, and follows an agent of the Strategic Homeland Division as they try to rebuild the city. (Wikipedia).
Engine: Snowdrop. We test using the Ultra preset, but with V-Sync disabled, DX12 API.
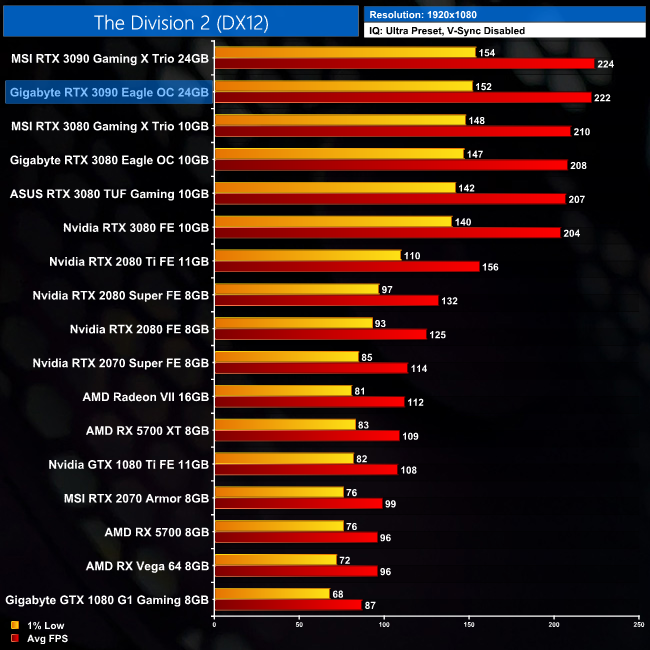
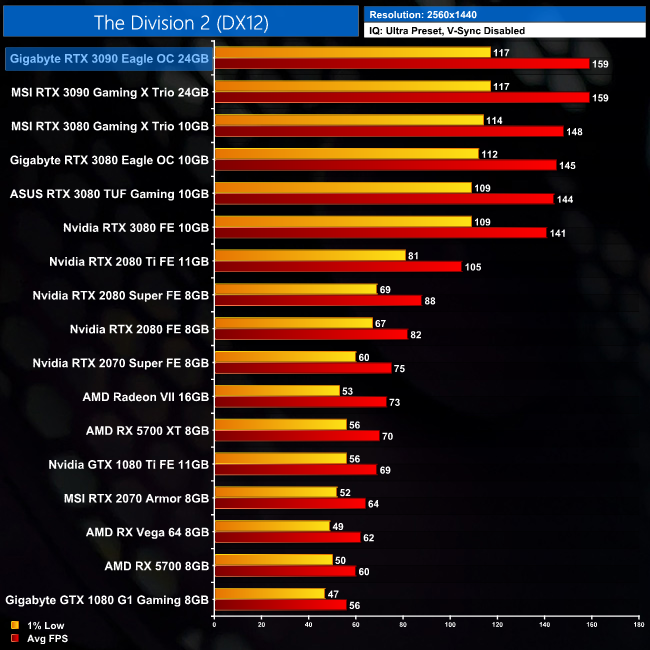
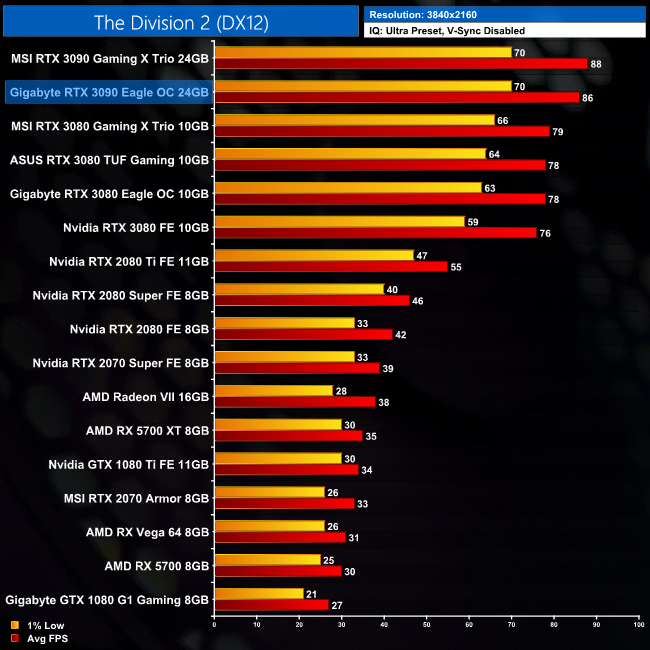
The Division 2 is a game that seems to like the Ampere architecture, and here we see the Gigabyte RTX 3090 beat the RTX 2080 Ti by a 56% margin at 4K. That makes it the single biggest increase over last generation's flagship that we will see today. Compared to RTX 3080, it's another 13% uplift for the 3090.
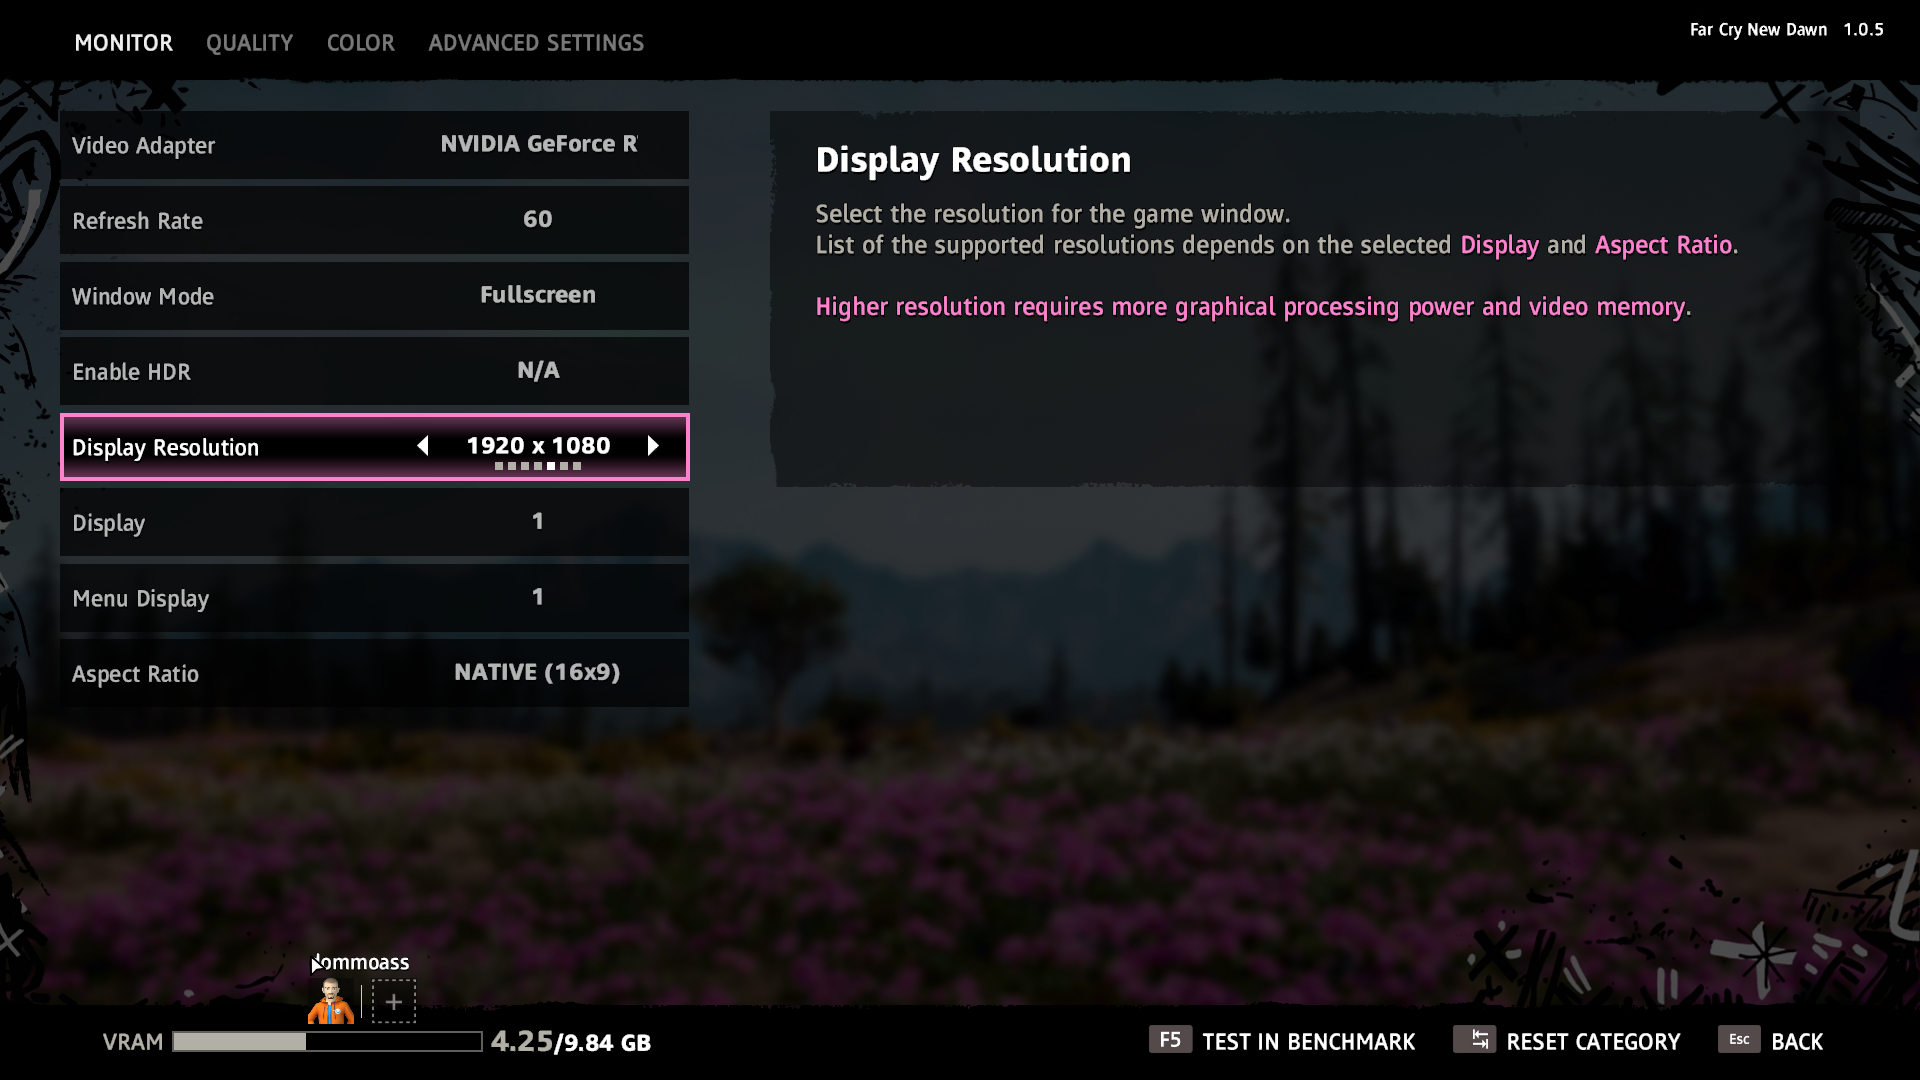
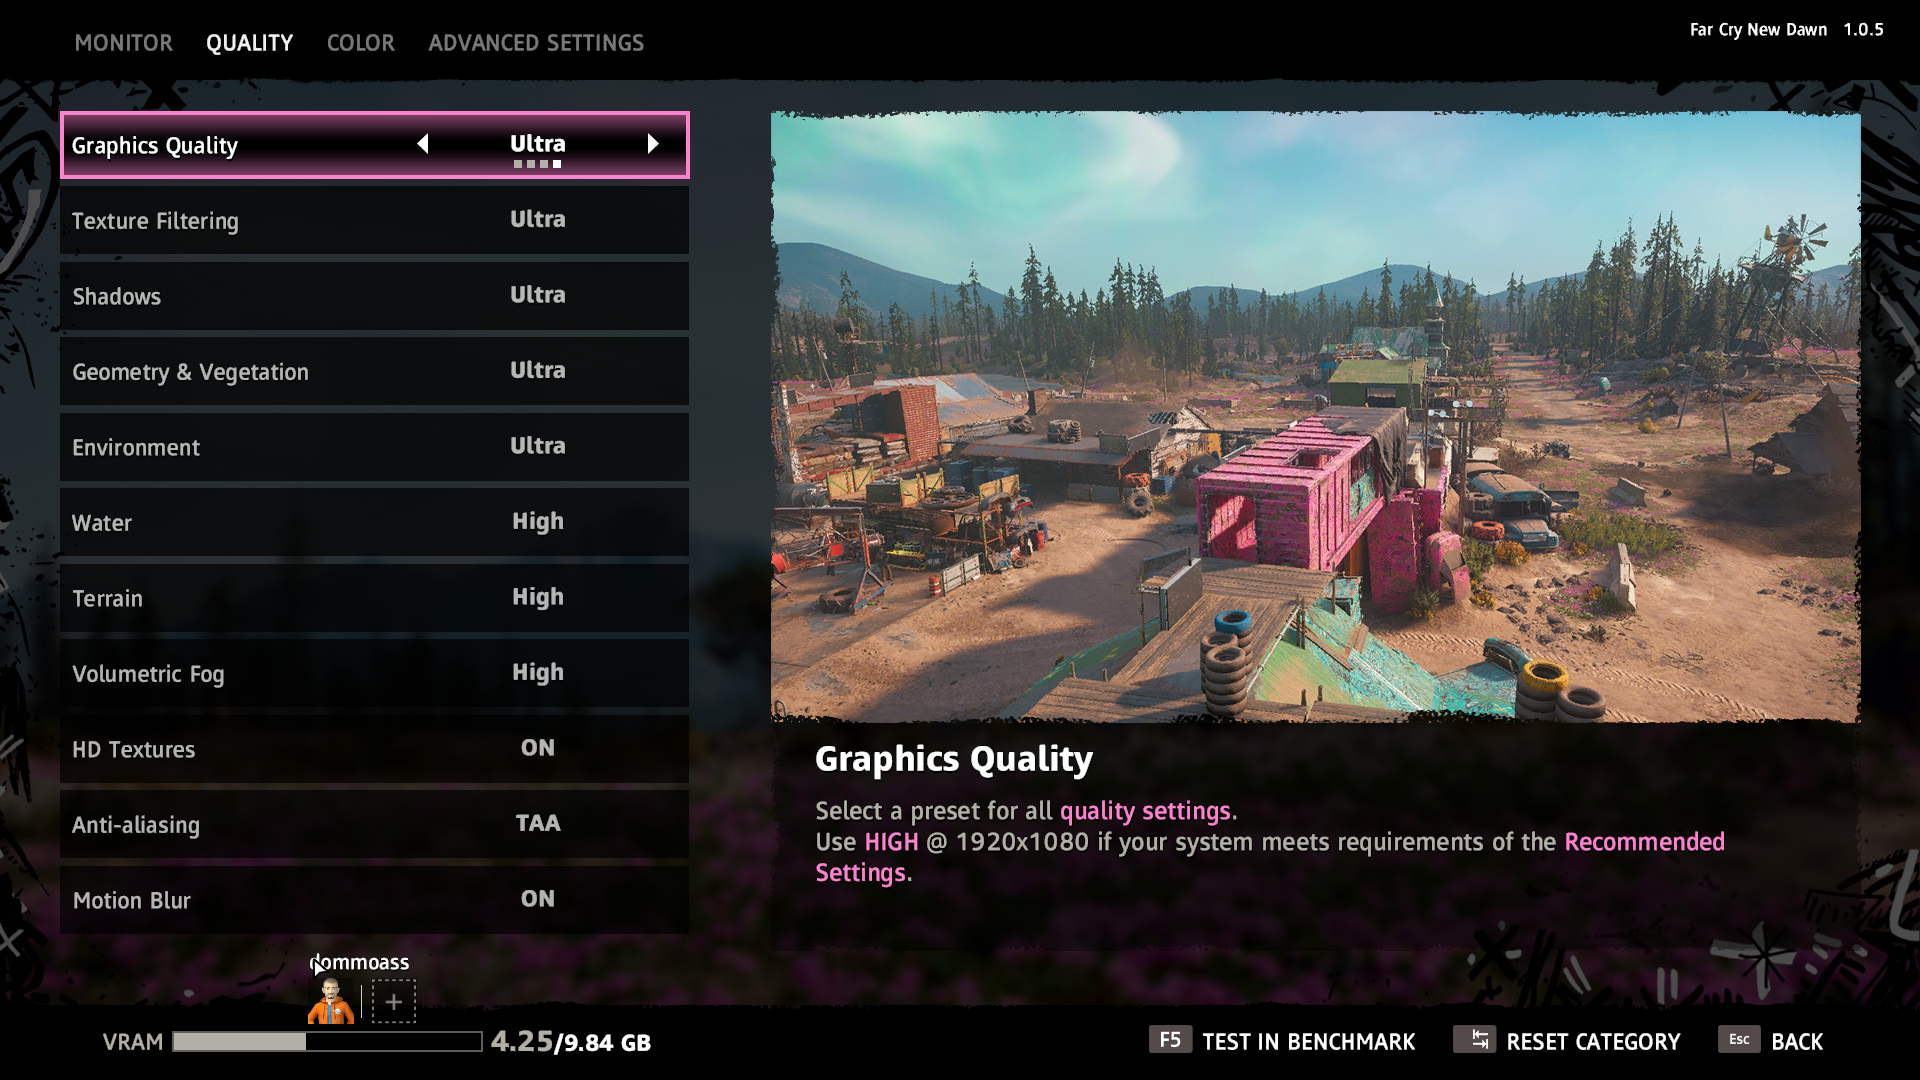
Far Cry New Dawn is an action-adventure first-person shooter developed by Ubisoft Montreal and published by Ubisoft. The game is a spin-off of the Far Cry series and a narrative sequel to Far Cry 5. It was released for Microsoft Windows, PlayStation 4 and Xbox One on February 15, 2019. (Wikipedia).
Engine: Dunia 2. We test using the Ultra preset, with the HD Textures pack, DX11 API.
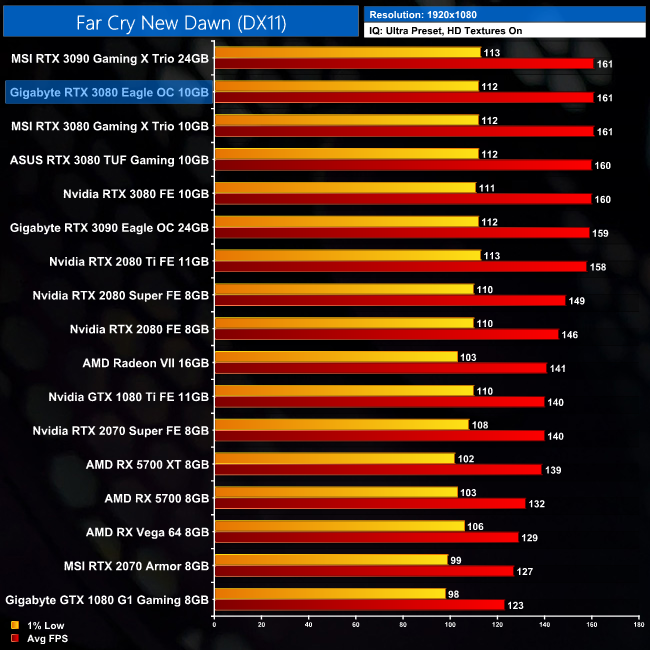
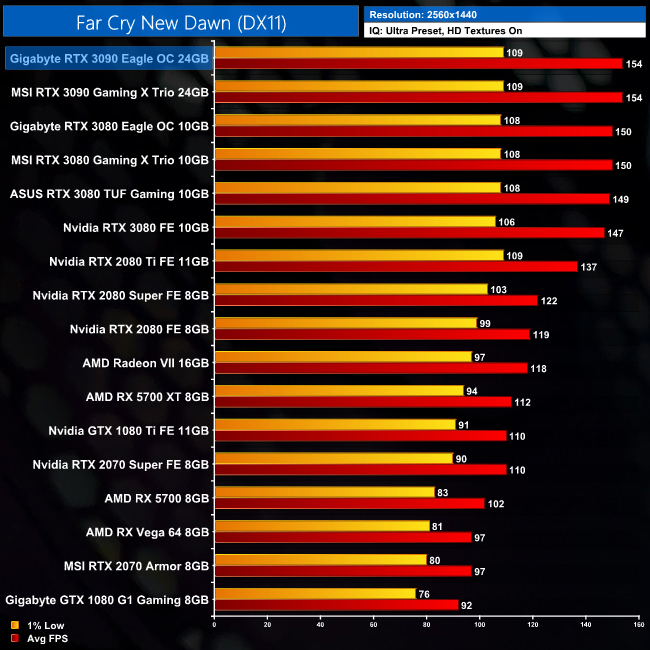
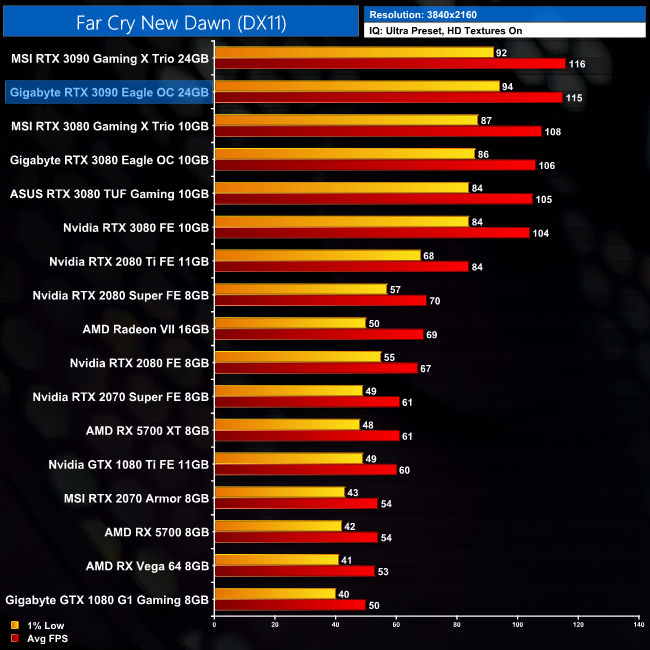
Where the Division 2 gave us the biggest margin of difference versus the RTX 2080 Ti, Far Cry New Dawn shows the smallest difference between the two GPUs. At 4K, the Gigabyte RTX 3090 is 37% faster. The GPU is still capable of excellent performance in this title though, churning out over 110FPS on average.
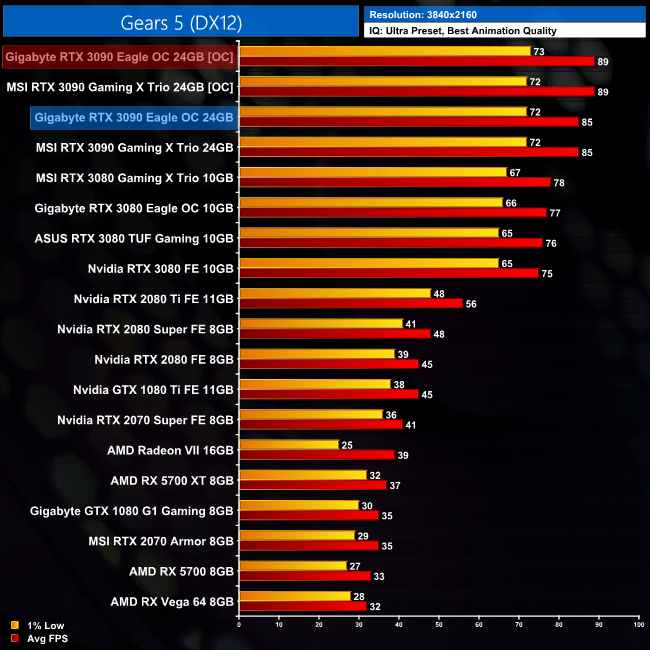
Gears 5 is a third-person shooter video game developed by The Coalition and published by Xbox Game Studios for Microsoft Windows and Xbox One. It is the sixth instalment of the Gears of War series, and is the second Gears of War game not to be developed by Epic Games.
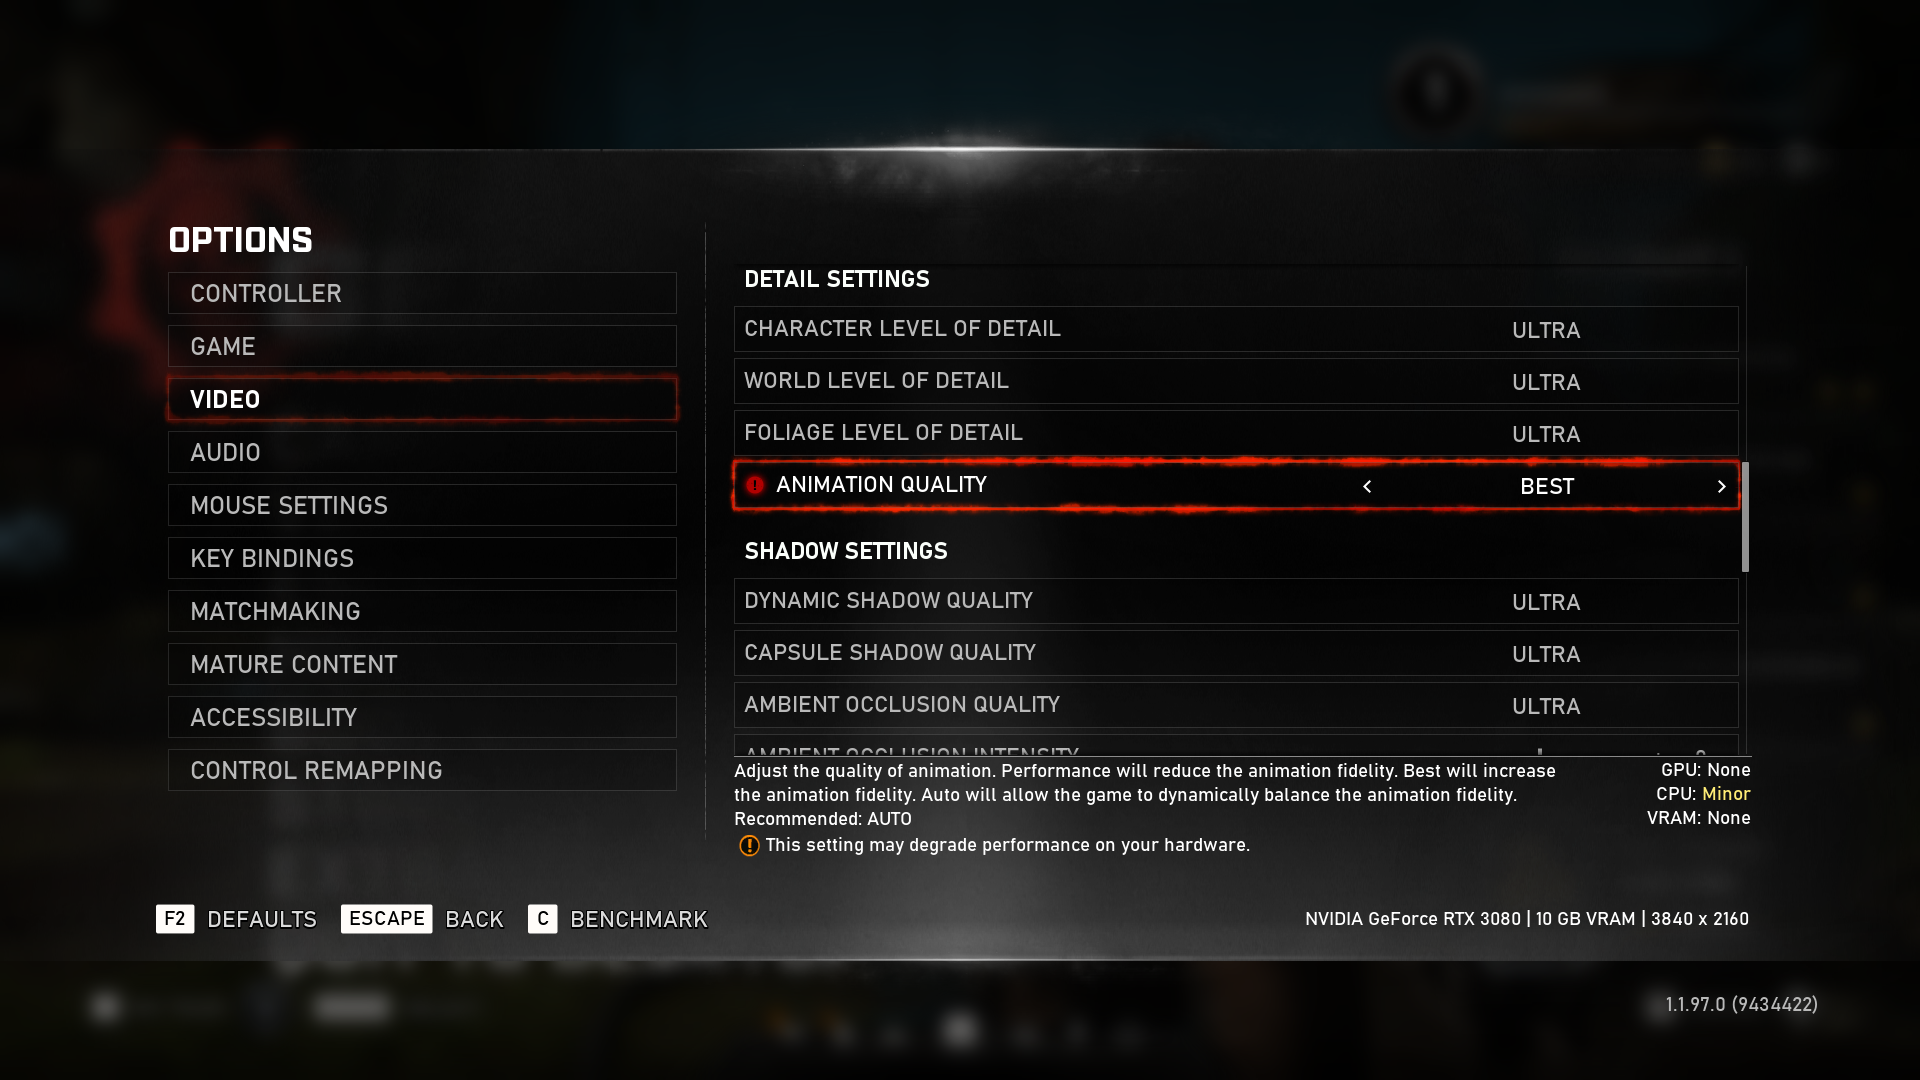
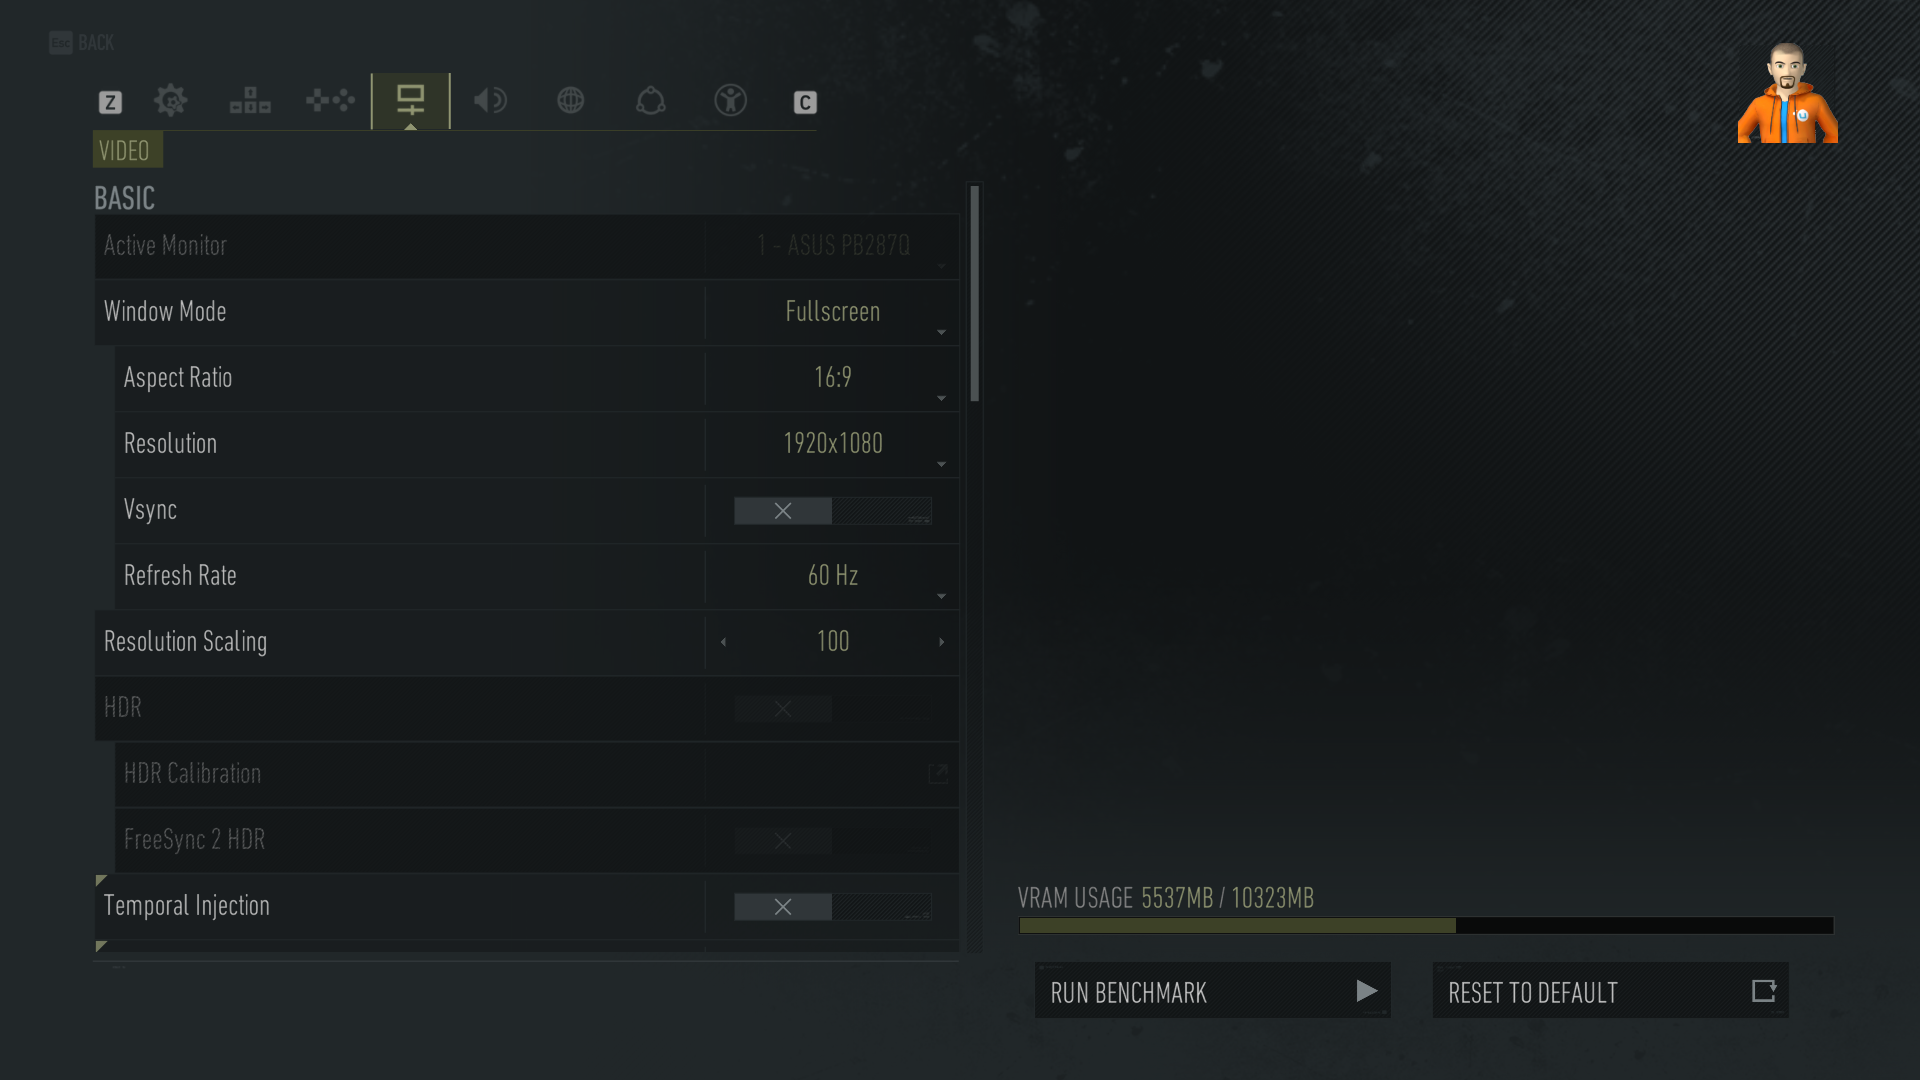
Engine: Unreal Engine 4. We test using the Ultra preset, with Best Animation Quality (instead of Auto), DX12 API.
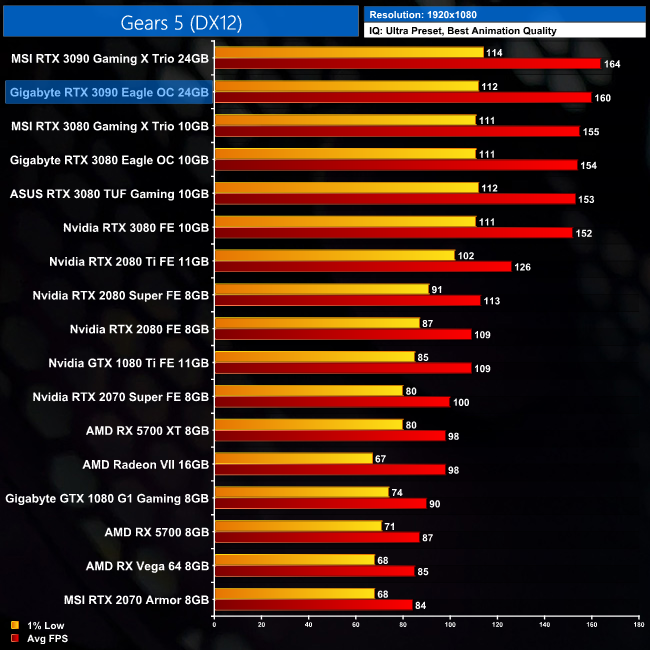
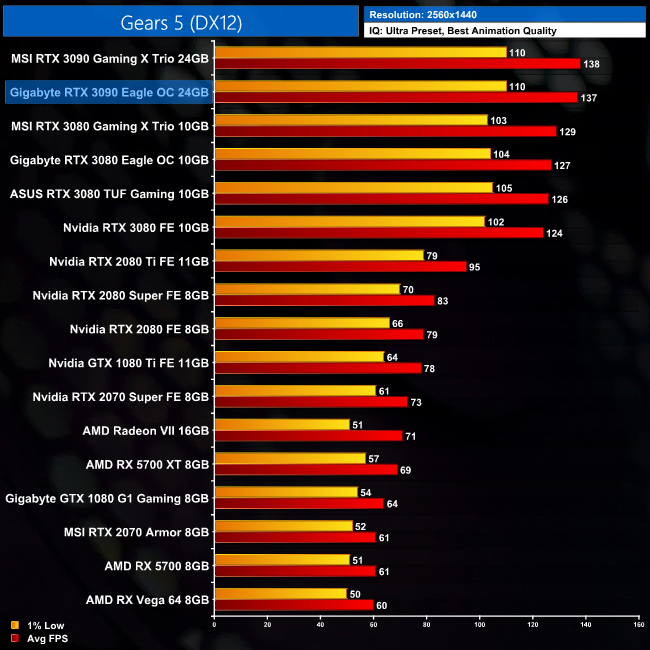
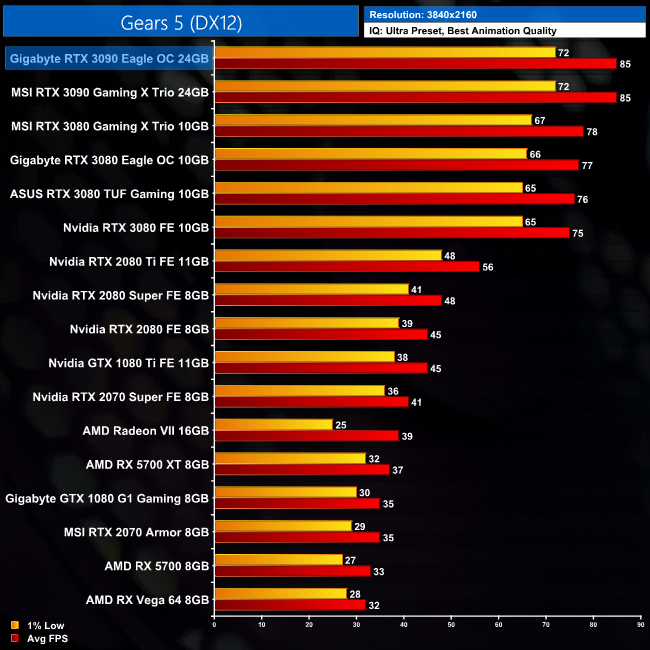
Next up we have Gears 5, and here Gigabyte's RTX 3090 Eagle outperforms the RTX 2080 Ti by 52% at 4K, while it is also 13% ahead of the RTX 3080 Founders Edition.
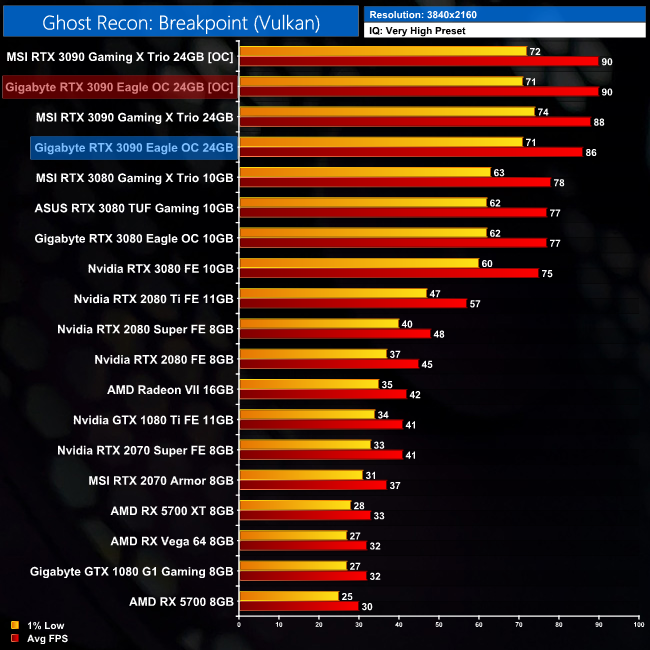
Tom Clancy's Ghost Recon Breakpoint is an online tactical shooter video game developed by Ubisoft Paris and published by Ubisoft. The game was released worldwide on 4 October 2019, for Microsoft Windows, PlayStation 4 and Xbox One, (Wikipedia).
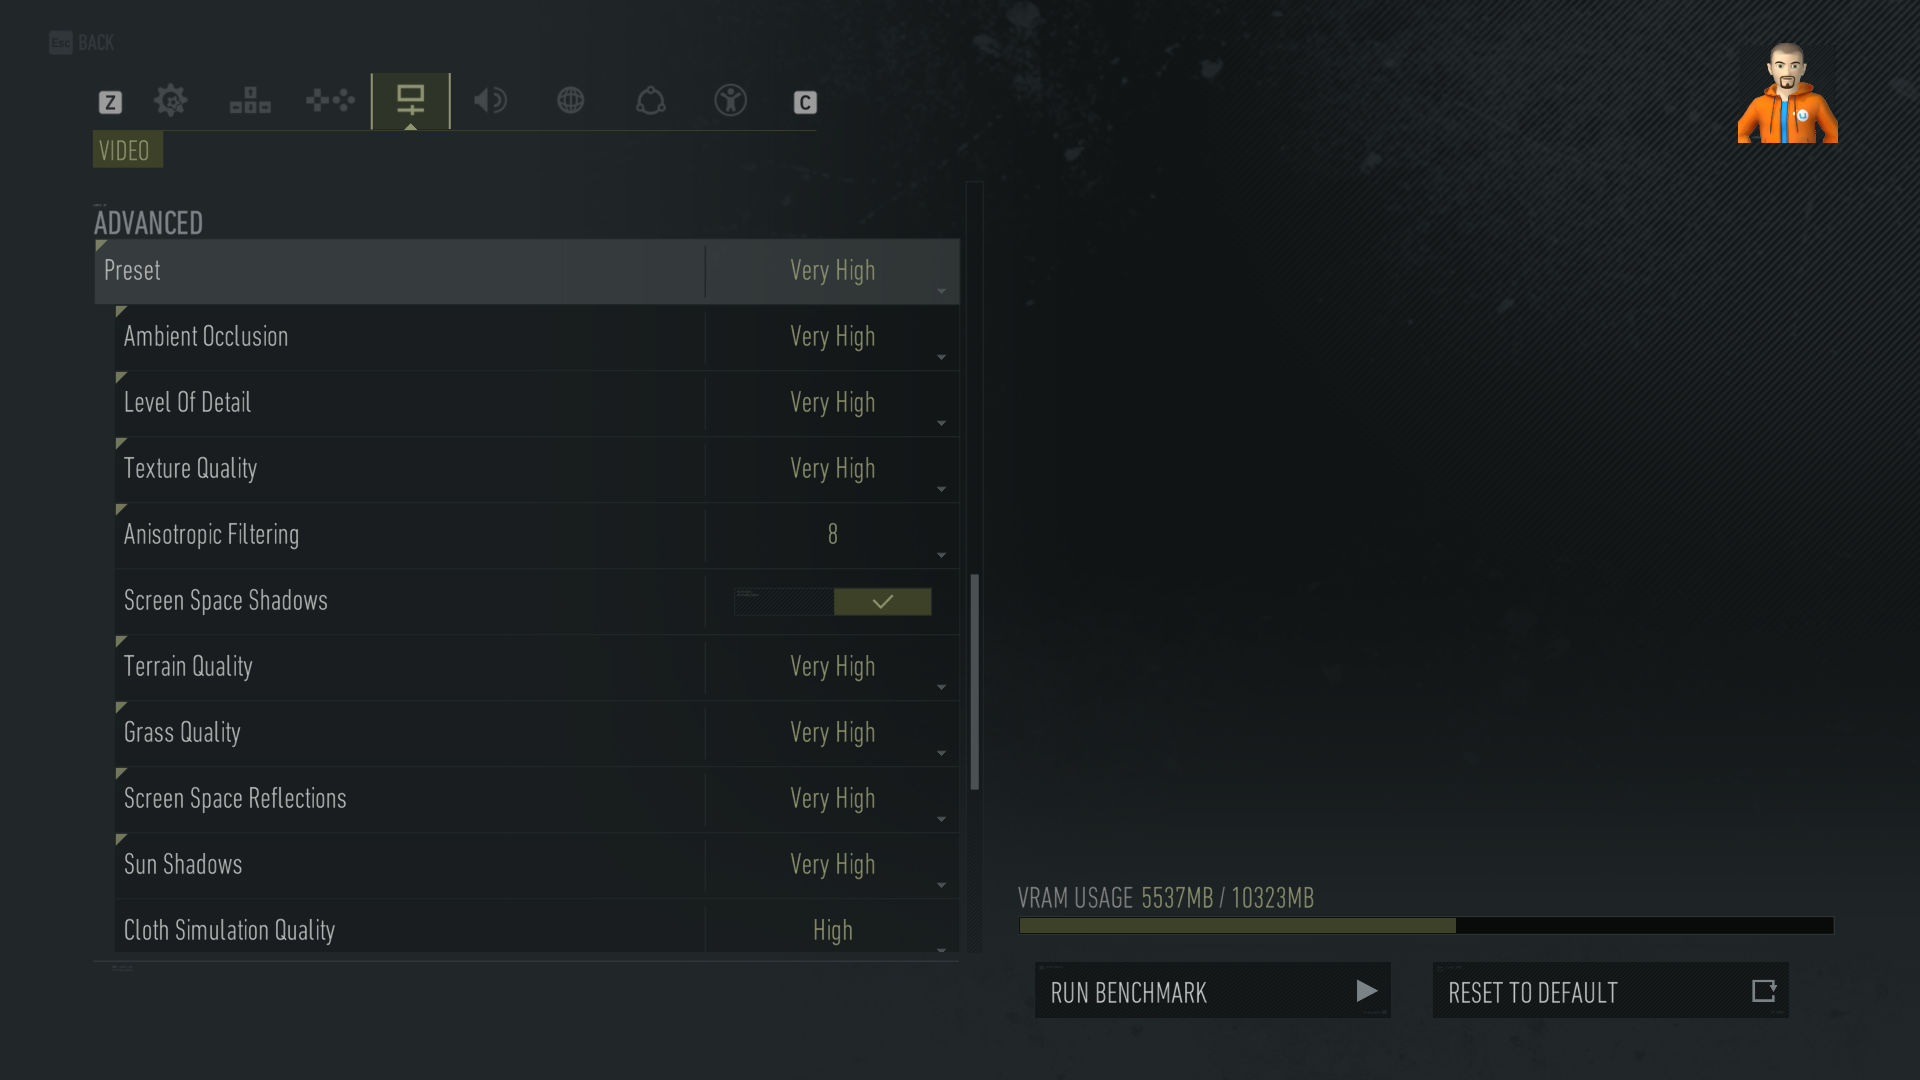
Engine: AnvilNext 2.0. We test using the Very High preset, with AA disabled, Vulkan API.
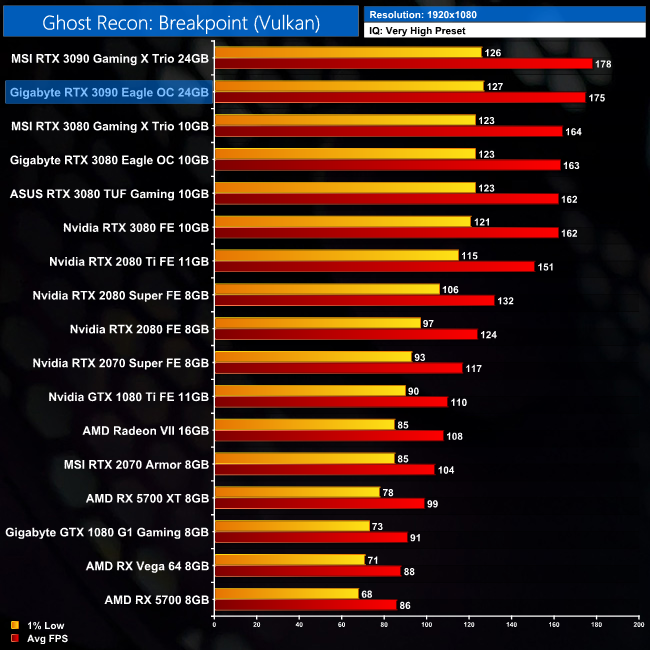
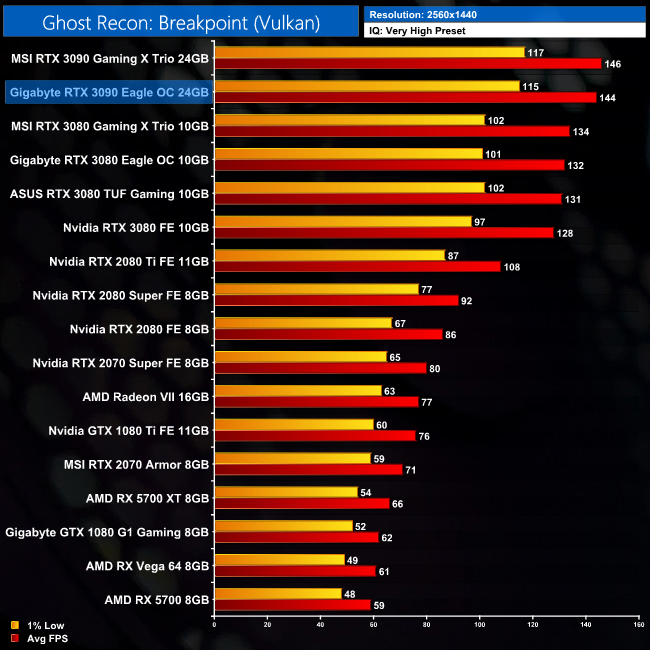

At 4K, the RTX 3090 Eagle averages 86FPS, making it 11FPS – or 15% – faster than the RTX 3080. This is the joint-biggest relative performance increase we saw across our testing.
Metro Exodus is a first-person shooter video game developed by 4A Games and published by Deep Silver in 2019. It is the third instalment in the Metro video game series based on Dmitry Glukhovsky's novels, following the events of Metro 2033 and Metro: Last Light. (Wikipedia).
Engine: 4A Engine. We test using the Ultra preset, but with Hairworks and Advanced PhysX turned off, DX12 API.
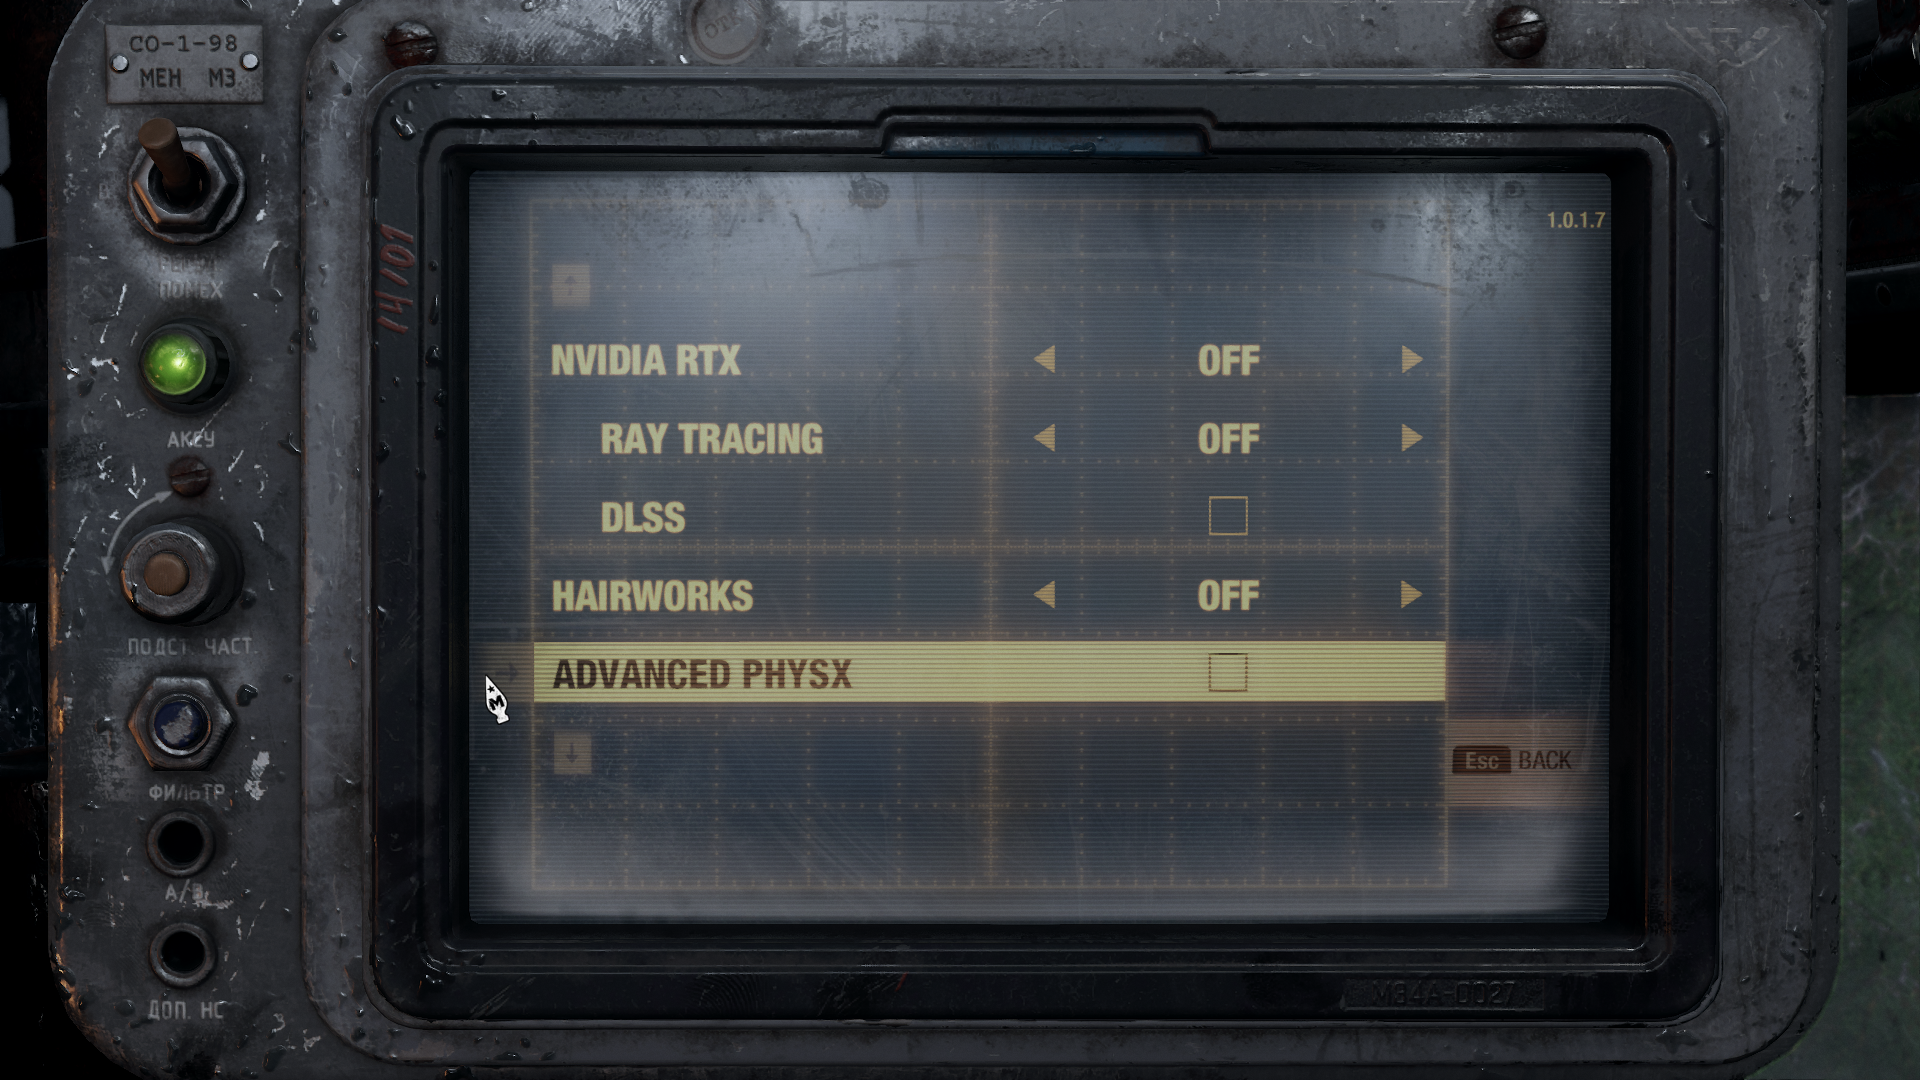
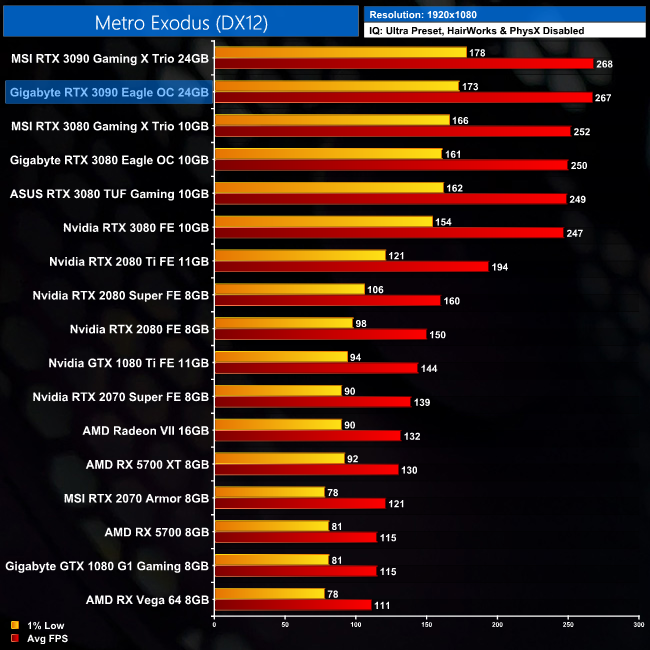
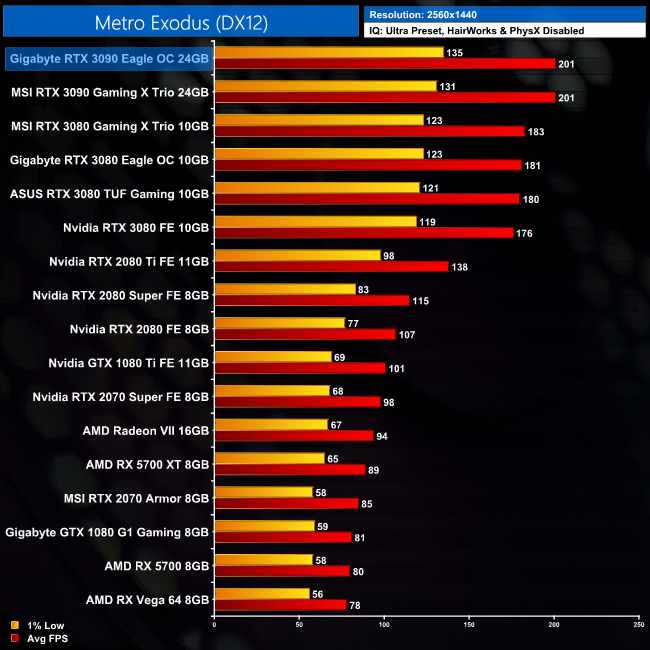
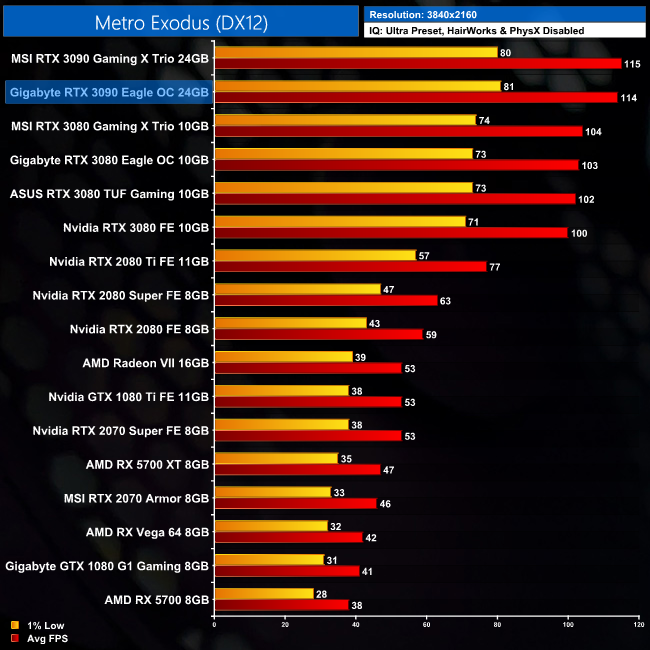
Metro Exodus is another game with frame rates pushing well over 100FPS at 4K. This time, the RTX 3090 Eagle is 14% faster than the RTX 3080 Founders Edition, and 48% ahead of the RTX 2080 Ti.
Middle-earth: Shadow of War is an action role-playing video game developed by Monolith Productions and published by Warner Bros. Interactive Entertainment. It is the sequel to 2014’s Middle-earth: Shadow of Mordor, and was released worldwide for Microsoft Windows, PlayStation 4, and Xbox One on October 10, 2017. (Wikipedia).
Engine: LithTech Firebird. We test using the Very High preset, DX11 API.
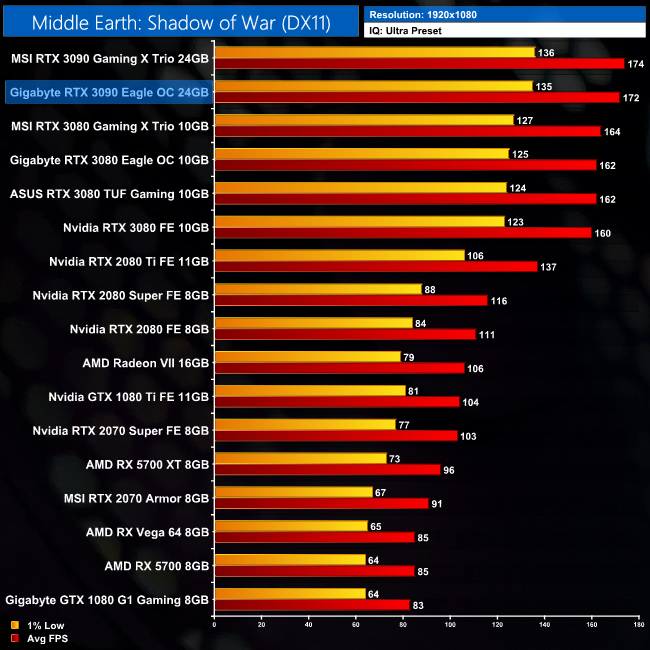
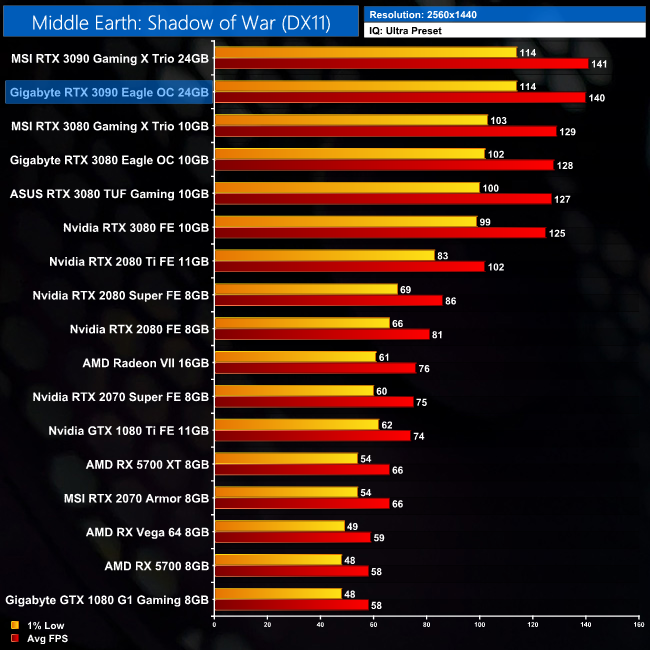
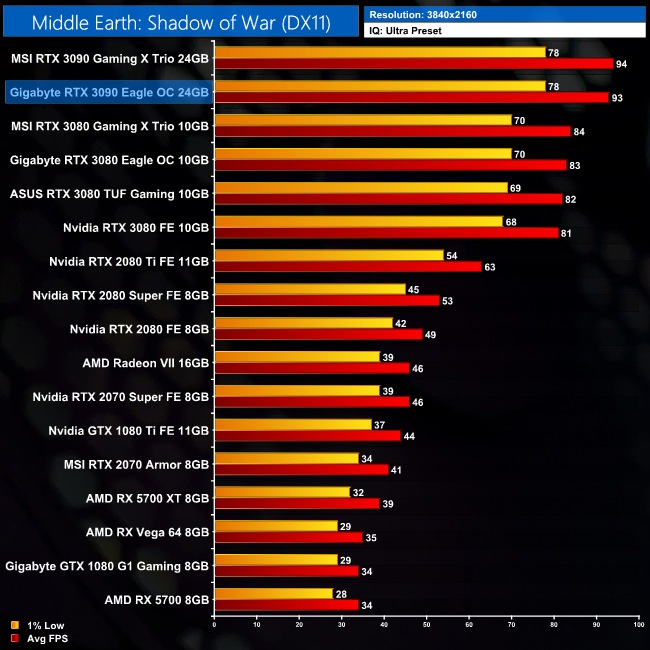
As for Middle Earth: Shadow of War, here the RTX 3090 isn't quite hitting 100FPS gameplay at 4K, but it's not far away. This is also the game, along with Ghost Recon: Breakpoint, where we see 15% gains for the RTX 3090 versus the RTX 3080 Founders Edition, the biggest relative difference across all of our games today.
Red Dead Redemption 2 is a 2018 action-adventure game developed and published by Rockstar Games. The game is the third entry in the Red Dead series and is a prequel to the 2010 game Red Dead Redemption. Red Dead Redemption 2 was released for the PlayStation 4 and Xbox One in October 2018, and for Microsoft Windows and Stadia in November 2019. (Wikipedia).
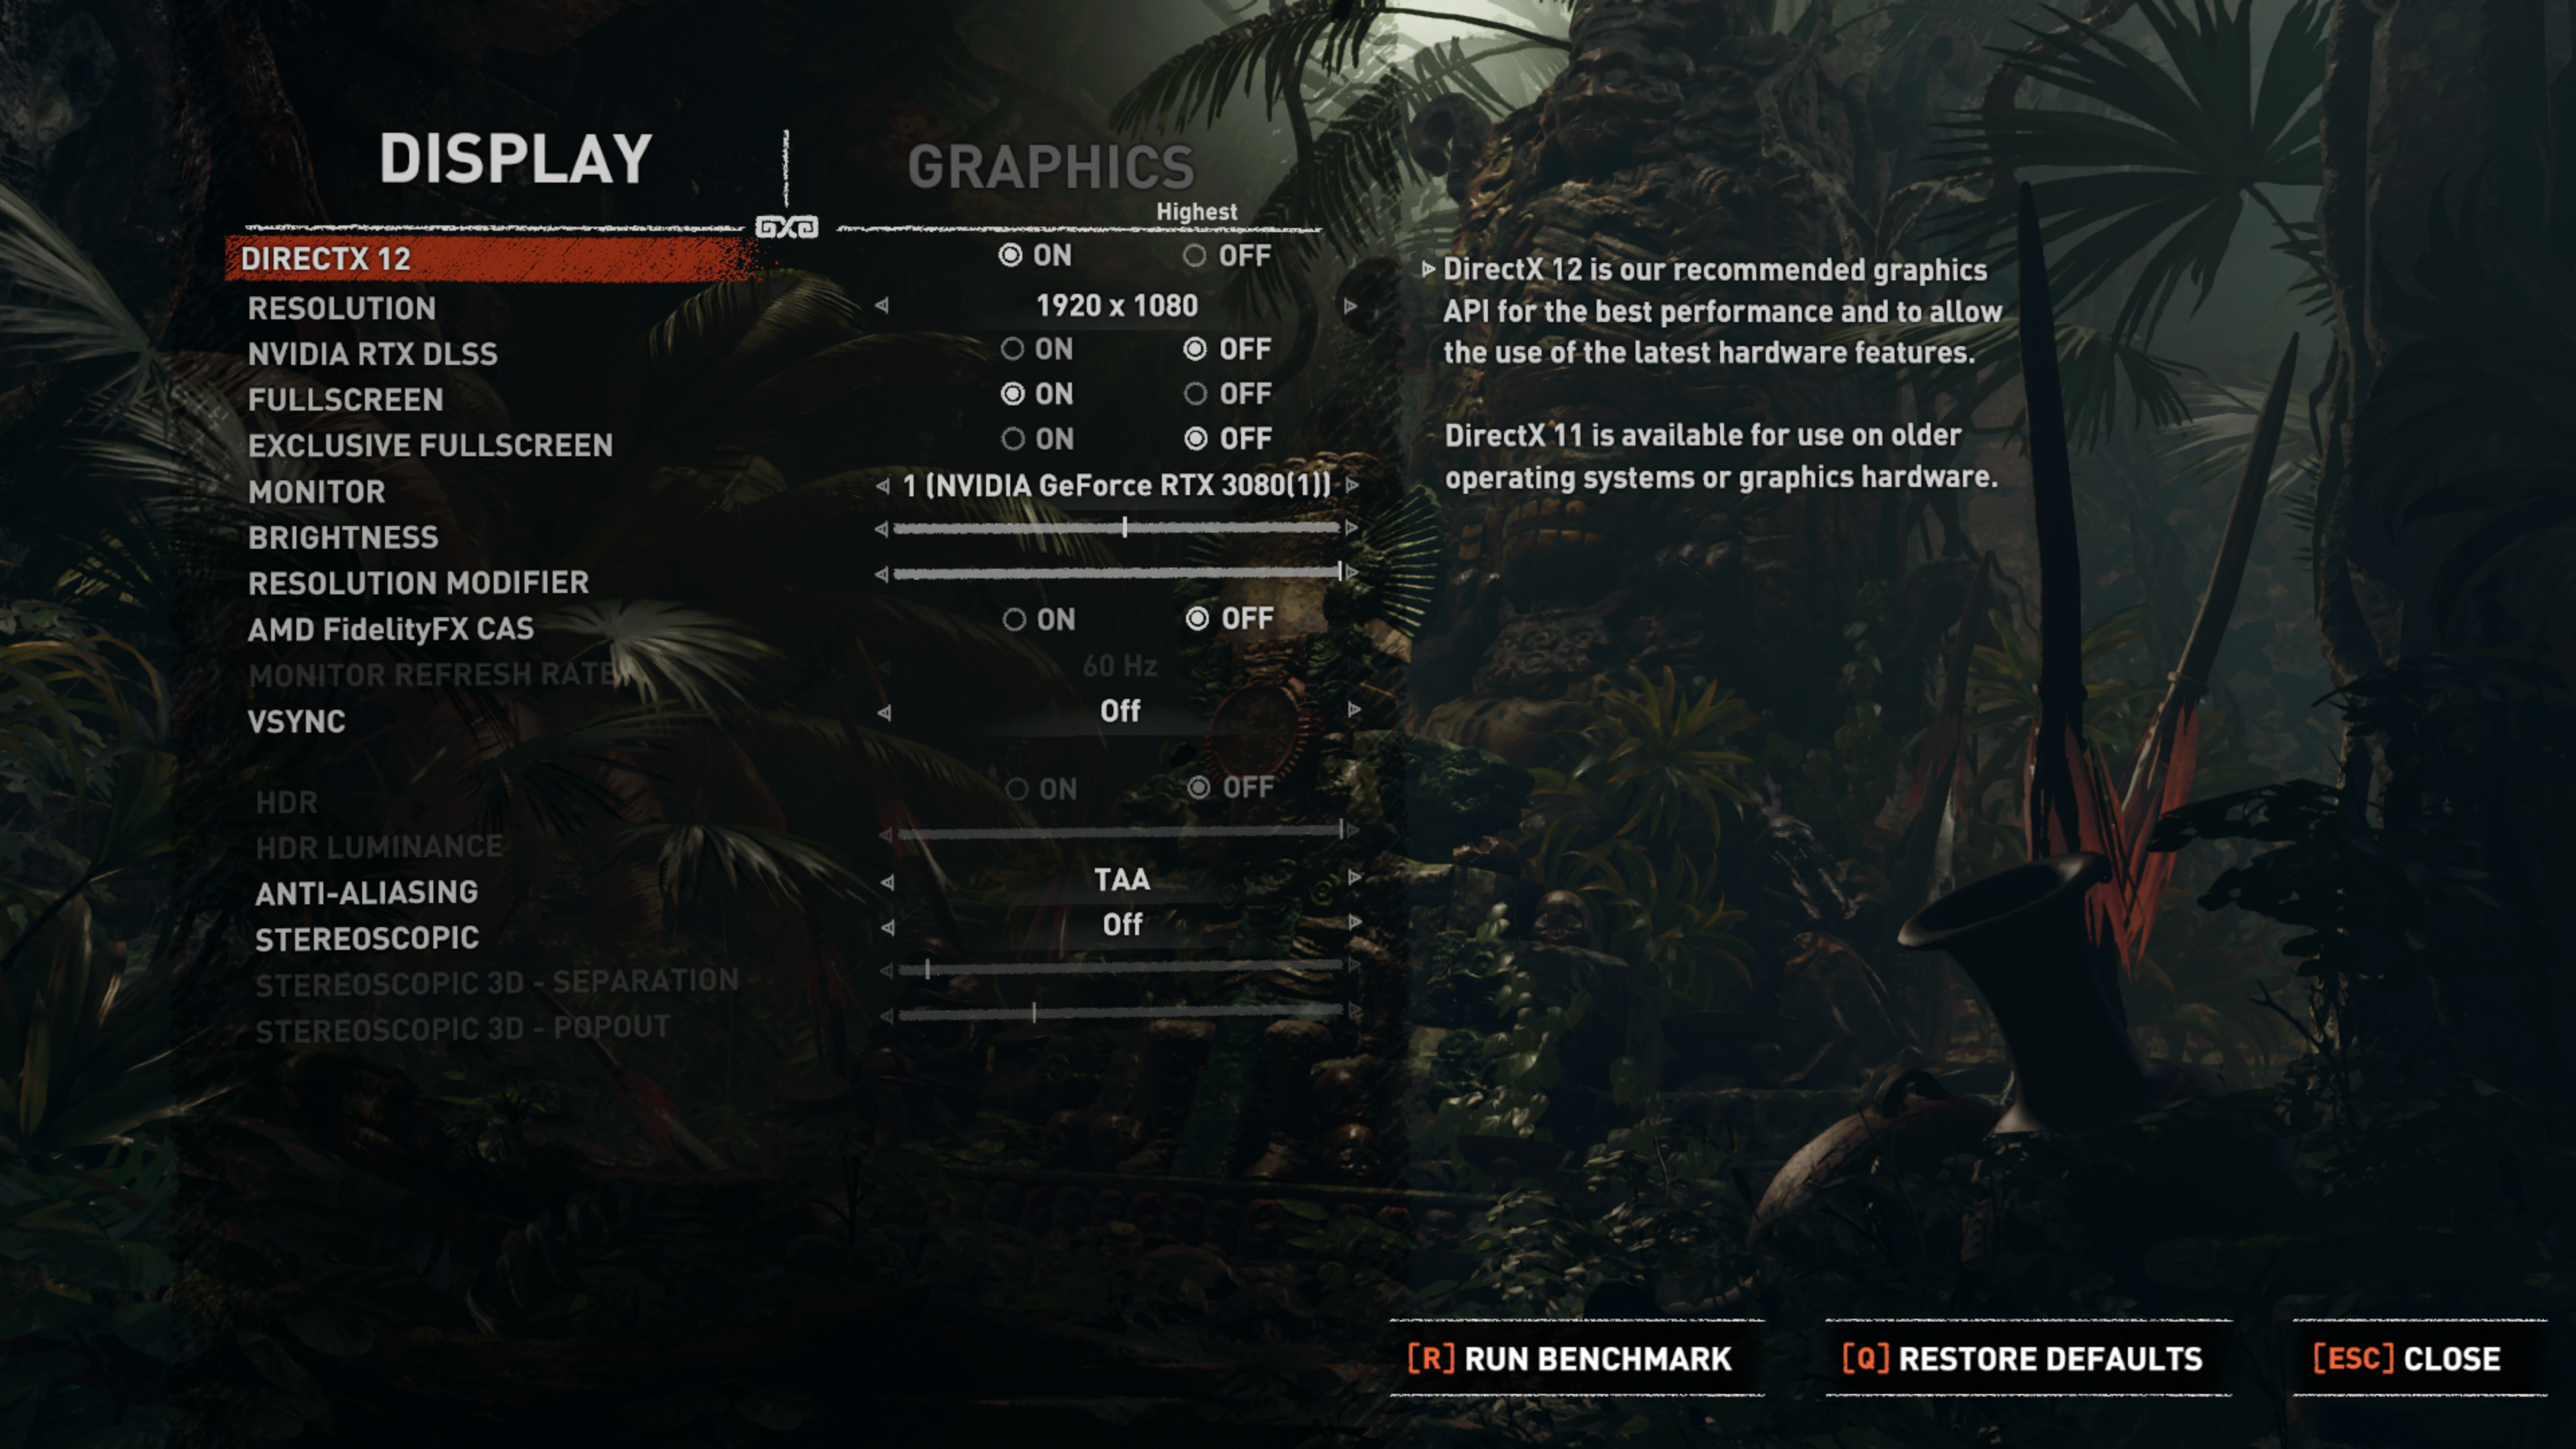
Engine: Rockstar Advance Game Engine (RAGE). We test by manually selecting High settings, not using a preset, including TAA, Vulkan API.
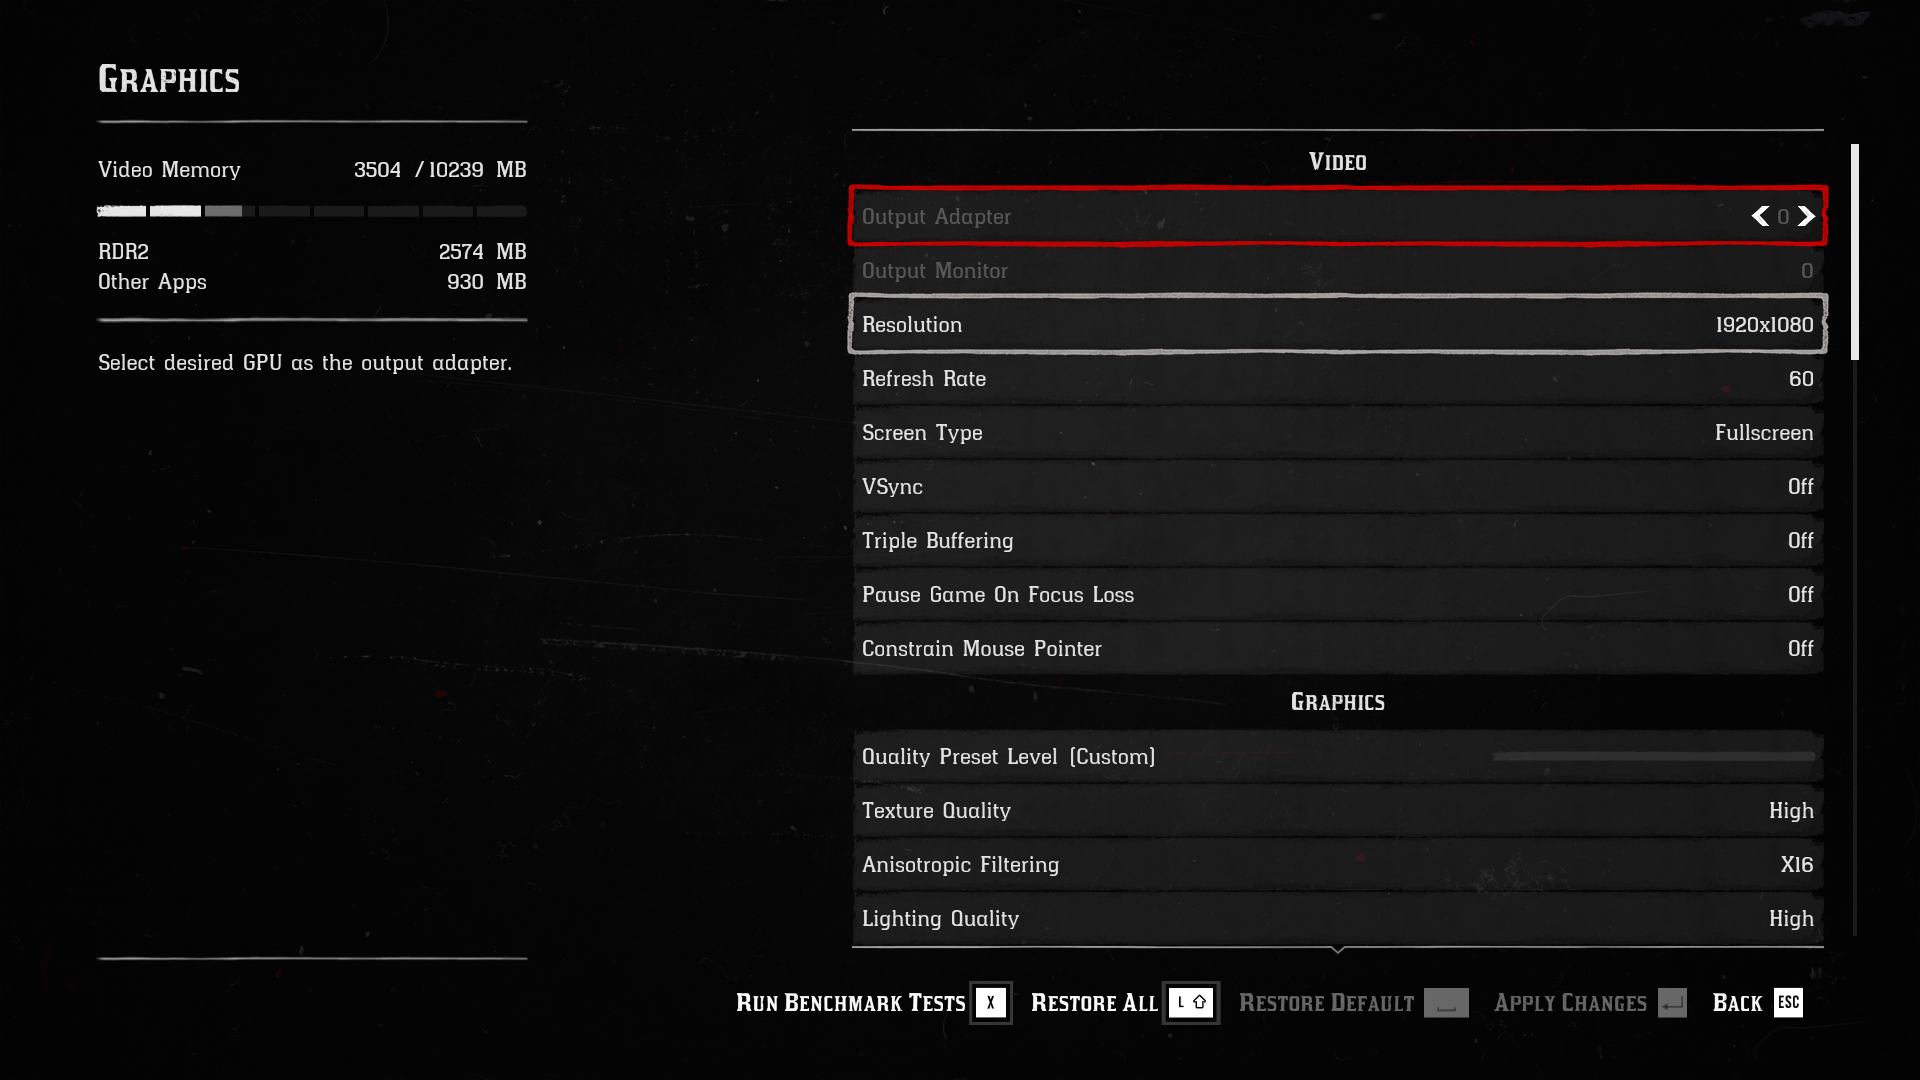
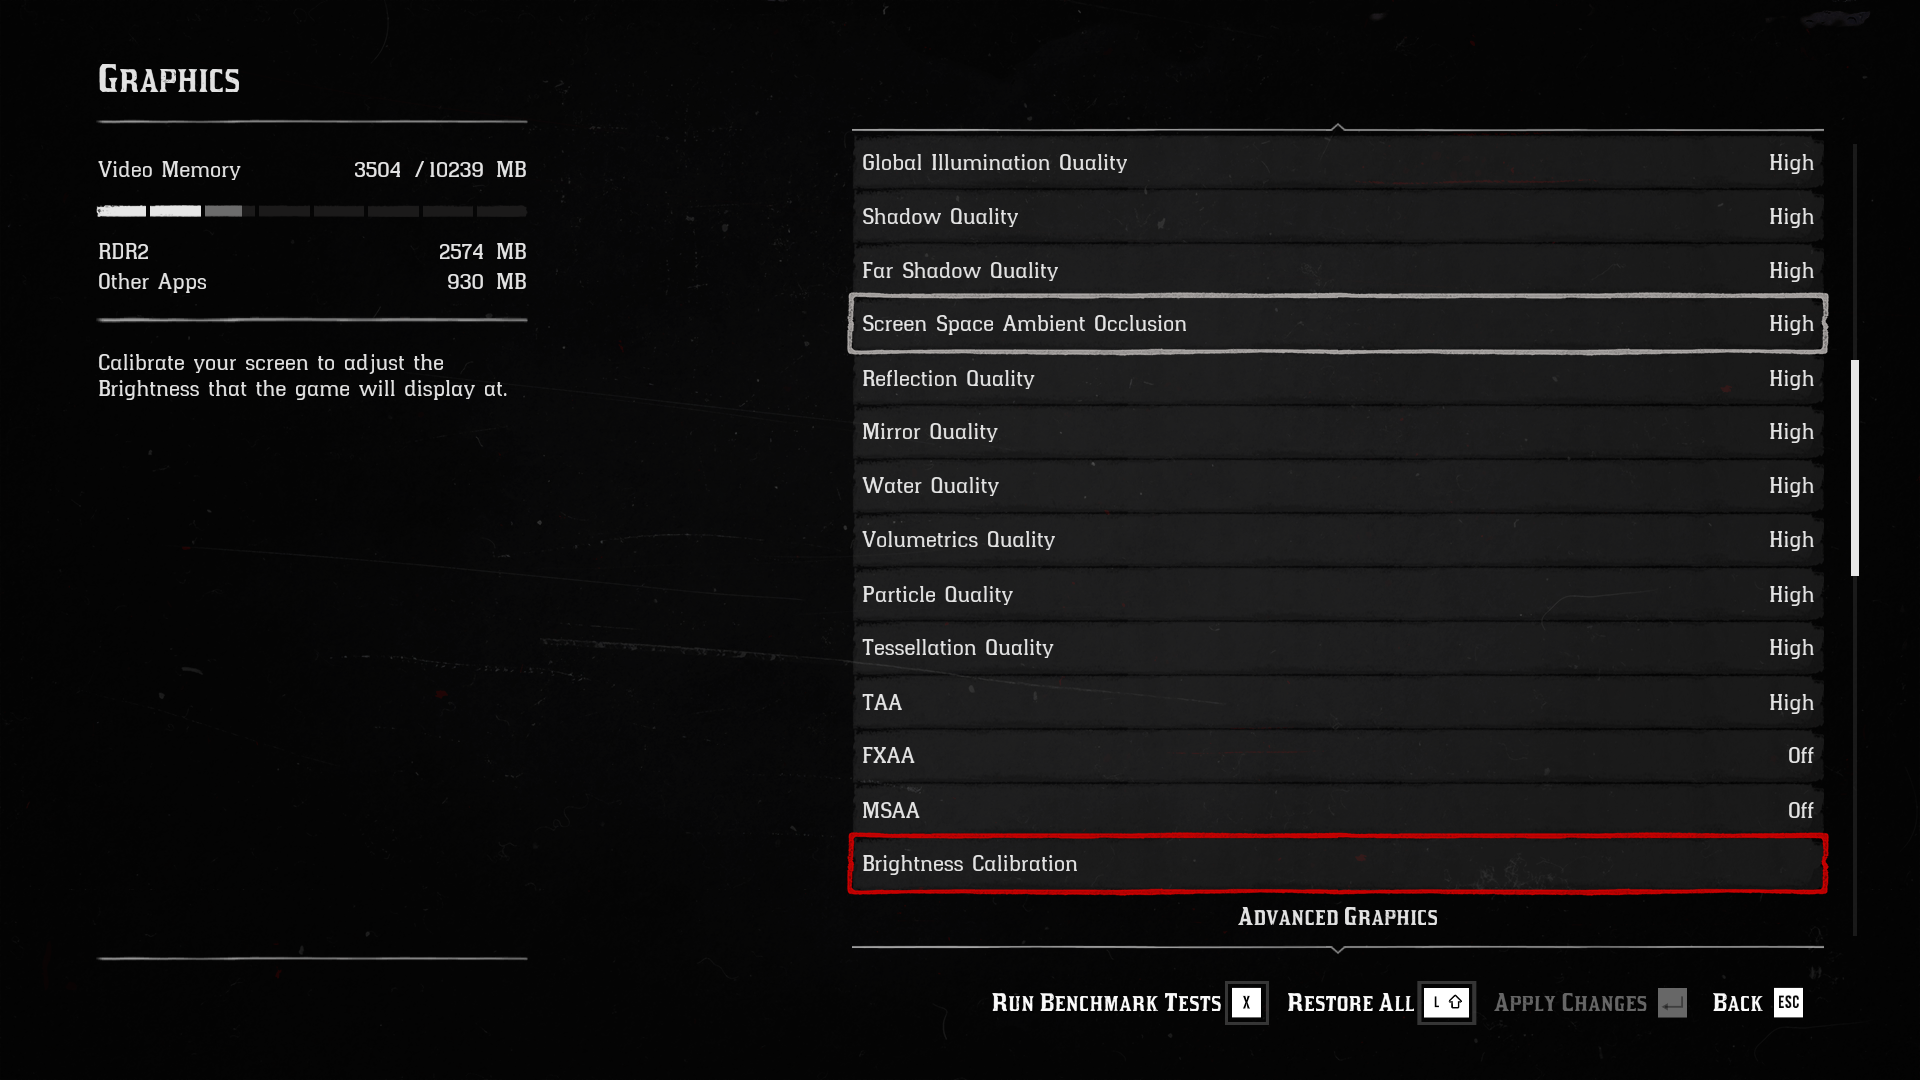
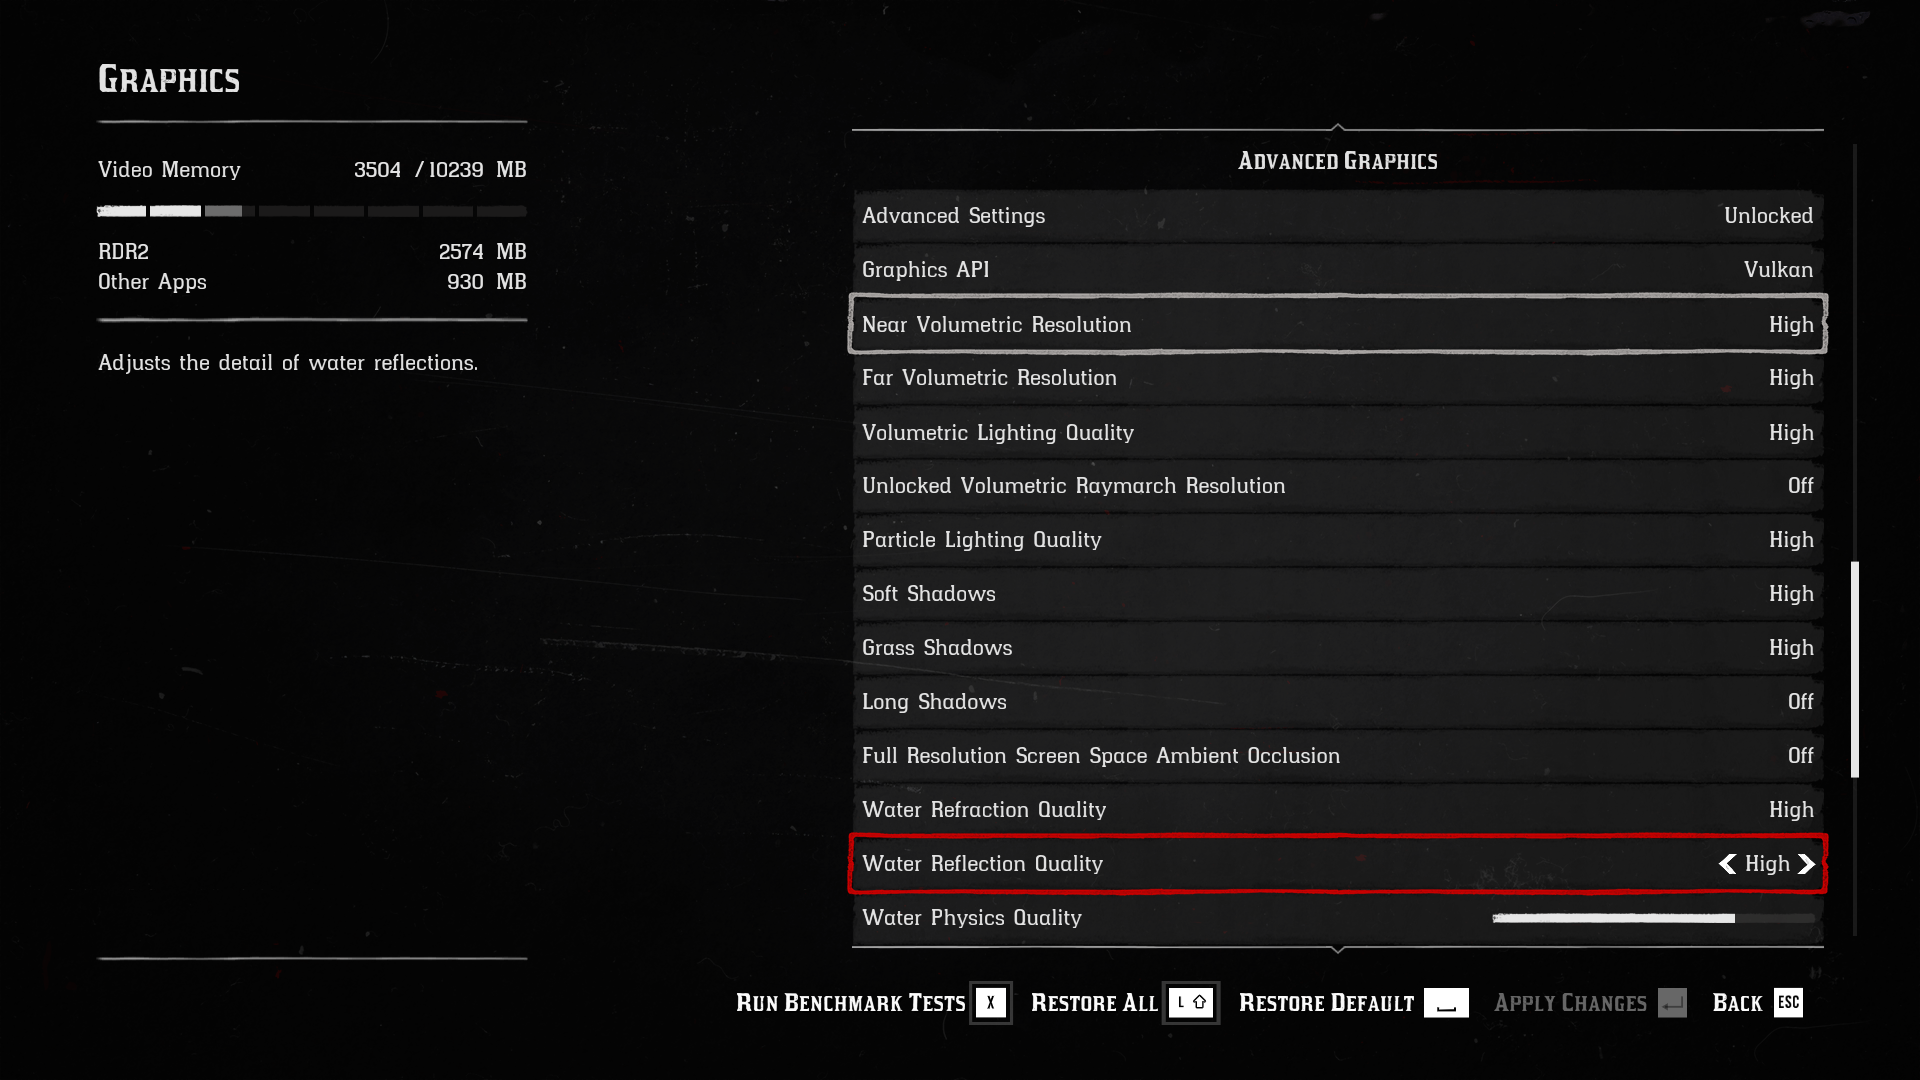
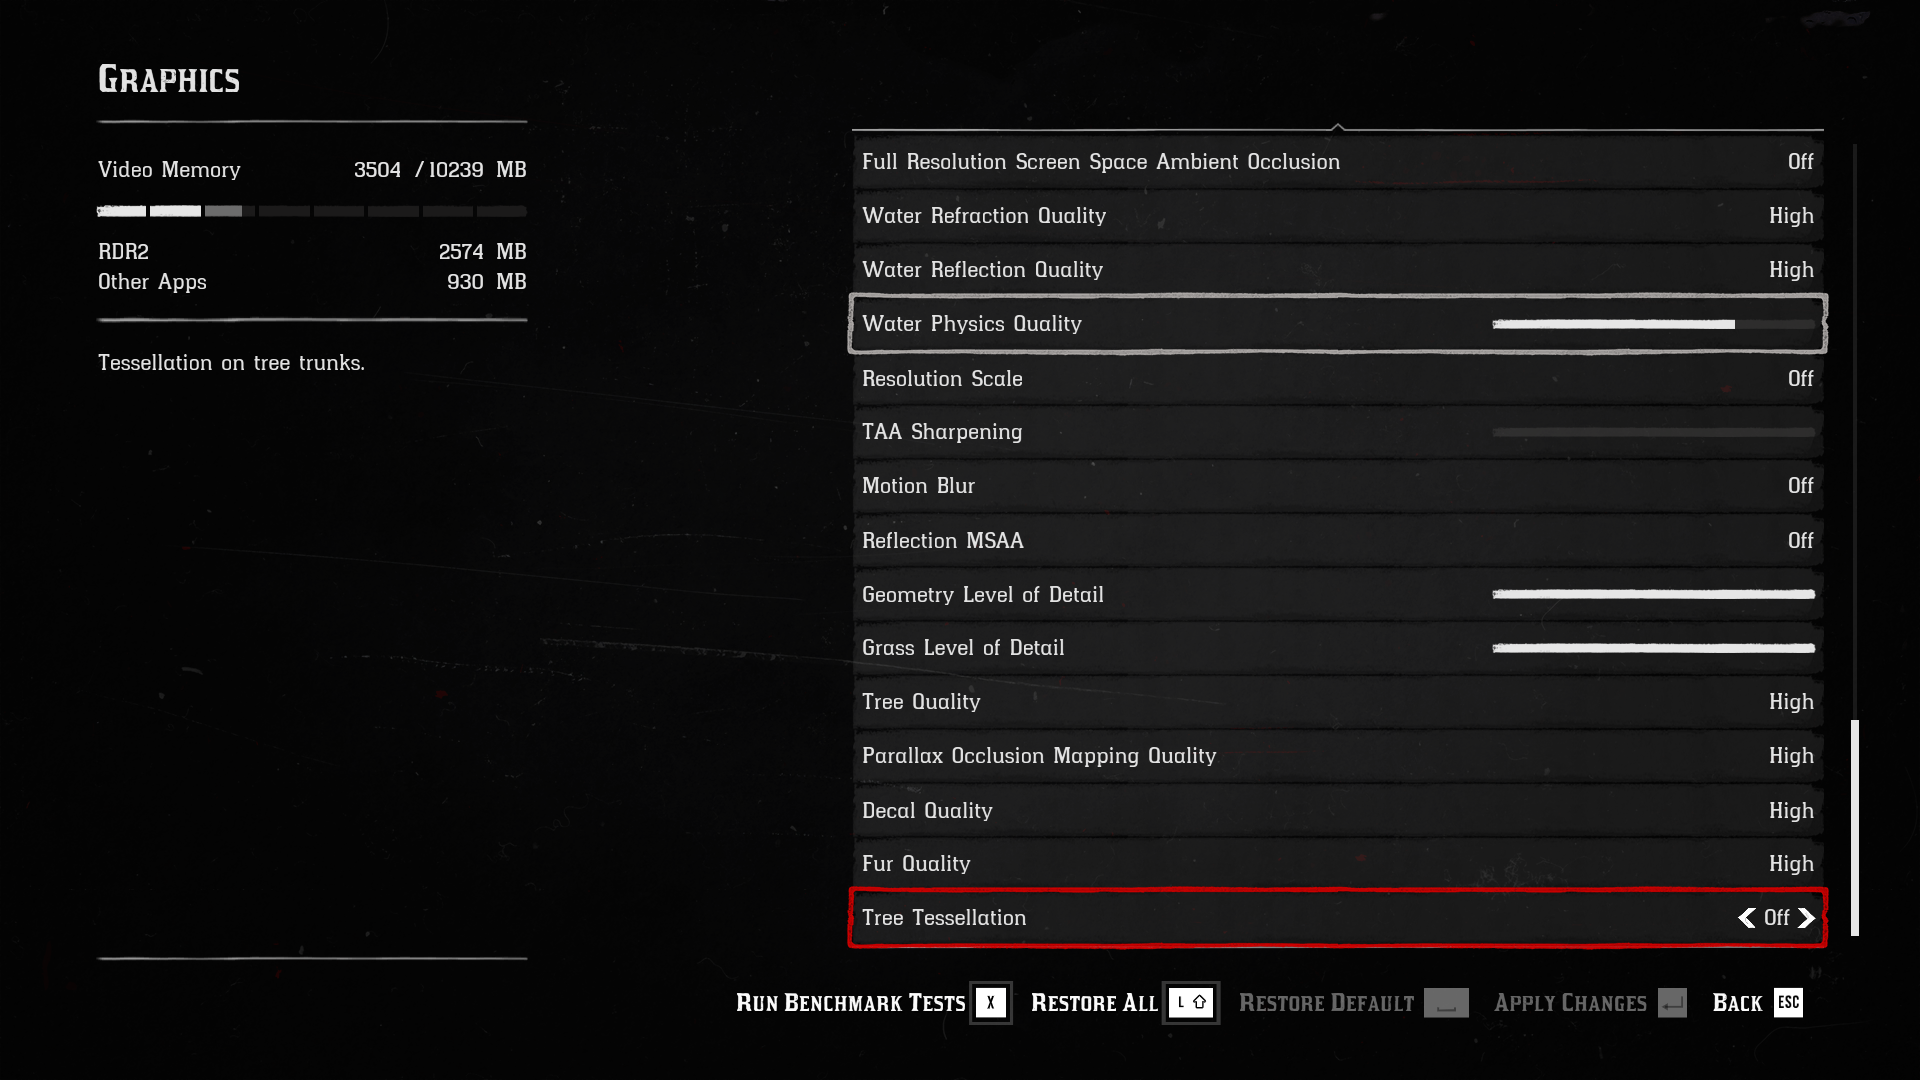
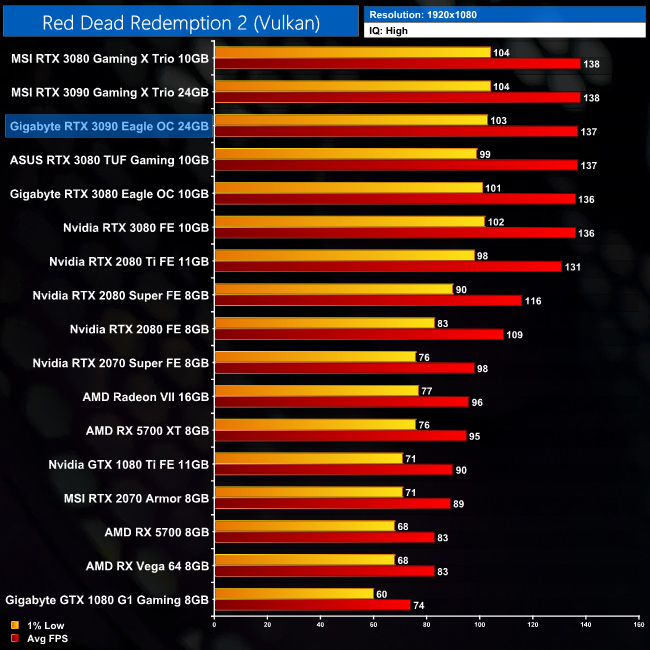
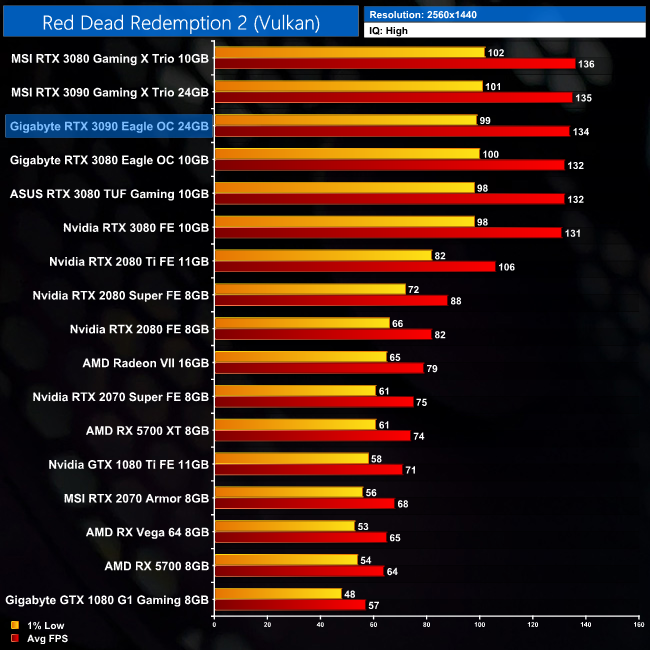
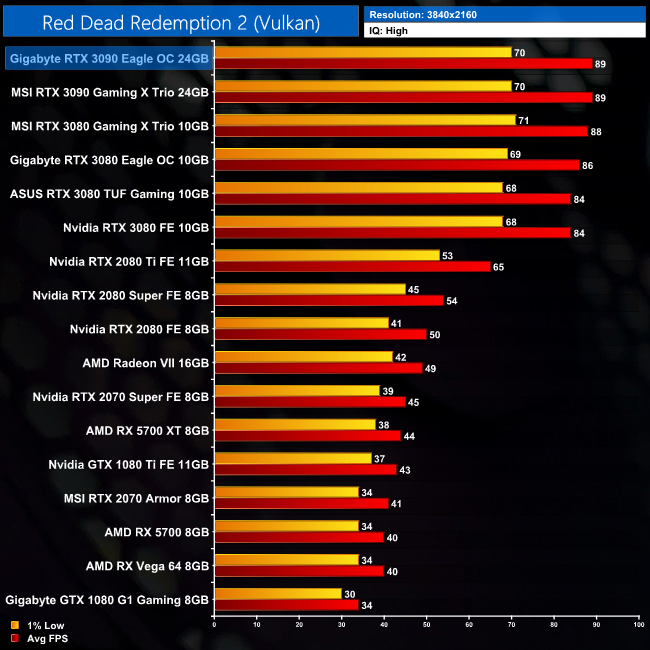
Read Dead Redemption 2 brought about some interesting results. It would seem at 4K, using High settings, the RTX 3090 is limited by something other than its GPU horsepower – here it's just 6% faster than the RTX 3080 Founders Edition, while this gap is even smaller when compared to some of the factory overclocked RTX 3080s we have tested.
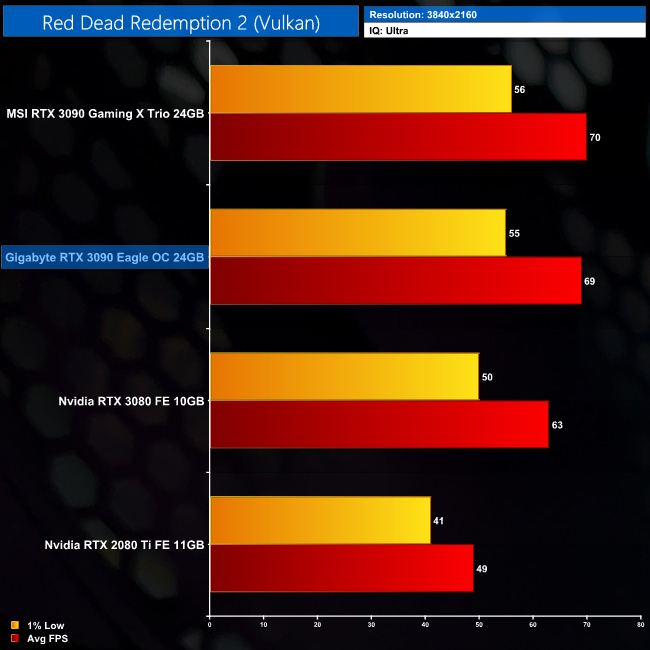
I wondered if this was a result of using High settings, and that is certainly part of it – when we retested using Ultra settings, the 3090 is more like 10 or 11% faster than the RTX 3080 at 4K. It’s still not as big a difference as we have seen from the other games we have tested, but it’s something to be aware of, and we will be re-testing the rest of our GPUs with Ultra settings going forward, to make sure we’re not hitting bottlenecks elsewhere.
Shadow of the Tomb Raider is an action-adventure video game developed by Eidos Montréal in conjunction with Crystal Dynamics and published by Square Enix. It continues the narrative from the 2013 game Tomb Raider and its sequel Rise of the Tomb Raider, and is the twelfth mainline entry in the Tomb Raider series. The game released worldwide on 14 September 2018 for Microsoft Windows, PlayStation 4 and Xbox One. (Wikipedia).
Engine: Foundation Engine. We test using the Highest preset, with TAA, DX12 API.
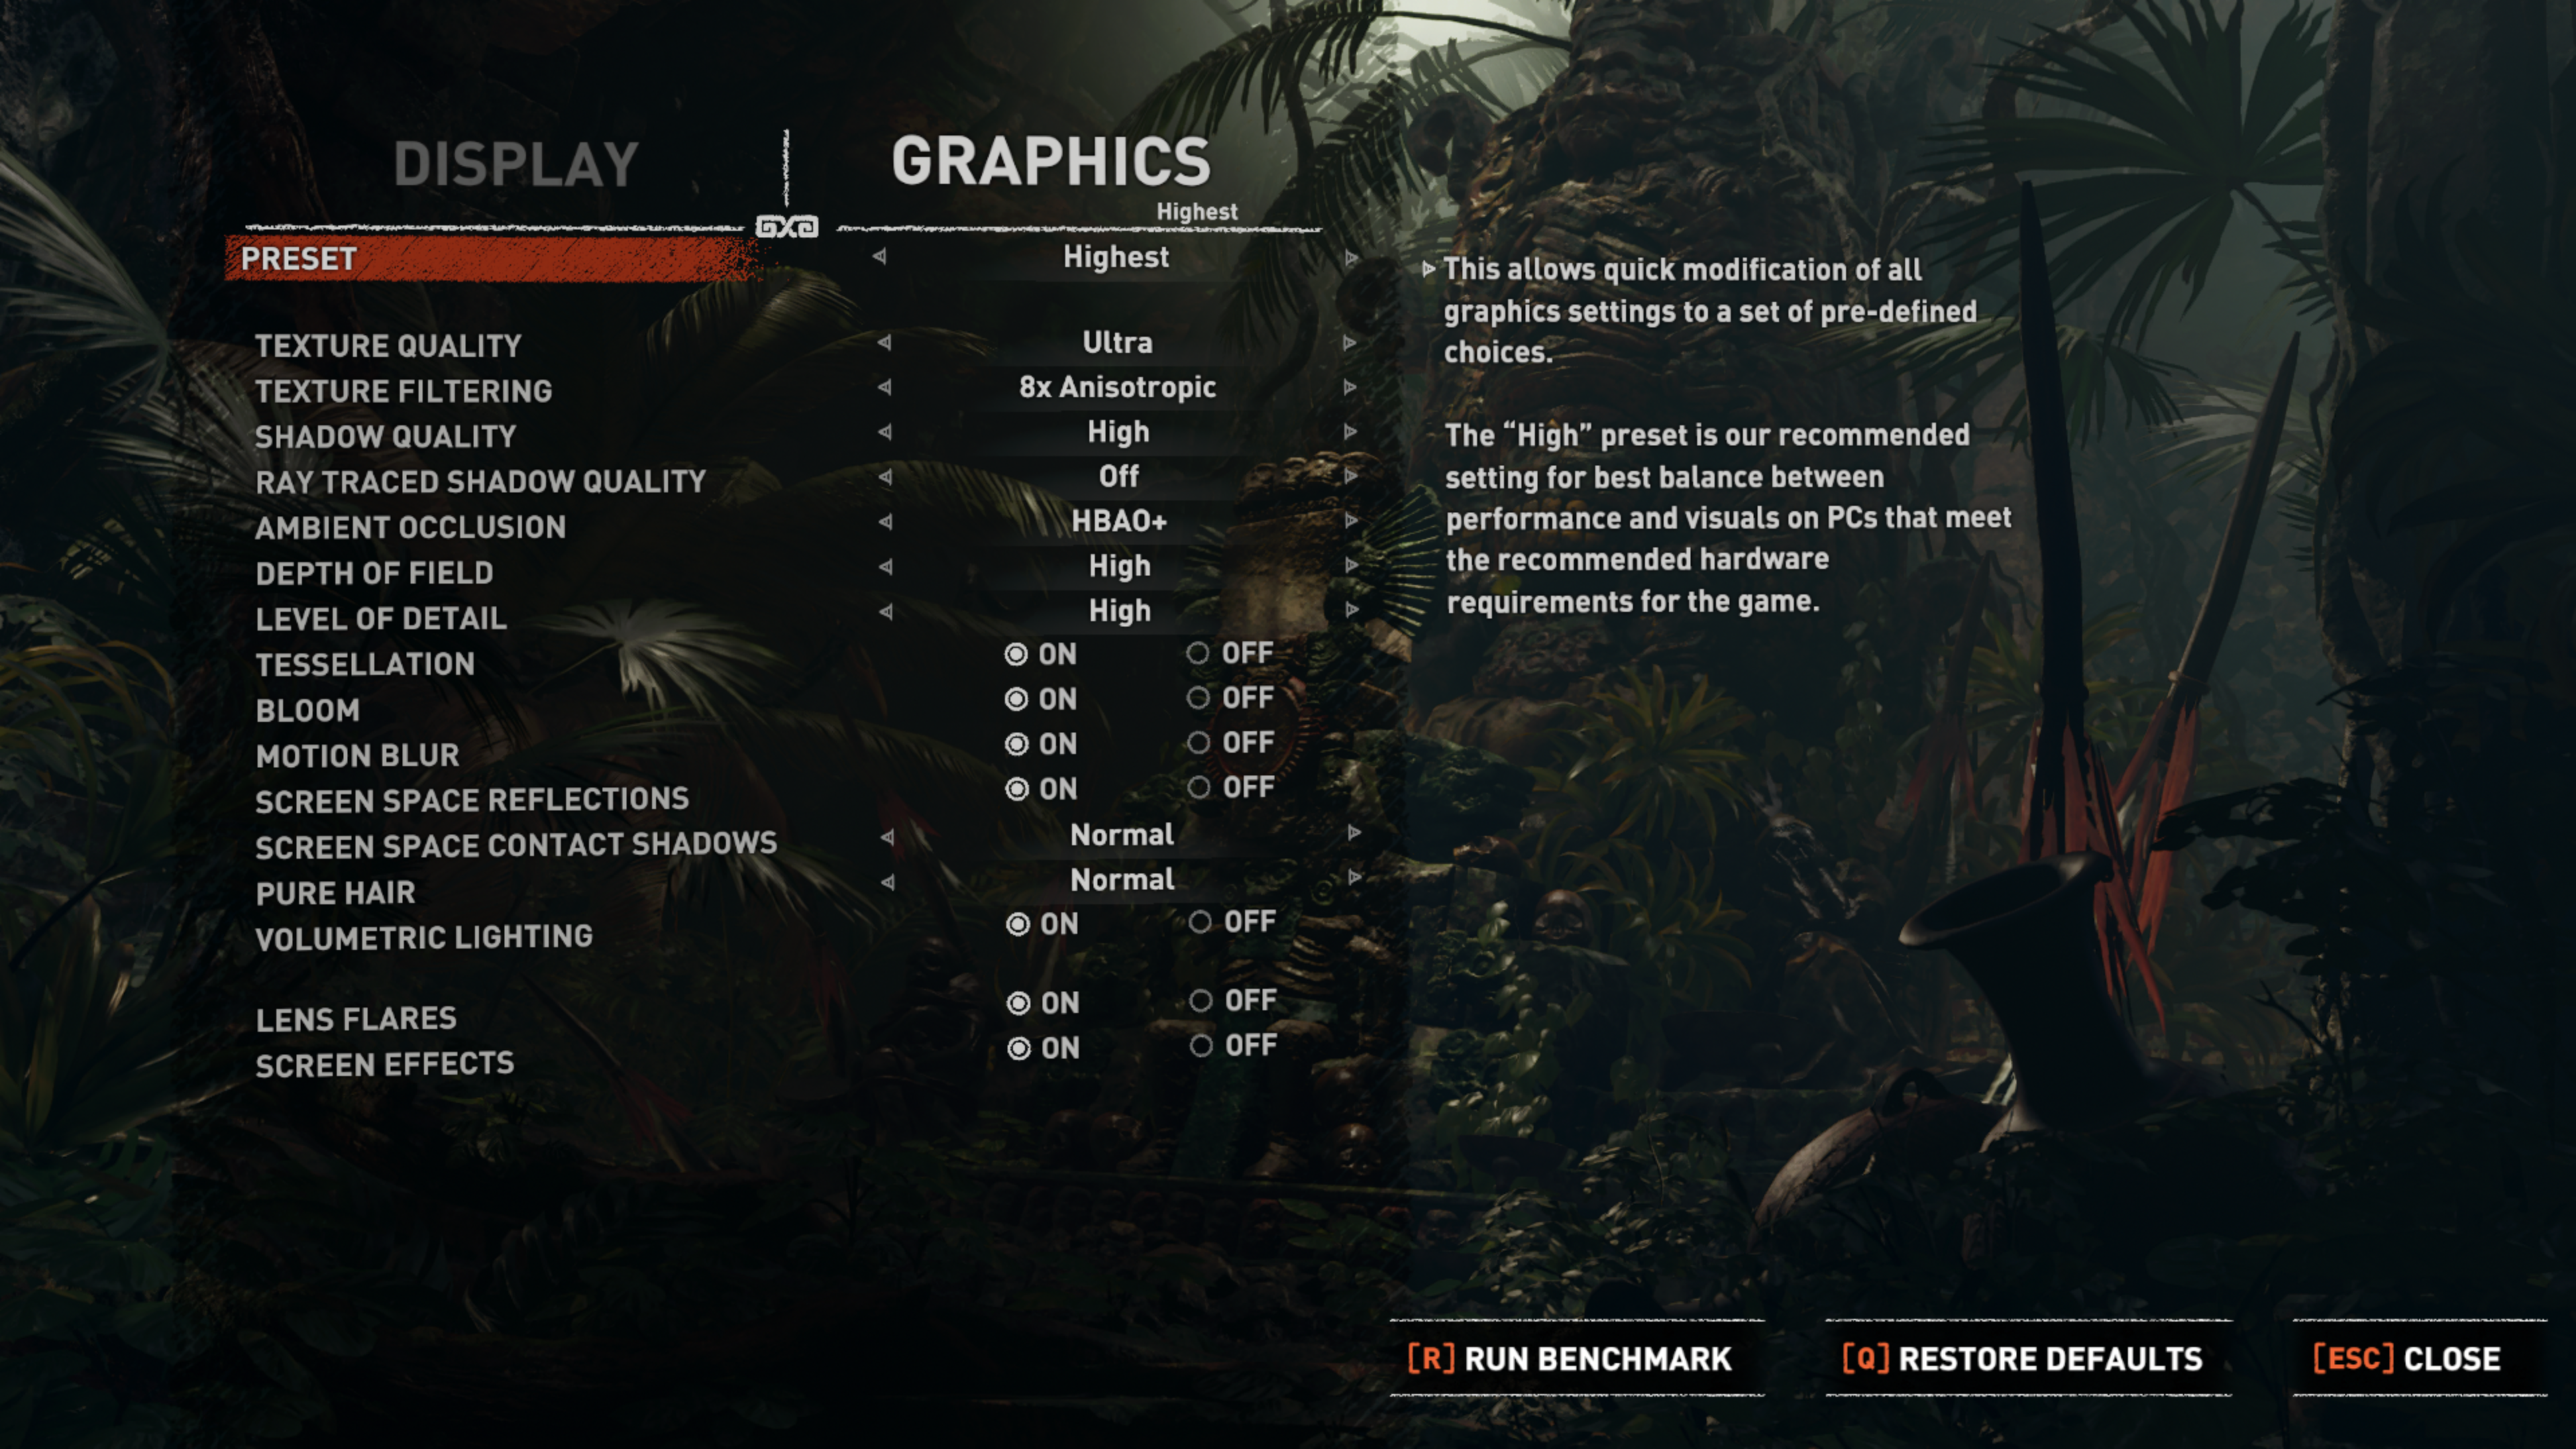
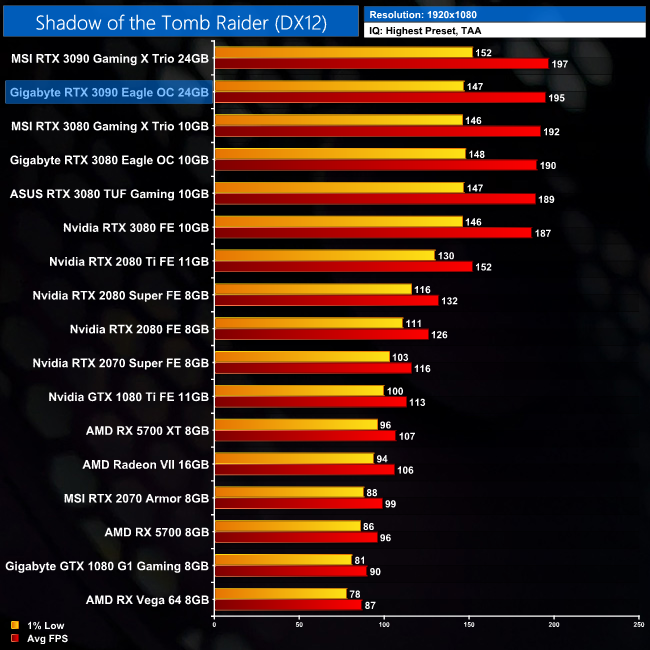
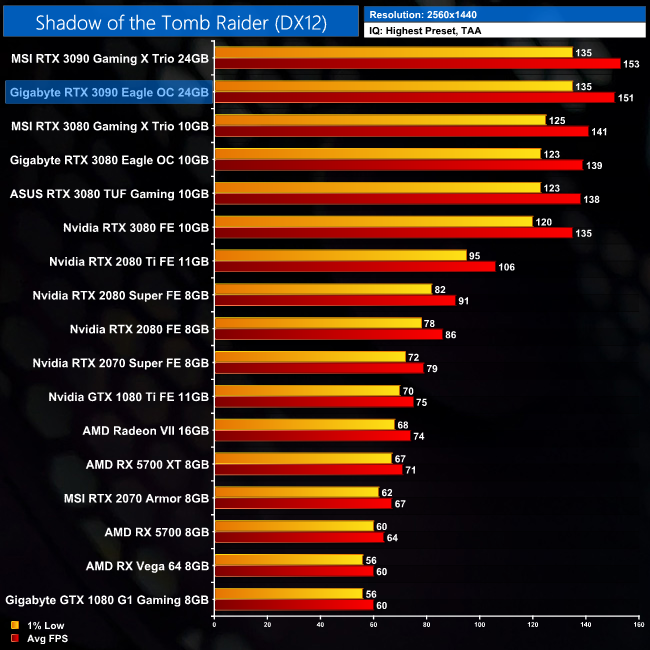
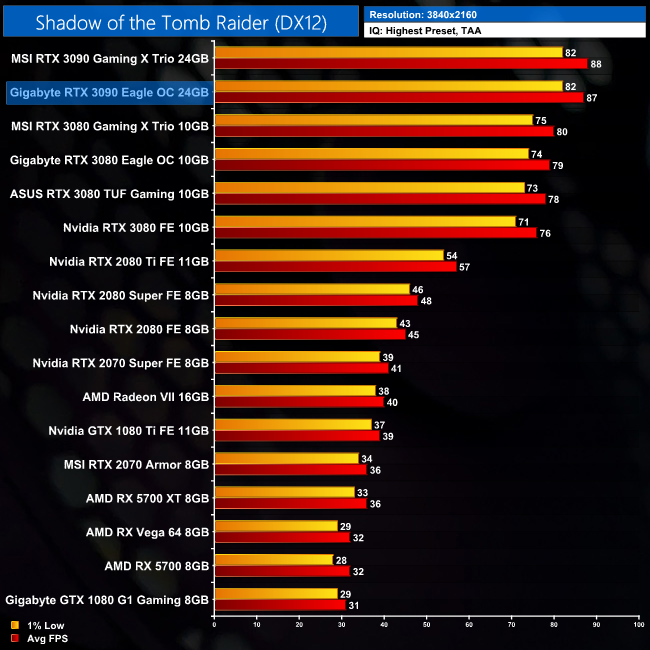
Shadow of the Tomb Raider puts us firmly back on trend, and at 4K the RTX 3090 Eagle comes in 14% faster than the RTX 3080 Founders Edition.
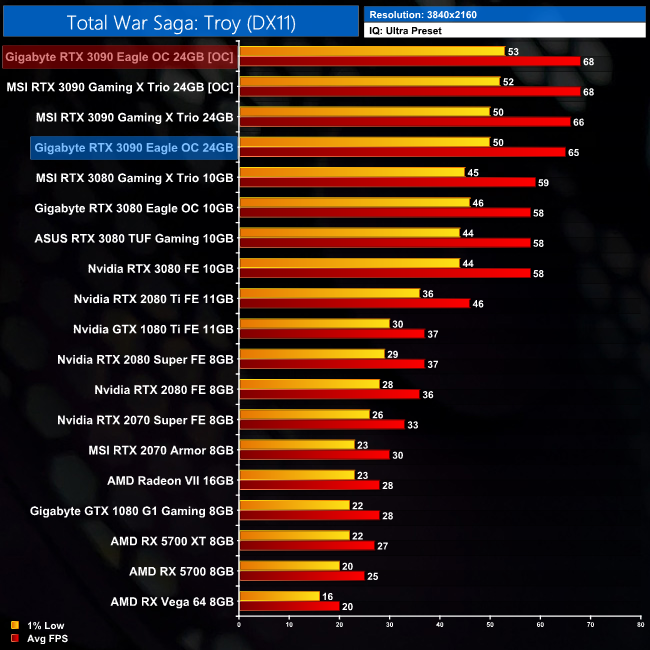
Total War Saga: Troy is a 2020 turn-based strategy video game developed by Creative Assembly Sofia and published by Sega. The game was released for Windows on 13 August 2020 as the second instalment in the Total War Saga subseries, succeeding Thrones of Britannia (2018). (Wikipedia).
Engine: TW 3 Engine. We test using the Ultra preset, DX11 API.
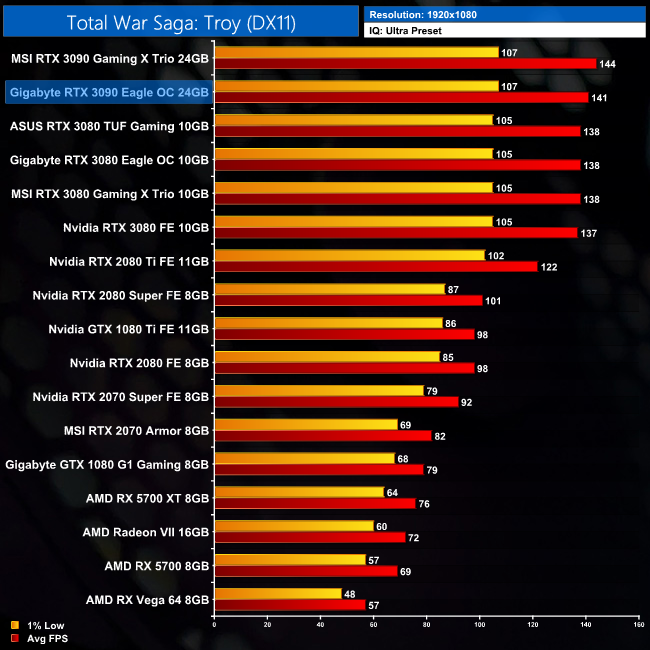
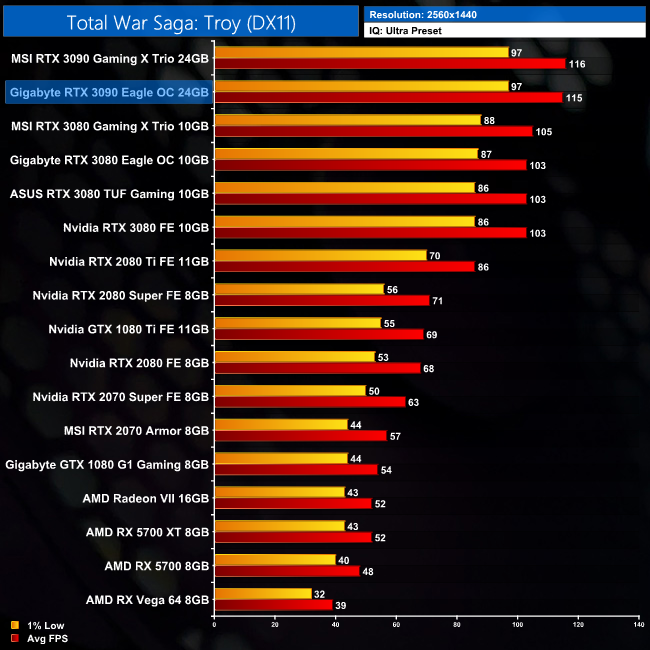
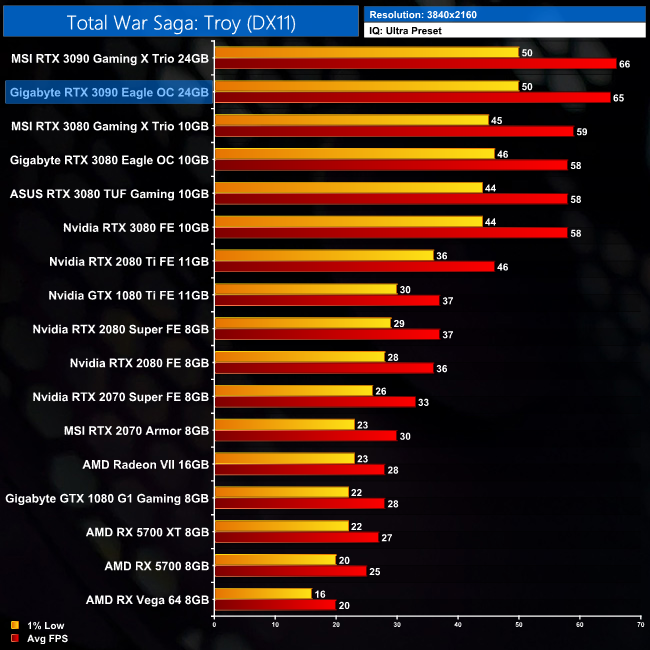
Our last game of the today is Total War Saga: Troy, a very tough challenge at 4K. The RTX 3090 Eagle averages 65FPS, an increase of 7FPS – or 12% – compared to the RTX 3080 Founders Edition. Compared to the RTX 2080 Ti, it's a relatively small increase of 41%.
Here we present frame rate figures for each graphics card, averaged across all 11 games on test today. These figures can disguise significant variations in performance from game to game, but provide a useful overview of the sort of performance you can expect at each resolution tested.
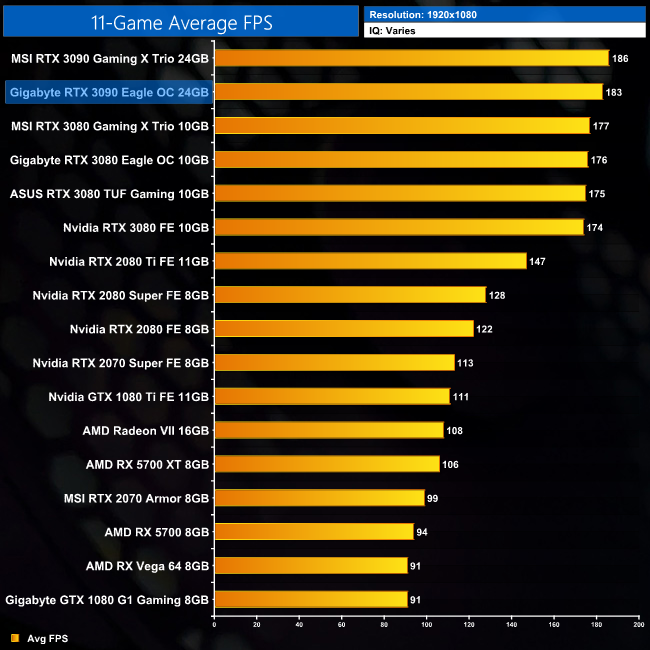
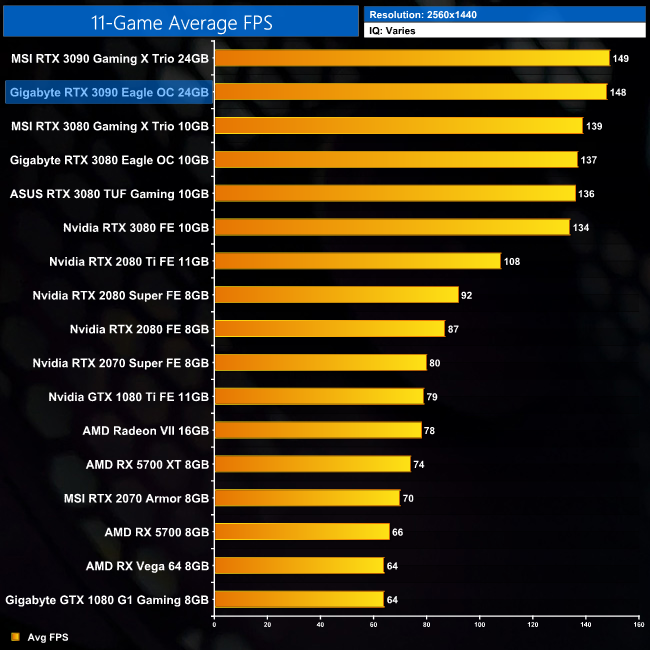
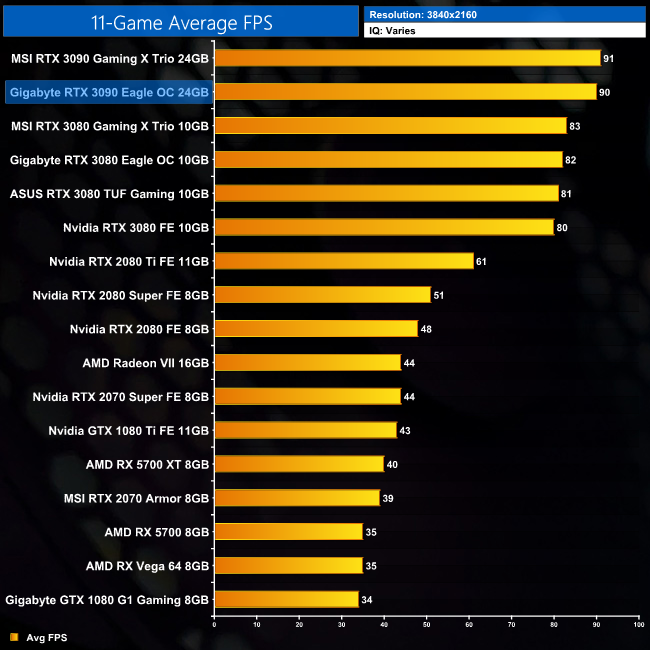
Users will get the most out of the RTX 3090 at 4K, of that there is no doubt. In fact, numerous titles that we tested today would benefit from a high refresh rate 4K monitor, as exemplified by the 4K average frame rate coming in at 90FPS. At 4K, the RTX 3090 Eagle is on average 13% faster than the RTX 3080 Founders Edition, and 48% faster than the RTX 2080 Ti.
Using the average frame rate data presented on the previous page, here we look at the cost per frame using the UK MSRP launch prices for each GPU.
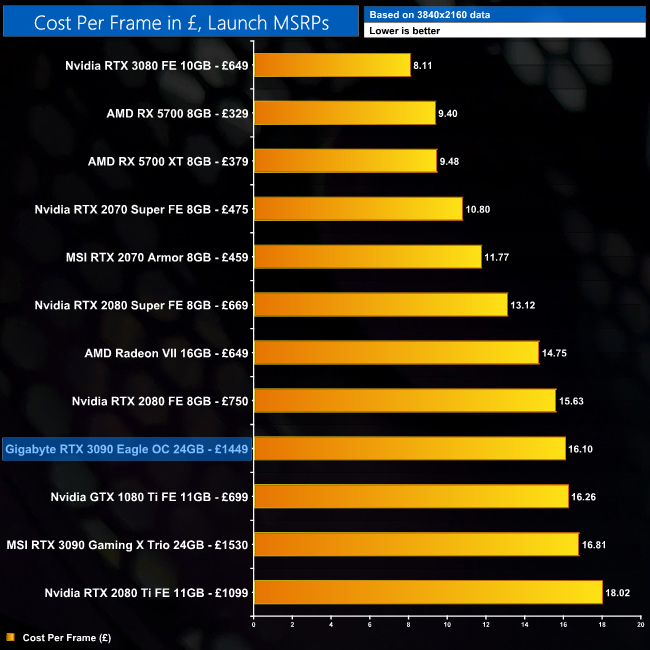
Overall value of the RTX 3090 is poor, of that there is no doubt – RTX 3080 is almost half as cheap in terms of its cost per frame. The irony is that, even at a price close to £1500, the GPU still delivers better value than the RTX 2080 Ti.
Here we revisit Control, this time testing with the in-game ray tracing effects set to their highest values.
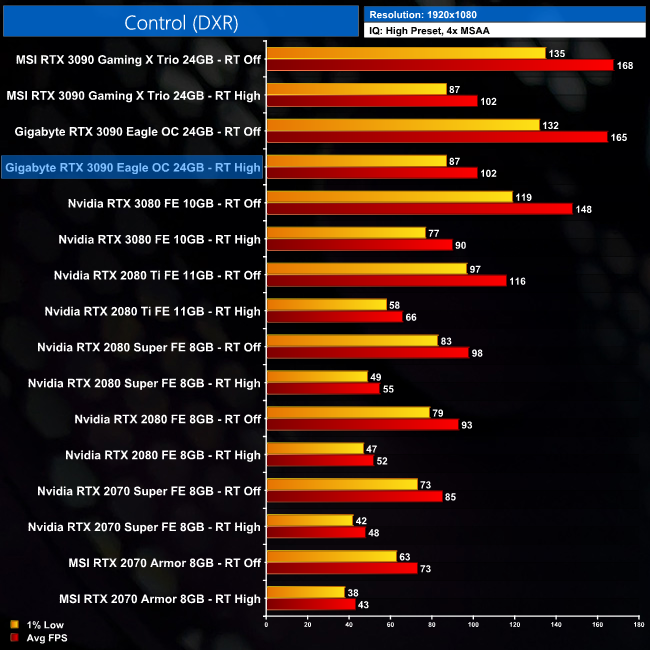
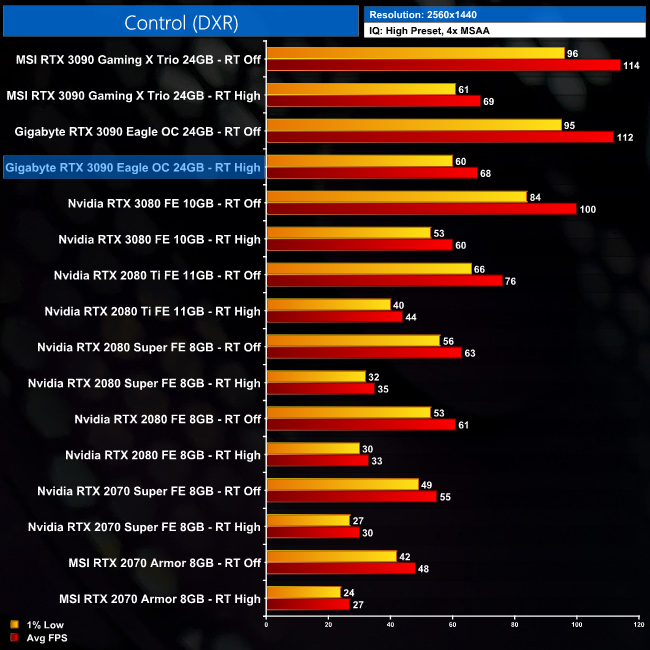
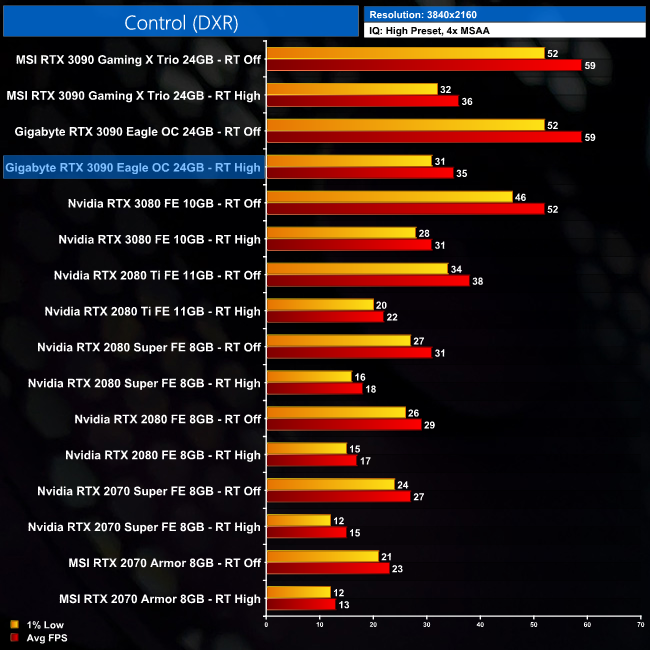
Looking at Control, cranking the RT settings to High in this game reduces frame rates to just over 30FPS at 4K. However, it is the margins we are interested in, and these don't change here, as the RTX 3090 Eagle is still 13% faster than the RTX 3080 Founders Edition. I had wondered if the 3090's extra RT cores would give it a bigger boost, relatively speaking, but that is not the case for Control.
Here we revisit Metro Exodus, this time testing with the in-game ray tracing effects set to their highest values.
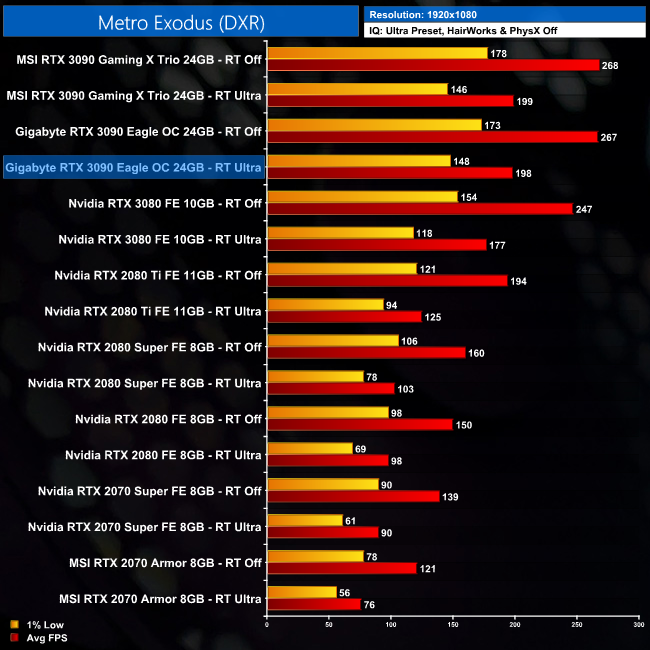
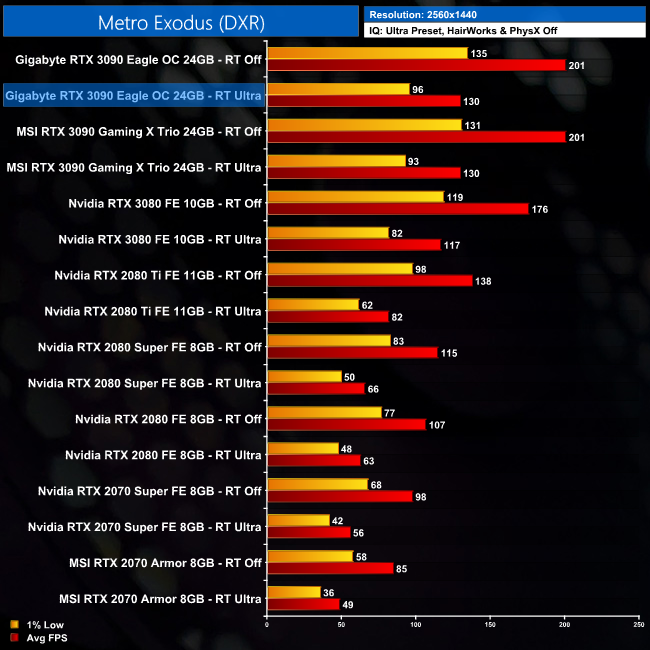
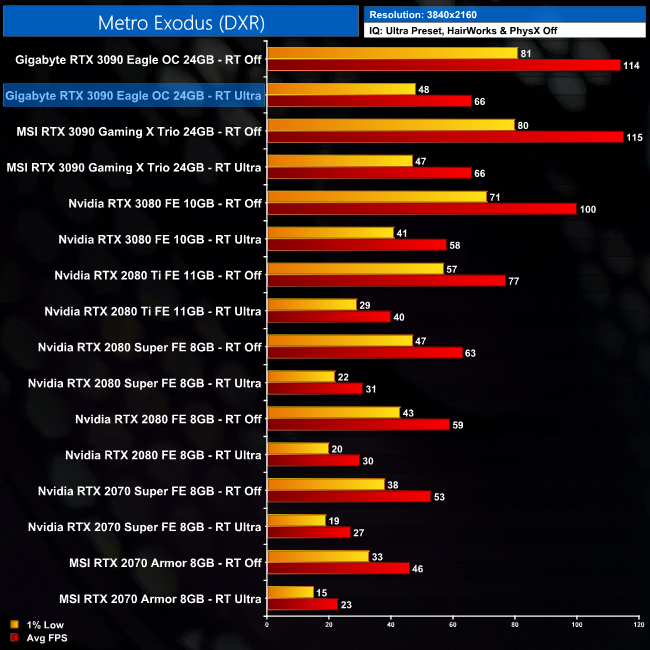
It's a similar story in Metro Exodus. At 4K, playing with RTX effects set to Ultra will bring performance down to 66FPS on average. Once more, this is 14% faster than the frame rate achieved by the RTX 3080 Founders Edition, which is right in line with the performance scaling we saw when testing games without ray tracing, so nothing has changed.
Here we revisit Shadow of the Tomb Raider, this time testing with the in-game ray tracing effects set to their highest values.
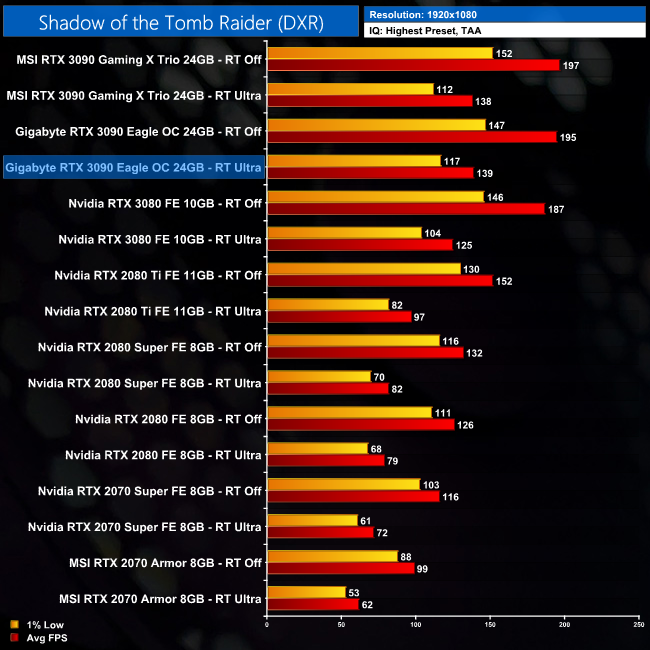
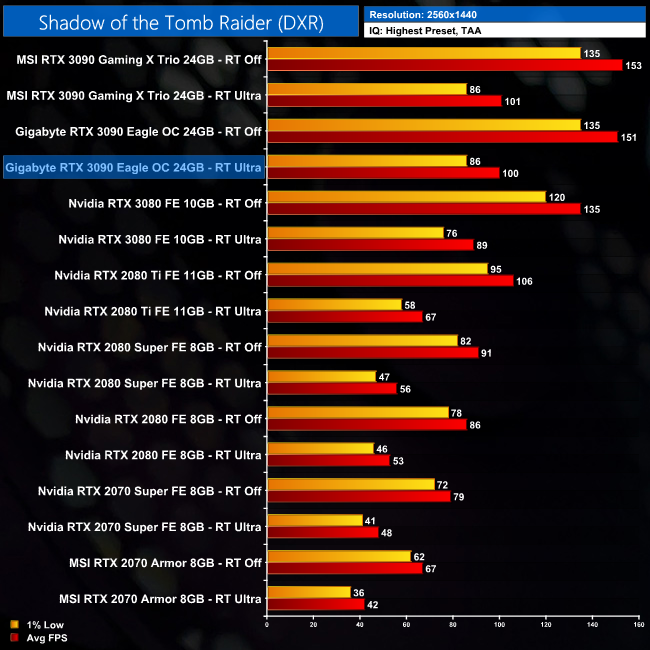
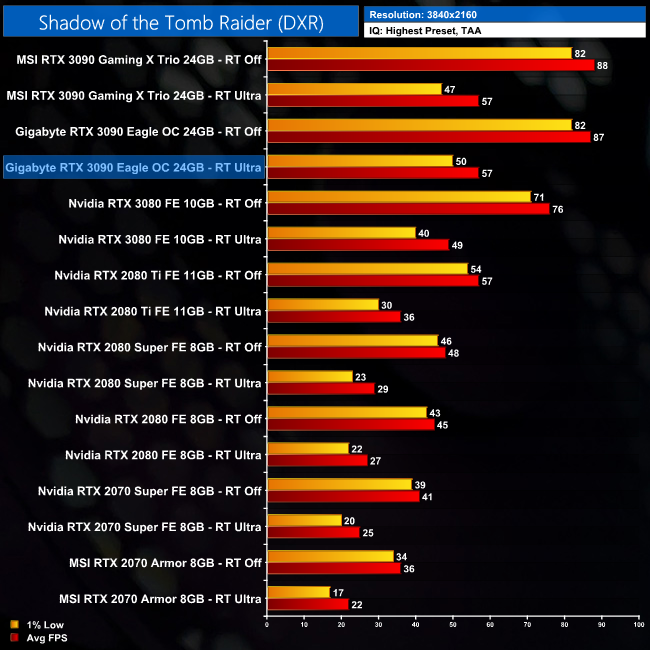
Finally, Shadow of the Tomb Raider confirms that we shouldn't expect to see bigger relative gains when RTX is turned on. With ray traced shadows set to Ultra in this game, the RTX 3090 outperforms the 3080 Founders Edition by 16%.
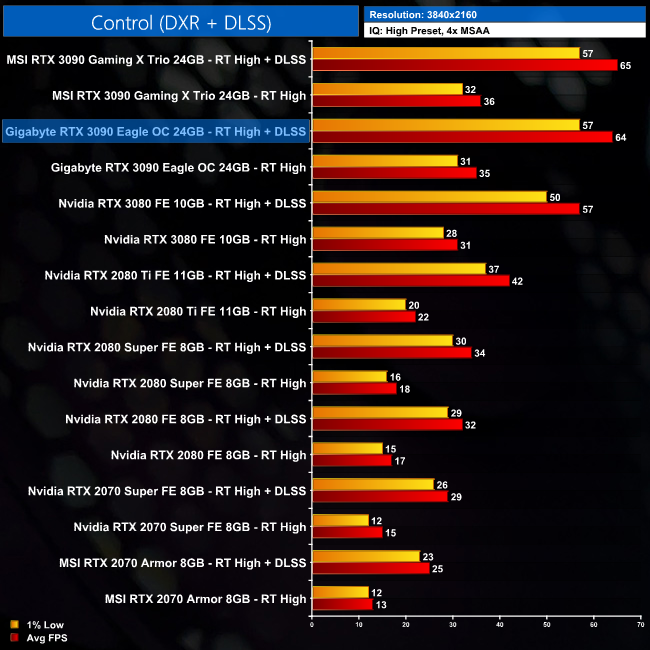
For a look at DLSS performance, we first test Control, with RT set to high, and then RT set to High with DLSS. We see an 82% uplift in performance when enabling DLSS, and this is pretty much in line with the other RTX 3080 GPUs we have tested – RTX 3080 gets an 84% boost from DLSS, while RTX 2080 Ti gets a 91% boost.
In Death Stranding, even at 4K the frame rates are pretty high, and we see diminishing returns from DLSS as a result of this. RTX 3090 still gets a 33% boost to its frame rate, but this is actually less than the RTX 2080 Ti, which sees a 47% uplift.
As the RTX 3090 has significant potential for use by professionals and content creators, here we run a few extra productivity benchmarks to assess its relative performance for these workloads.
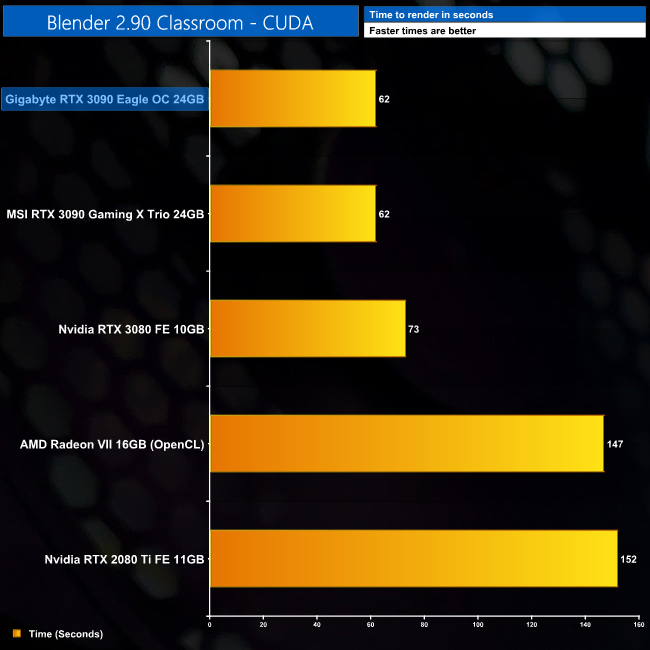
Starting with Blender Classroom. Running the test first using CUDA, we see the RTX 3090 finishing the render is 62 seconds. This marks a 15% reduction in render time compared to the RTX 3080 Founders Edition.
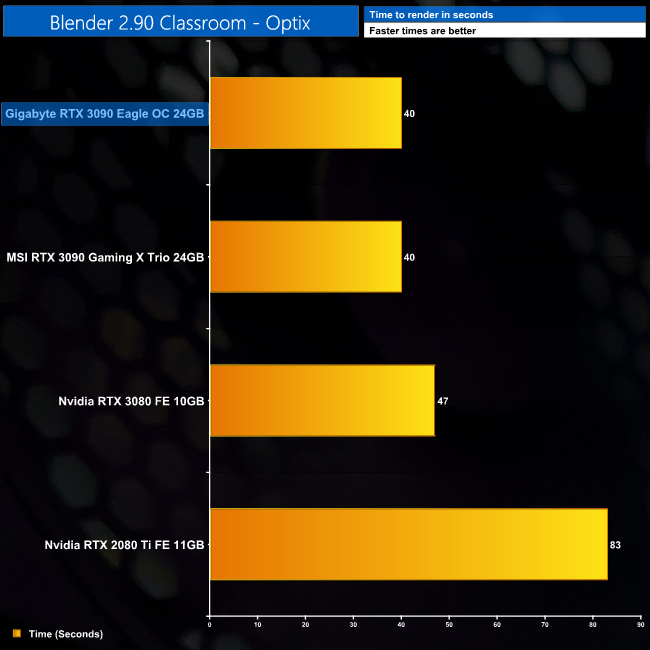
Running the same benchmark, but this time use Optix – which accelerates the workflow by using RTX – we do indeed see overall render times are now even faster. However, this is also the case for the RTX 3080, so the reduction in render time relative to the 3080 is still 15%.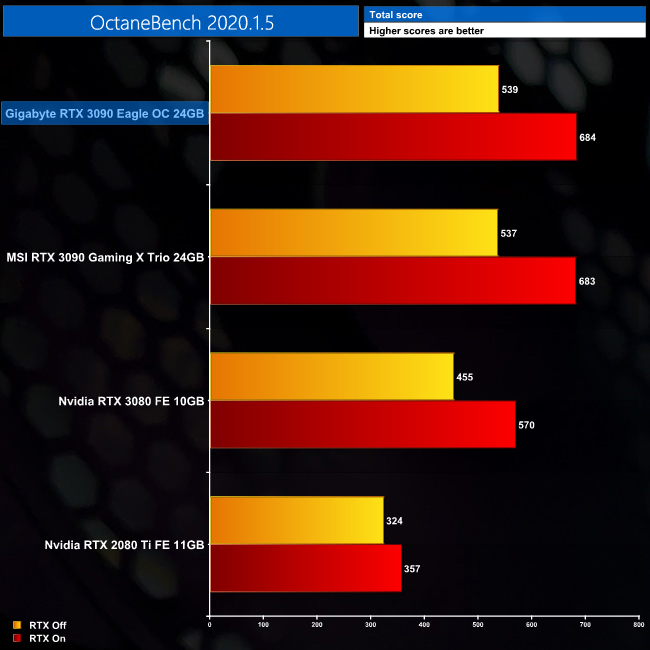
OctaneBench sees decent improvement for the RTX 3090, with scaling slightly better than what we saw in our games testing. Running the test first without RTX sees a boost of 18% for the RTX 3090 Eagle OC, when compared to the RTX 3080. Turning on RTX further increases this to 20%.
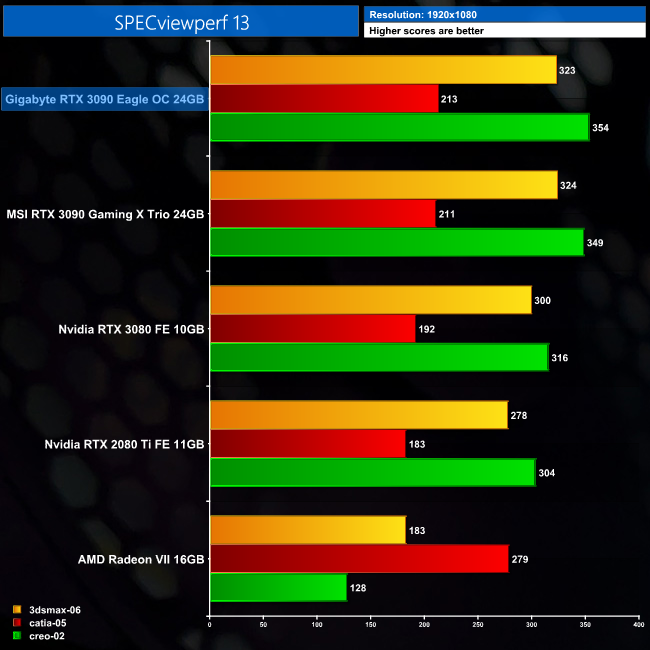
SPECviewperf 13 doesn't scale as well, however. Gains over the RTX 3080 vary from between 8-12% depending on the exact test, and even compared to the RTX 2080 Ti, we saw a difference of 18% at most.
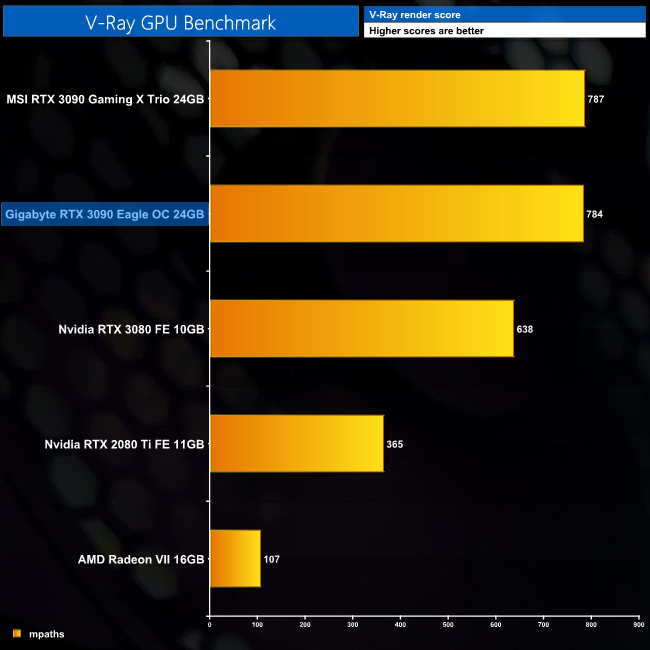
It is V-Ray where we see the single biggest performance improvement for the RTX 3090, relative to the RTX 3080. In this benchmark, RTX 3090 outperforms its smaller brother by 23%.
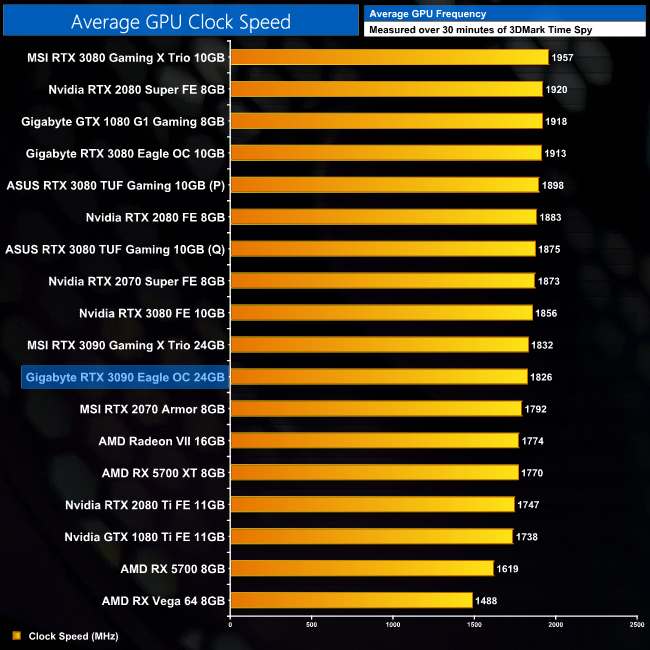
Here we present the average clock speed for each graphics card while running the 3DMark Time Spy stress test for 30 minutes. We use GPU-Z to record the GPU core frequency during the Time Spy runs. We calculate the average core frequency during the 30 minute run to present here.
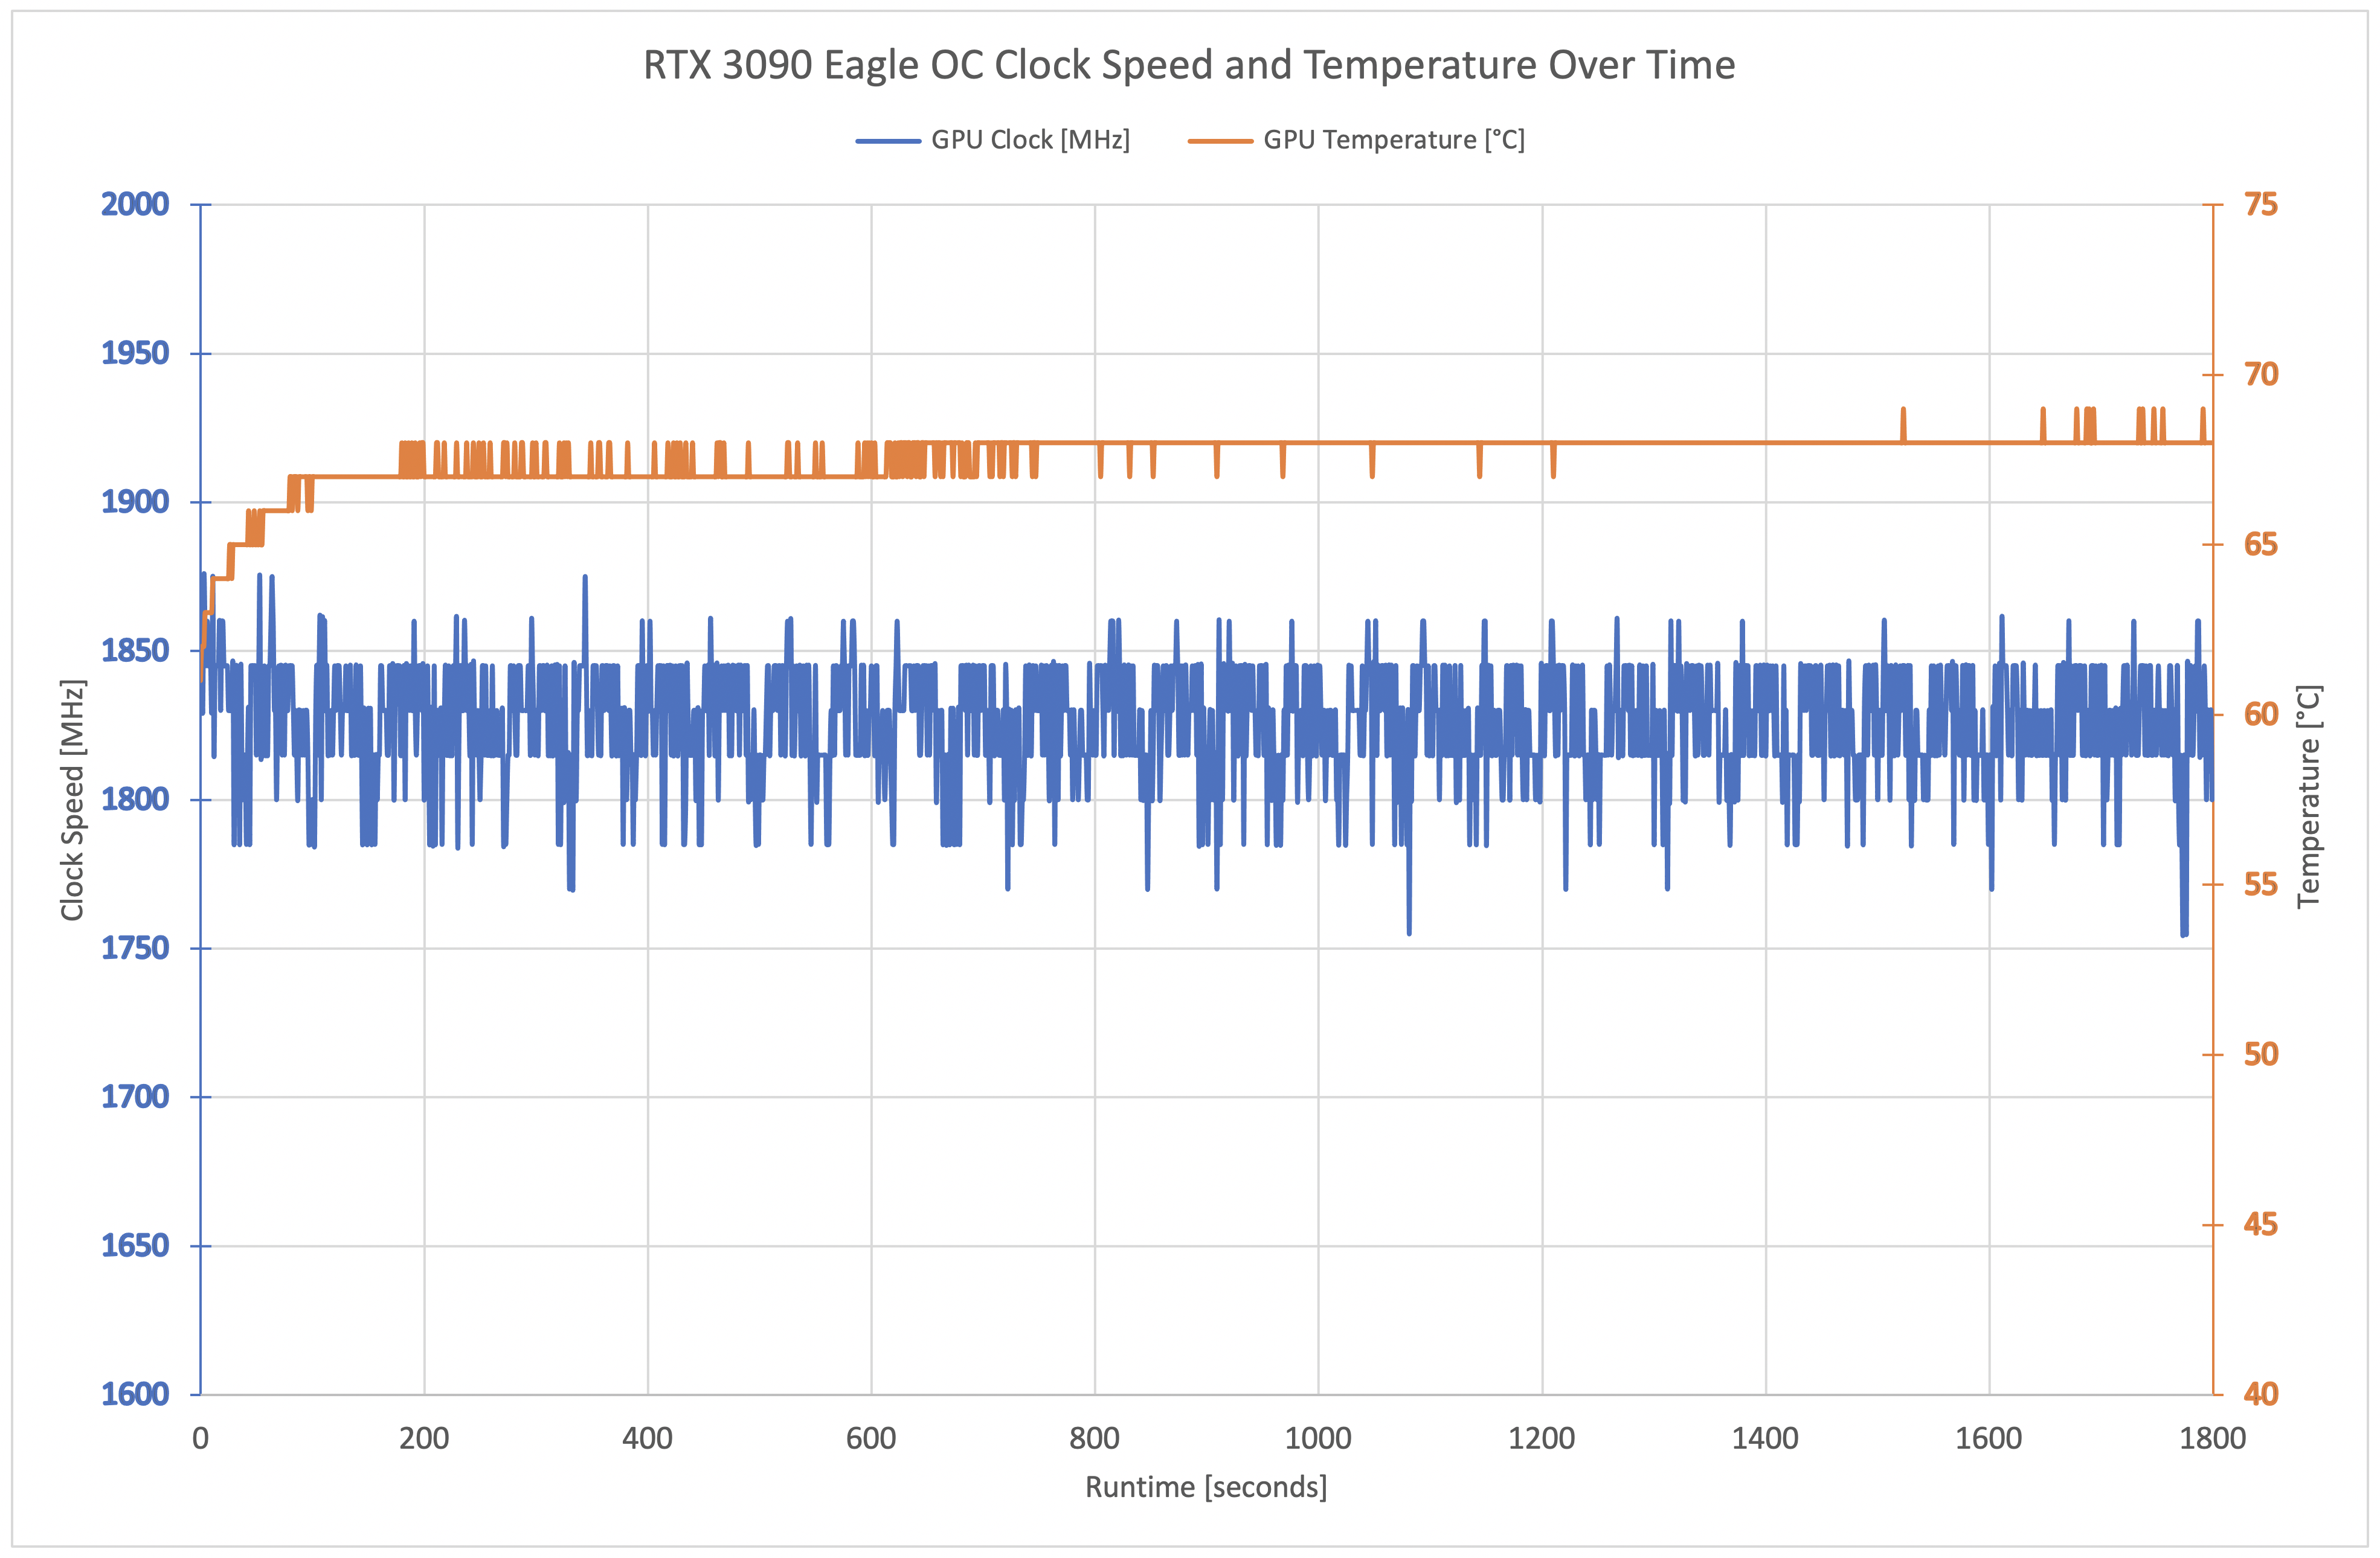
Click to enlarge.
In terms of overall clock speed, the Eagle has a rated boost clock of 1725MHz, and average across our 30 minute stress test it ran almost exactly 100MHz faster than its rated speed. This is still slower than the RTX 3080 Eagle OC, but this is very much to be expected.
For our temperature testing, we measure the peak GPU core temperature under load. A reading under load comes from running the 3DMark Time Spy stress test for 30 minutes.
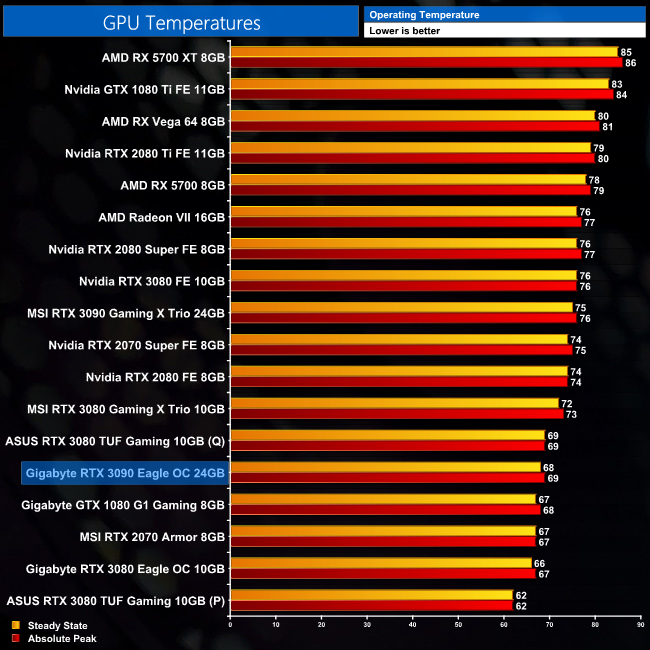
Temperatures have also increased slightly for the RTX 3090 Eagle OC, when compared to the RTX 3080 Eagle OC. Not by much, but peak temperature is 2C higher. This is still a very solid result however, especially considering the RTX 3090 is rated for 350W, yet its core temperature remained below 70C at all times.
We take our noise measurements with the sound meter positioned 1 foot from the graphics card. I measured the noise floor to be 32 dBA, thus anything above this level can be attributed to the graphics cards. The power supply is passive for the entire power output range we tested all graphics cards in, while all CPU and system fans were disabled. A reading under load comes from running the 3DMark Time Spy stress test for 30 minutes.
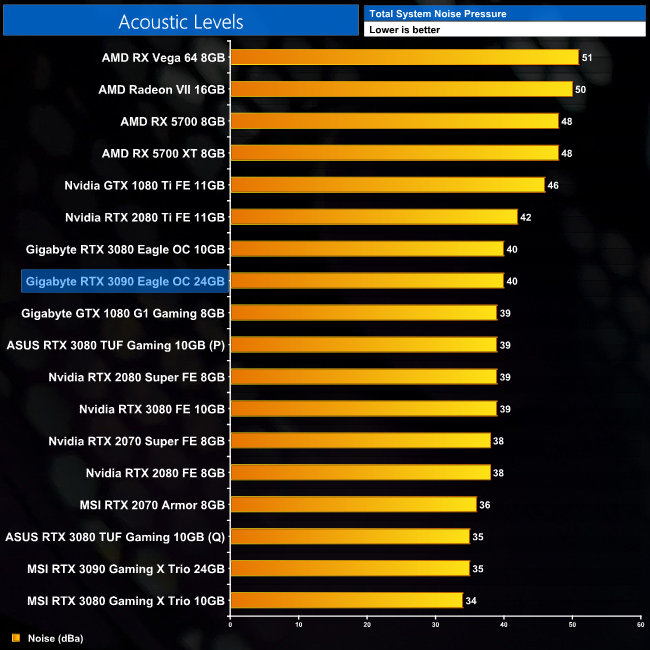
Noise levels are actually unchanged compared to the RTX 3080 Eagle OC. Where that card runs its fans at 1680rpm, the RTX 3090 Eagle OC does increase this slightly – but only to 1760rpm, and that wasn't enough for our sound meter to register increased noise levels. It's not a silent graphics card, but you'd still be hard pressed to hear it over your case fans, so I don't think this is any cause for concern.
We measure system-wide power draw from the wall while running the 3DMark Time Spy stress test for 30 minutes.
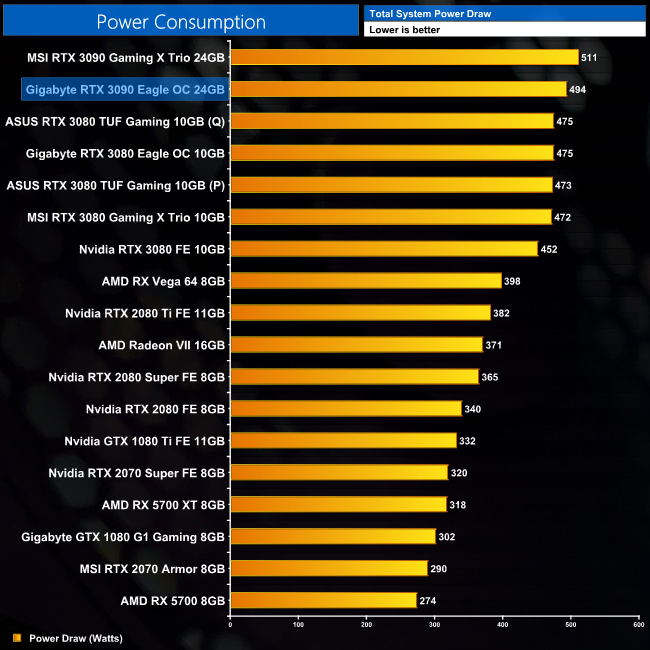
Total system power draw comes in just shy of the 500W mark for the RTX 3090 Eagle OC. This isn't too much more than the aftermarket RTX 3080s we have reviewed, but it is still right up there as one of the most power hungry GPUs we have ever tested.
We also use GPU-Z to measure Board Power (graphics card-only power draw). This is currently only available for Nvidia cards, which is why we have excluded AMD results from the chart. Aside from the fact this is software-based reporting, and not a hardware measurement of the PCIe power cables and PCIe slot (for that we’d need something like PCAT), this should provide us more accurate data to work with as it is measuring only the GPU power, and not total system power which is a fundamentally imprecise measurement.
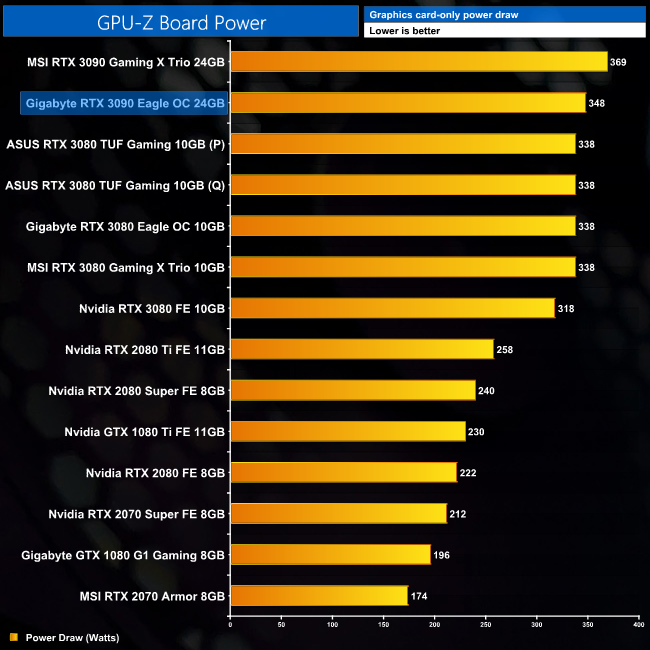
Looking at board power-only, we can see the RTX 3090 Eagle OC has a 350W power target. This is just 10W more than the RTX 3080 Eagle OC or RTX 3080 Gaming X Trio, and 30W higher than the RTX 3080 Founders Edition.
By using the GPU-Z Board Power data in conjunction with the 11-game average FPS data we presented earlier in this review, we can work out performance per Watt for each graphics card. This is presented as FPS per Watt.
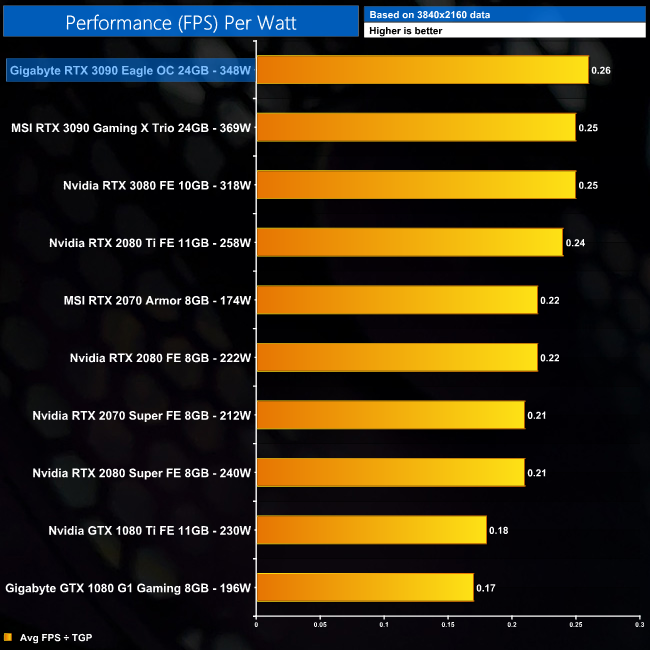
Considering power draw for the RTX 3090 Eagle OC is roughly 9% higher than the RTX 3080 Founders Edition, but average performance has increased by 13%, we do see slightly better performance per Watt figures. Not by a lot, but in terms of performance efficiency, this is actually the better GPU.
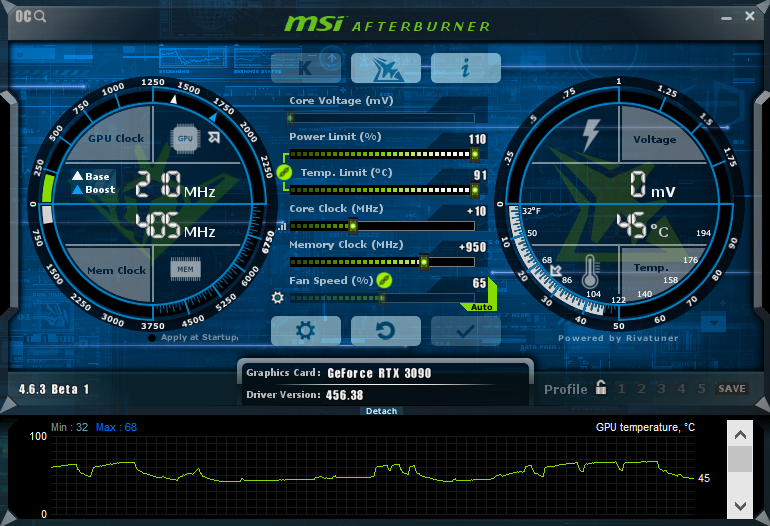
Finally we come to manual overclocking. We have already seen how Ampere is already pretty limited in this regard, and unfortunately this is no different for the RTX 3090. In fact, I could only add an extra 10MHz to the GPU core, as anything more resulted in crashes during 3DMark Time Spy. Thankfully, the GDDR6X was a bit more amenable to an overclock, and I could add 950MHz to the memory, bringing speeds up to 21.4Gbps.
Still, real-world gains from this overclock weren't huge, as we saw an extra 5% at most when testing Gears 5, Ghost Recon: Breakpoint, and Total War Saga: Troy.
Just over a week ago, Nvidia launched the RTX 3080, setting a new bar for 4K gaming performance, while also delivering unrivalled value in terms of overall cost per frame. With the RTX 3090, the company has gone in a slightly different direction.
The simple truth of the matter is, the RTX 3090 is not going to be a justifiable purchase for the vast majority of gamers out there. For one, its price is prohibitively high, starting at £1399, and it delivers comparatively awful value for money up against the RTX 3080.
However, looking at RTX 3090 in terms of value makes no sense. This GPU is not trying to deliver value, it's simply the fastest graphics card out there, with this Gigabyte Eagle model delivering 13% better performance than the RTX 3080, and 48% better performance than the RTX 2080 Ti, when tested at 4K. If you are weighing up whether or not to buy an RTX 3090 based on its value for money, the answer is always going to be ‘no'. This is a GPU for gamers who demand the best and don't care about the price. Right now, the RTX 3090 is the fastest gaming GPU and it simply has no competition for that title.
The other type of person I can see who might buy the RTX 3090 is the professional whose income is directly tied to the quality of hardware they have available to them. If you can render faster or get more work done in the same time with the RTX 3090, that quickly adds up. For that user, I would imagine the initial outlay is less of a concern, as they would know the RTX 3090 would pay for itself over time.
As for this Gigabyte RTX 3090 Eagle OC we have looked at today, it is another solid card from the company. It uses the same cooler and shroud design as the RTX 3080 model we reviewed last week, but with a slightly beefed up power delivery and increased 350W power target.
Given the cooler has stayed the same, but the power of the GPU has increased, the RTX 3090 does run a little hotter than its RTX 3080 equivalent, but only by 2C based on our testing, with a peak temperature of 69C. The fans, too, only spin 80rpm or-so faster, which wasn't enough to make a difference in our noise testing. It's not a dead silent graphics card, but nor is it loud, and I think you'd have to be very fussy to complain about the noise from the Eagle OC.
In terms of overclocking, unfortunately things are still very limited here. We could hardly push the core frequency any further, and while we did manage to bring memory speeds from 19.5Gbps to 21.4Gbps, real world performance didn't increase by more than 5%. It appears Ampere has been delivered right on the limits of what it is capable of, with precious little headroom for further tuning.
Overall, I personally find RTX 3090 very straightforward. For anyone who is remotely concerned about value for money, this GPU simply makes no sense. For the cash-rich gamer or professional, however, who simply wants the best GeForce GPU that is out there, the RTX 3090 is what to buy.
![]()
The Gigabyte RTX 3090 Eagle OC has a UK MSRP of £1449. We found it on Overclockers UK HERE.
Discuss on our Facebook page HERE.
Pros
- Fastest GeForce GPU out there.
- Gigabyte Eagle runs cool and relatively quiet.
- Performance per Watt is actually increased compared to the RTX 3080.
Cons
- Only for the cash-rich audience who simply do not care about value for money.
- Very high power draw.
KitGuru says: For the vast majority reading this, buying an RTX 3090 would be inadvisable to put it mildly. For those not interested in value or cost per frame, for those who simply want the fastest graphics card out there and do not care about the price – enjoy your new RTX 3090.