
Manual CPU Overclocking:
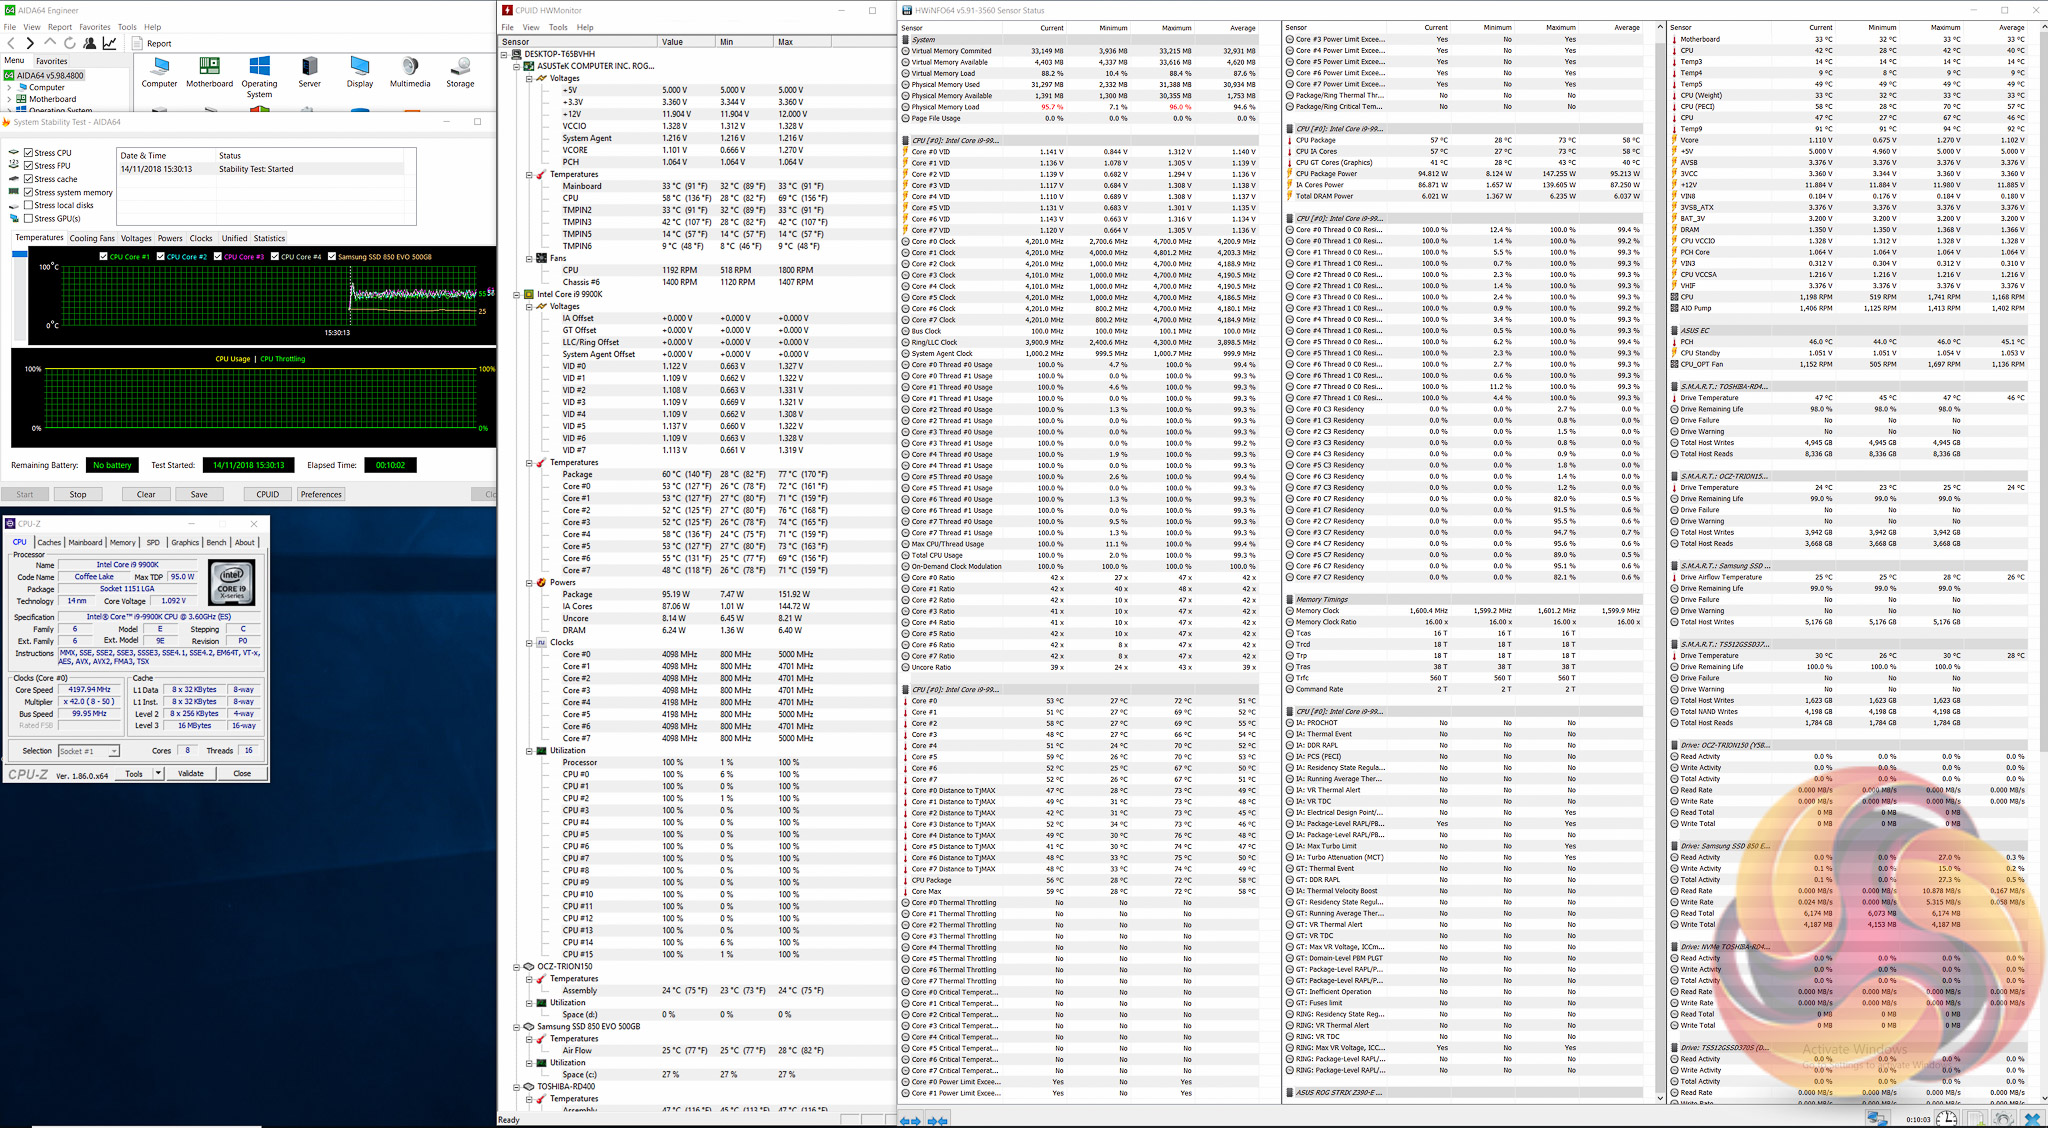
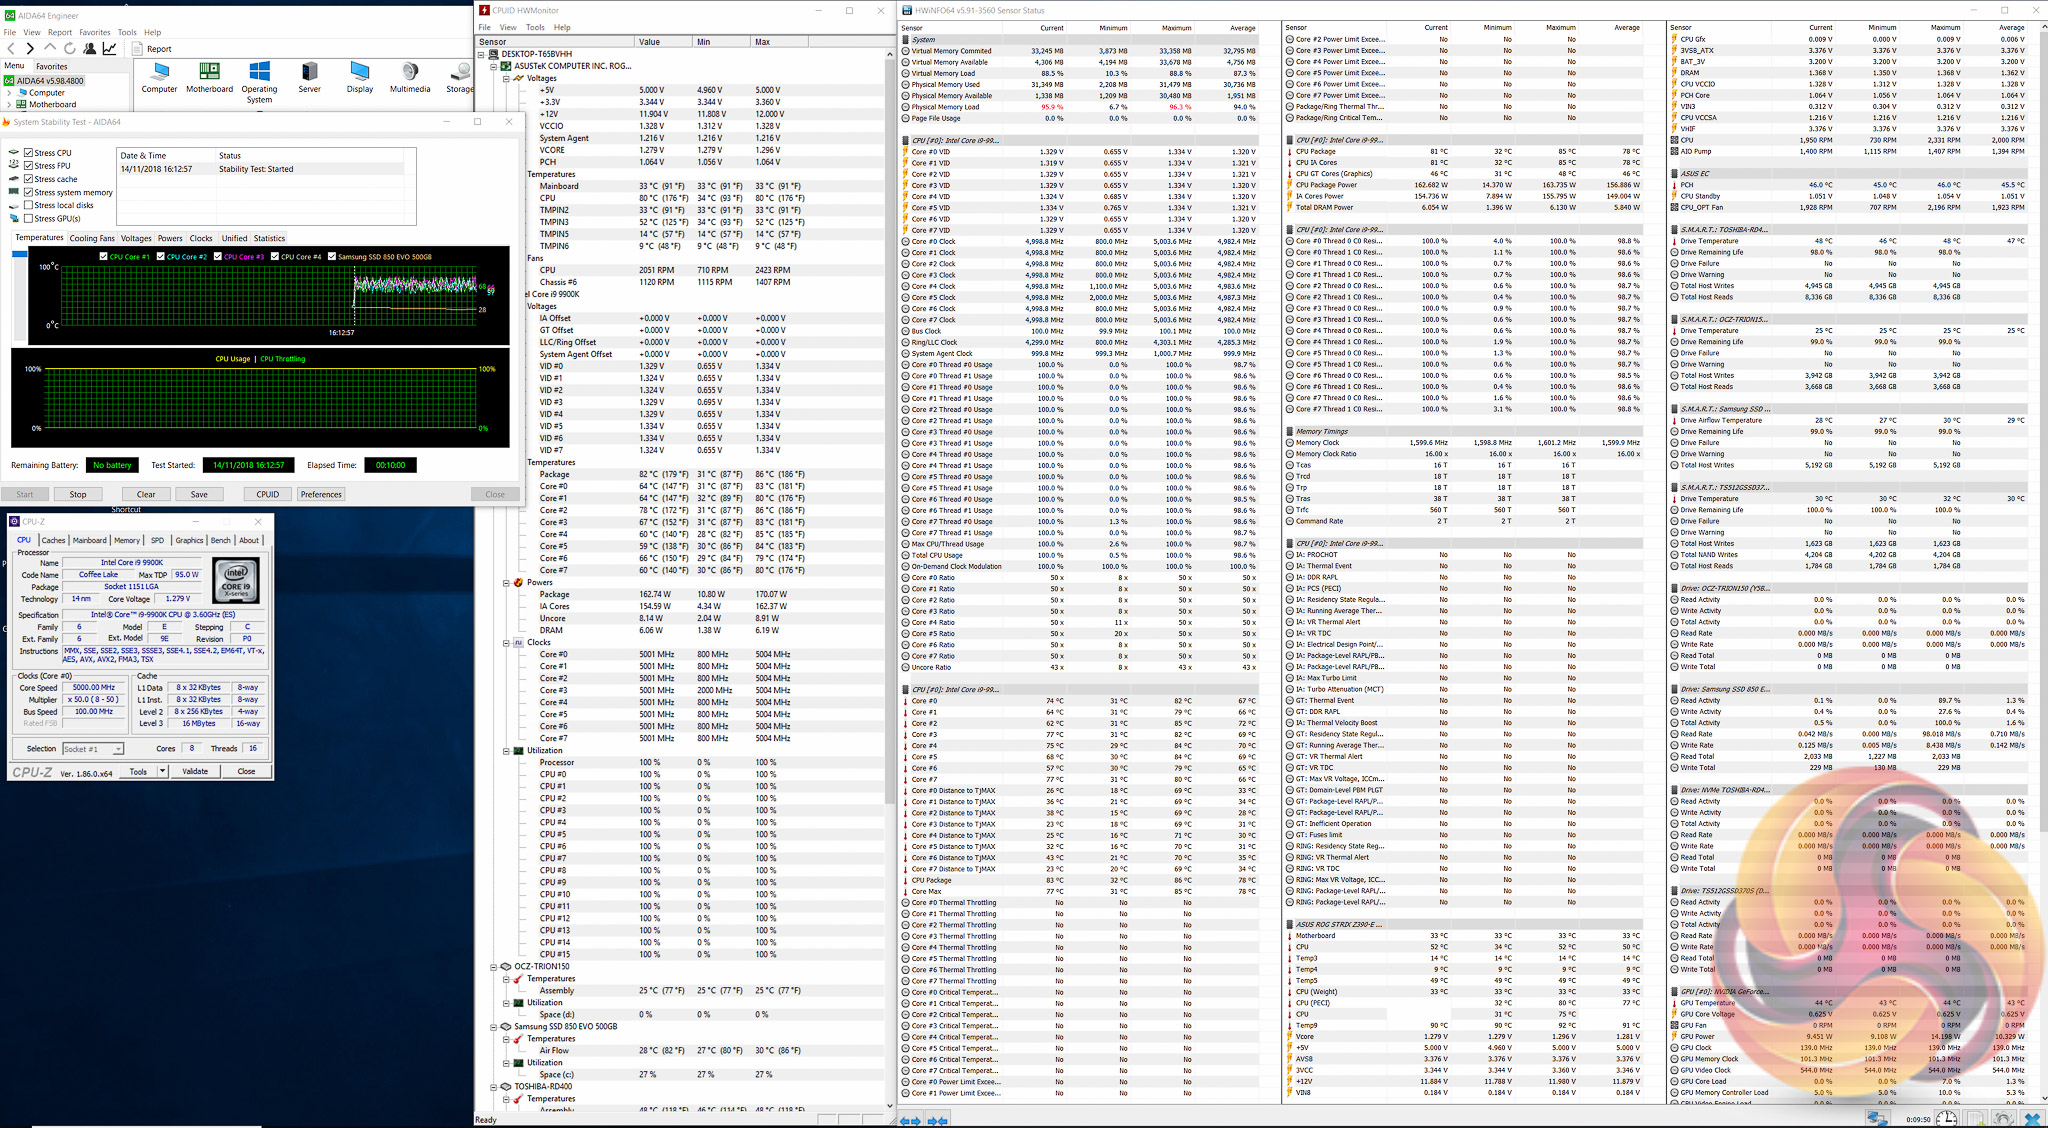
To test the ASUS ROG Strix Z390-E Gaming motherboard’s CPU overclocking potential, we set the CPU core voltage no higher than 1.3V and push for the highest stable clock speed. We maintain the DRAM frequency at 3200MHz to take memory stability out of the overclocking equation.
Our particular CPU is not stable at 5.1GHz even with 1.45v. The final stable overclock for almost all Z390 motherboards we may test should be 5GHz, unless there is something particularly wrong with the VRM that limits the voltage or power it can supply. In the case of the ASUS ROG Strix Z390-E Gaming it achieved 5GHz at 1.3 volts with no issues at all.
Motherboard Sensors
There's no temperature sensor marked as being for the VRM, so it's not possible to confirm the state of the VRM temperatures during testing.
Overclocked Performance
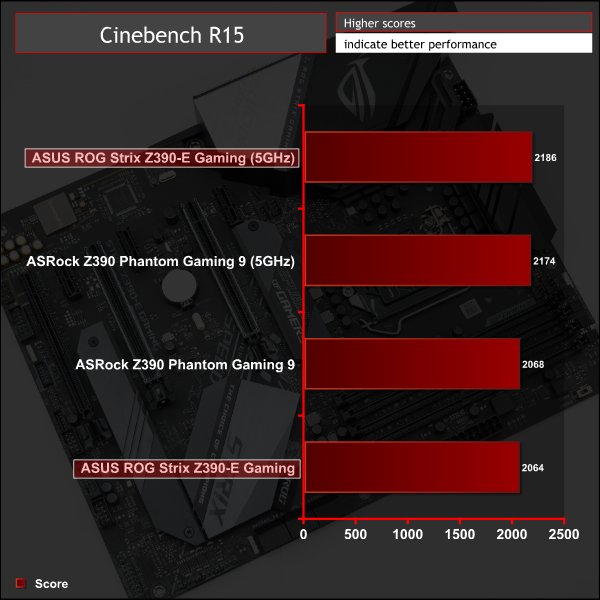
Performance scaled with frequency. On this motherboard where the CPU can follow Intel Turbo guidance the gains from overclocking in longer benchmarks would be more noticeable (effectively going from 4.2GHz all core turbo to 5GHz), since overclocking takes the CPU beyond Intel’s specification. However, if you'd been using the enhanced Turbo mode before overclocking, the jump to a 5GHz all-core frequency would be hardly noticeable.
System Power Consumption
We leave the system to idle on the Windows 10 desktop for 10 minutes before taking a reading. For CPU load results we run AIDA64 CPU, FPU, Cache and Memory stress tests and take a reading after 10 minutes. The power consumption of our entire test system (at the wall) is shown in the chart.
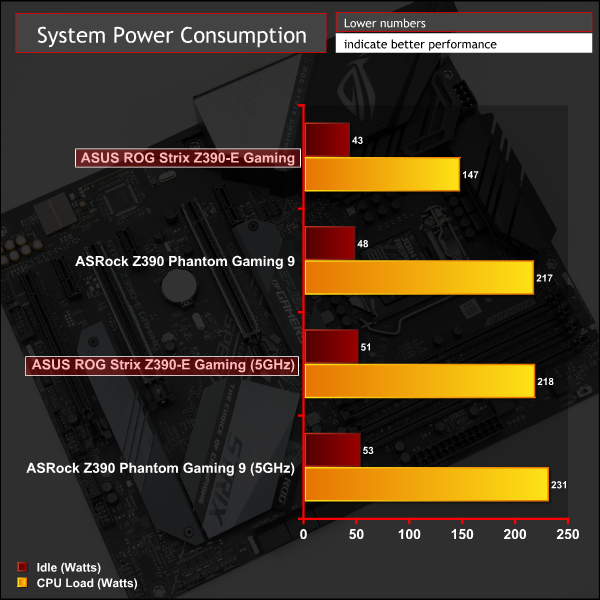
Due to ASUS allowing the Intel i9 9900K to run at Intel specification, with user input, the stock numbers are considerably lower than the ASRock motherboard. However, when overclocking the gap almost disappears.
The VCore did drop to 1.28v, despite setting 1.3v in the UEFI, when overclocking – hence why the overclocked power consumption for the ASUS motherboard is slightly lower. This is down to the Auto LLC settings and it was possible to override this by using a more aggressive LLC option.
12-volt EPS Power Consumption
During the 10-minute stress test as specified above, we record the direct CPU power consumption drawn through the EPS 8-pin socket using modified EPS 8-pin cables that have a Tinkerforge Voltage/Current 1.0 bricklet intercepting and monitoring the power flow from the power supply. That bricklet then reports its data to a Tinkerforge Master Brick. All the data collected by the Tinkerforge Master Brick is passed into an external laptop over a USB connection and analysed in the Cybenetics Powenetics Project software.
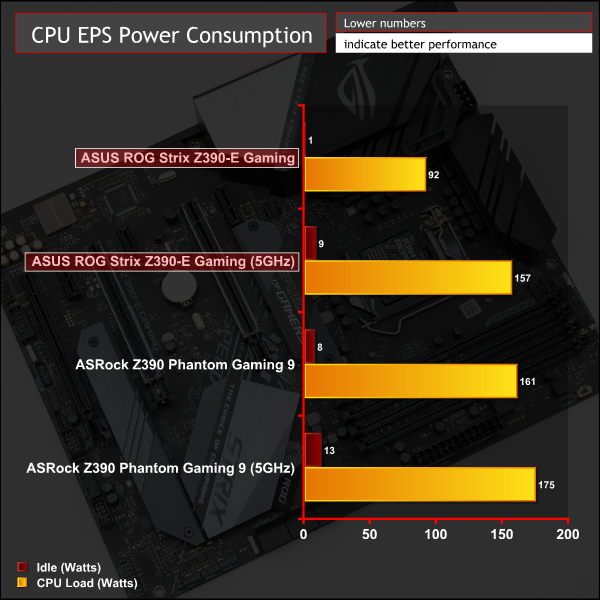
Stock CPU power consumption represents approximately 3% for idle and 69% for load of the system total, when adjusted for PSU efficiency*.
Overclocked CPU power consumption represents approximately 18% for idle and 80% for load of the system total, when adjusted for PSU efficiency*.
*Approximate Seasonic SS-760XP PSU efficiency at:
- 50-watts: 86%
- 125-watts: 89%
- 200-watts: 90%
The Powenetics software provides the power consumption at 12v input (pre-CPU VRM), and the CPU provides the power consumption (CPU IA Cores Power) after the CPU VRM has translated the power into a useful format (post-VRM). Based on this we can provide a rough estimate of VRM efficiency and “wasted” energy that likely translates into heat.
- Stock: 87-watts reported by CPU, 92-watts recorded, approximately 95% efficient and 5-watts of heat output.
- Overclocked: 149-watts reported, 157-watts recorded, approximately 95% efficient and 8-watts of heat output.