

The storage arm of Corsair has been pretty quiet over the last few months; the last drive we looked at was the Neutron XTi high-end drive back in July 2016. But they are back with a bang at the sharp end with the Force MP500, the fastest SSD drive they have released to date.

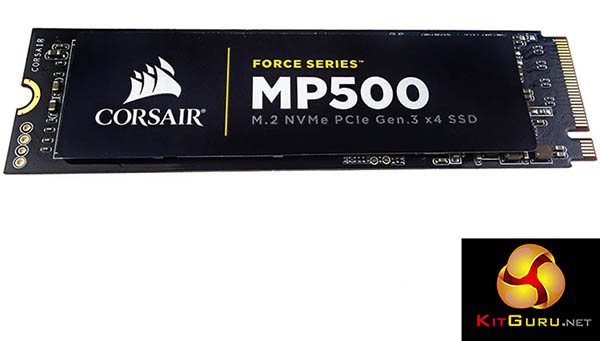
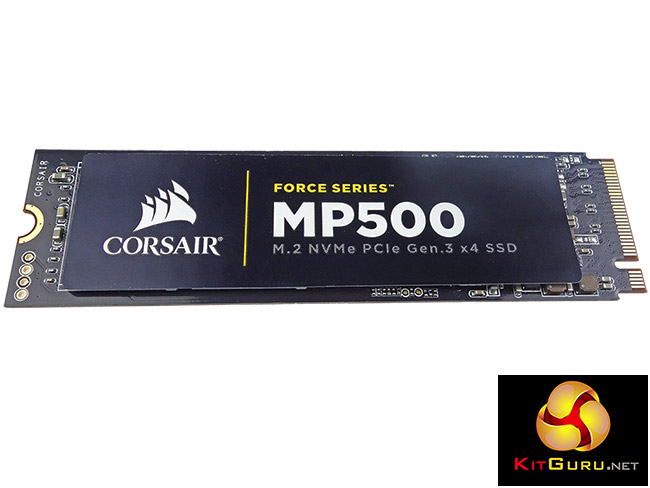
The M.2 2280 format Force MP500 uses a combination of NVMe architecture, a PCIe Gen 3.0 x4 interface, Phison PS5007-E7 controller and Toshiba 15mn MLC NAND. There are three drive capacities in the range; the flagship 480GB drive being joined by 120GB and 240GB models.
All three models have the same quoted Sequential Read/Write performance; 3,000MB/s and 2,400MB/s respectively. There is a difference between the two larger capacity drives and the smallest when it comes to the quoted random 4K performance. The 480GB and 240GB drive are rated as up to 250,000 IOPS for reads and up to 210,000 IOPS for writes. The 120GB drive IOPS figure drops a lot lower than these at up to 150,000 IOPS for reads and up to 90,000 IOPS for writes. These figures are for the drive being tested at a Queue Depth of 32.
Although there is no mention of any encryption support in the specifications of the MP500, the PS5007-E7 controller does support AES-256 bit encryption so this feature may be enabled in the drive in the future with a firmware update.
Corsair quote a TBW endurance figure for the 480GB drive of 698TB and back the MP500 with a 3-year warranty.
Physical Specifications:
Usable Capacities: 480GB
NAND Components: Toshiba 15mn MLC
Interface: PCIe Gen3.0 x4 (NVMe)
Form Factor: 2260 M.2
NAND Controller: Phison PS5007-E7
Dimensions: 22 x 80 x 4.7mm
Drive Weight: 13g
Firmware Version: E7FM02.1
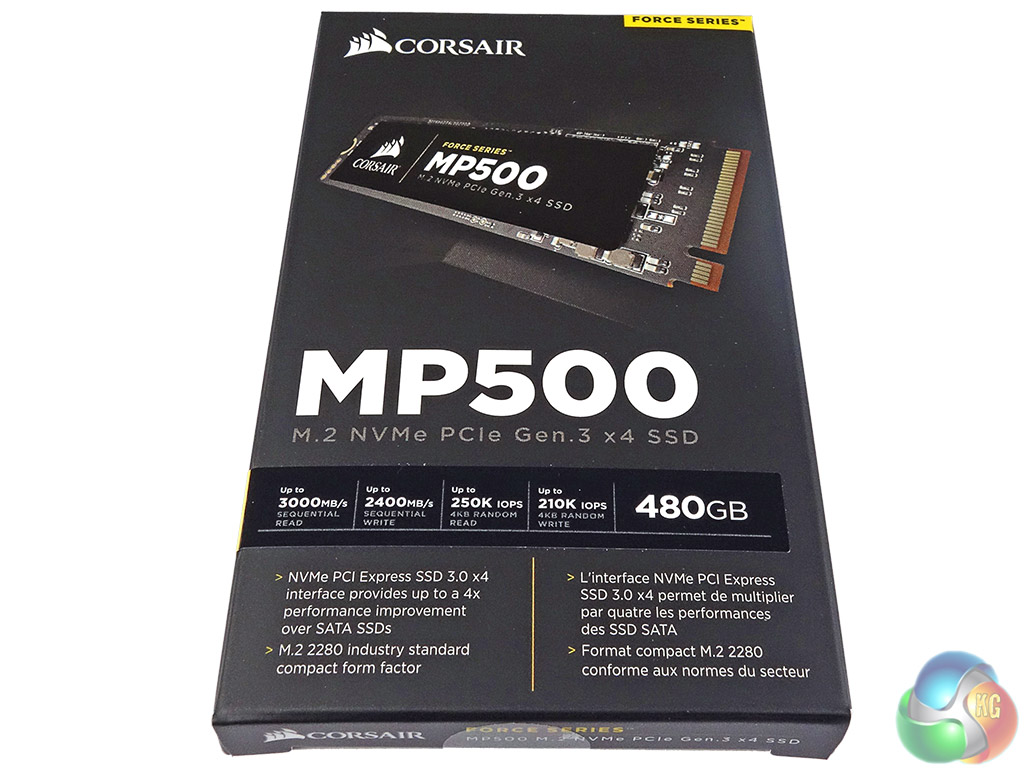
The MP500 comes in an attractive slim box with an image of the drive on the front along with a panel that gives the drive's capacity along with figures for Sequential and 4K random read/write performance. Most of the rear of the box is taken up by multilingual marketing text.
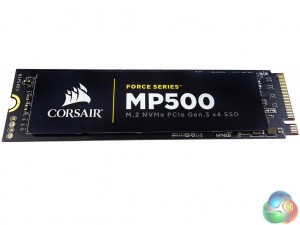
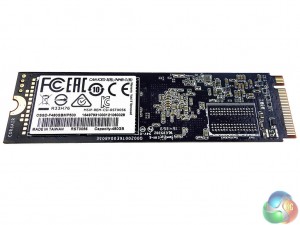
The front of the drive has a thicker than usual label, but the extra thickness is explained by the thin layer of copper that has been introduced into the label's design (in a similar fashion to Samsung's SSD960 drives) to help dissipate the build-up of heat from the controller and NAND.
Under the label sit two Toshiba 15mn MLC NAND packages (coded TH58TFT0DFLBA8H), the Phison PS5007-E7 controller and 1GB of DDR3 cache. The rear of the drive is home to two more NAND packages. The PS5007-E7 is Phison's first NVME controller with a Gen3.0 x4 PCIe interface. An 8-channel controller, the 28nm PS5007-E7 supports 1Z nm MLC, TLC and 3D NAND, features SmartECC and SmartFlush technologies and supports AES-256 encryption.
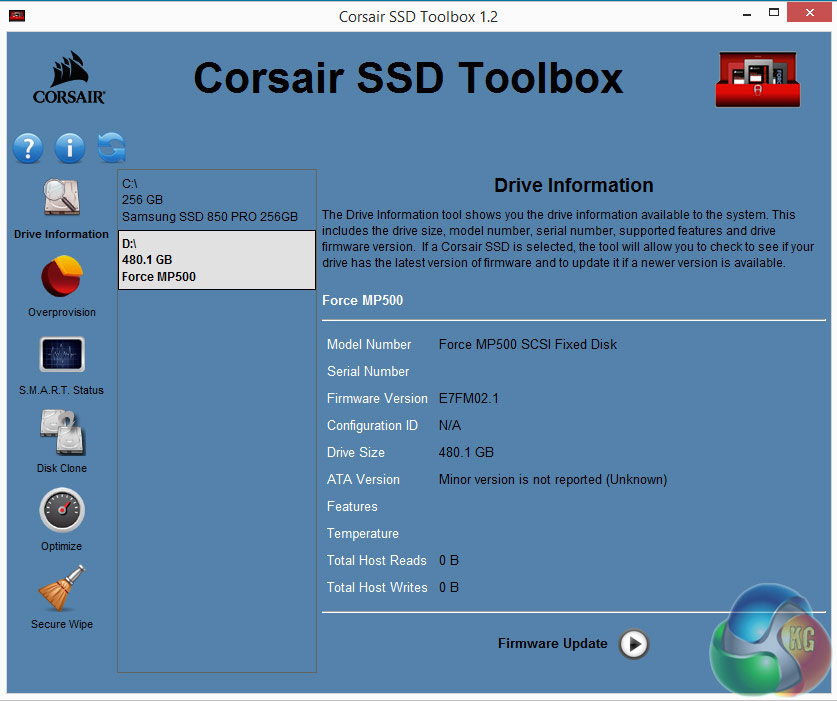
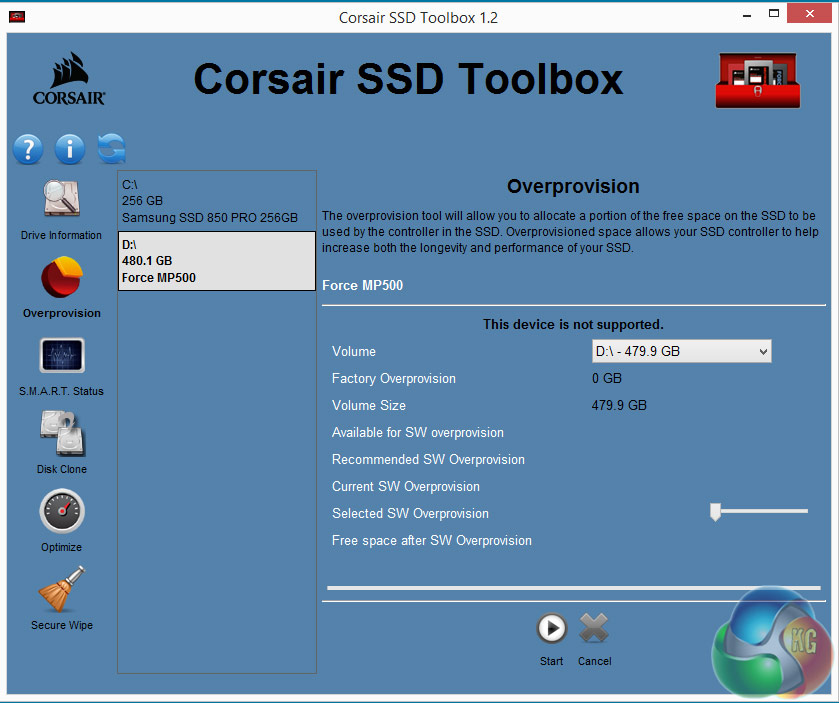
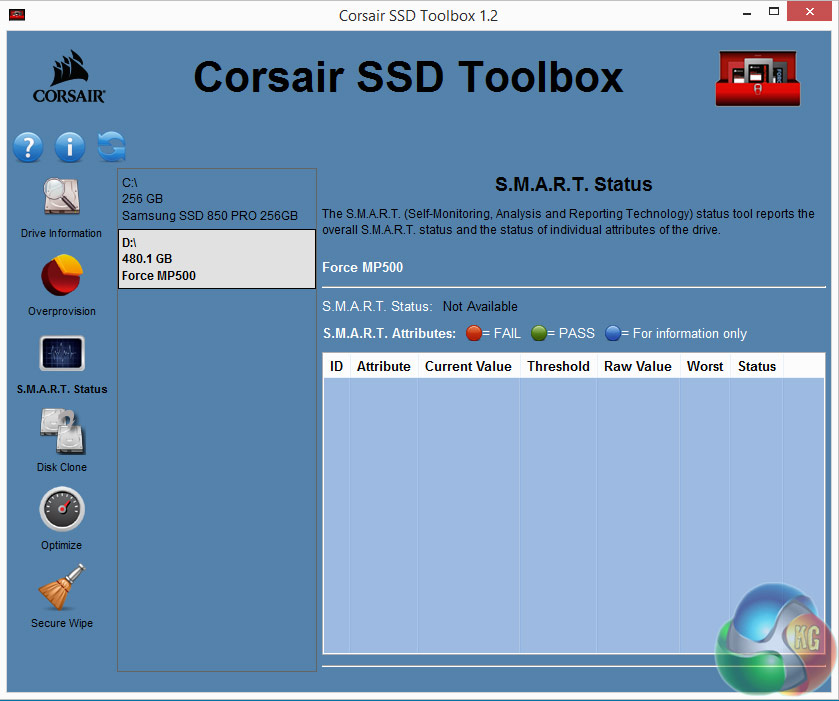
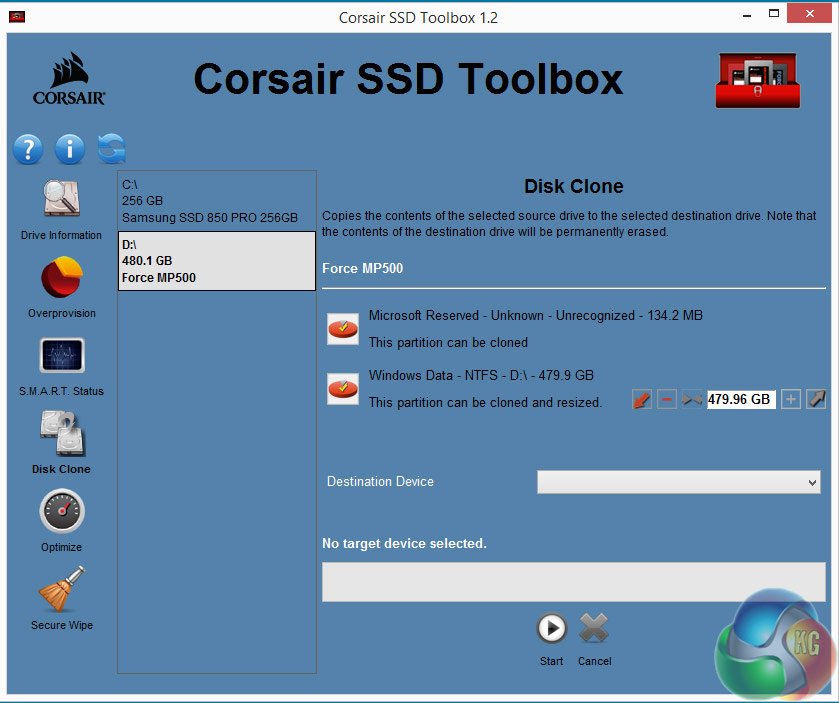
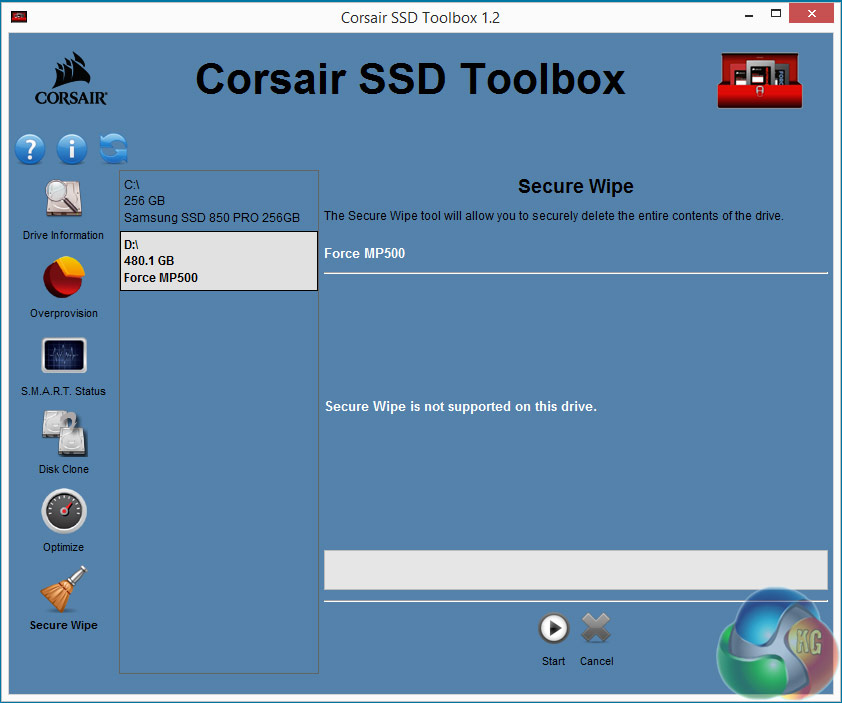
Corsair's SSD management utility is called SSD Toolbox. At the time of writing, we used the latest 1.2.4.7 version of Toobox but it's in desperate need of a refresh as it hardly provided any details for the drive. It couldn't provide the drive S.M.A.R.T details, doesn't allow for changes to the Trim commands or over provisioning, or even securely erase the drive.
For testing, the drives are all wiped and reset to factory settings by HDDerase V4. We try to use free or easily available programs and some real world testing so you can compare our findings against your own system. This is a good way to measure potential upgrade benefits.
Main system:
Intel Core i7 4790K with 16GB of DDR3-2133 RAM, Sapphire R9 390 Nitro and an ASRock Extreme 6 motherboard.
Other drives:
Kingston HyperX Predator 480GB
OCZ RevoDrive 350 480GB
OCZ RevoDrive 3 x2 480GB
Plextor M6e Black Edition PCIe 256GB
Samsung SSD960 PRO 2TB
Samsung SSD960 EVO 1TB
Samsung SSD950 PRO 256GB
Samsung SM951 256GB
Samsung XP941 512GB
Toshiba OCZ RD400 512GB
Software:
ATTO Disk Benchmark.
CrystalMark 3.0.3.
AS SSD.
IOMeter
PCMark8
All our results were achieved by running each test five times with every configuration this ensures that any glitches are removed from the results. Trim is confirmed as running by typing fsutil behavior query disabledeletenotify into the command line. A response of disabledeletenotify =0 confirms TRIM is active.
Crystalmark is a useful benchmark to measure theoretical performance levels of hard drives and SSD’s. We are using V3.0.3.
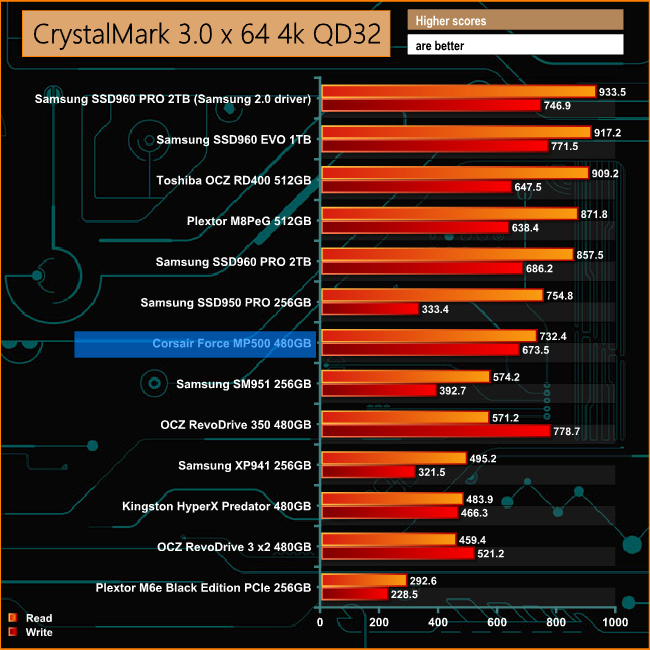
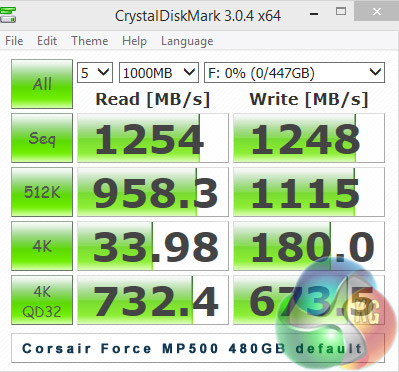
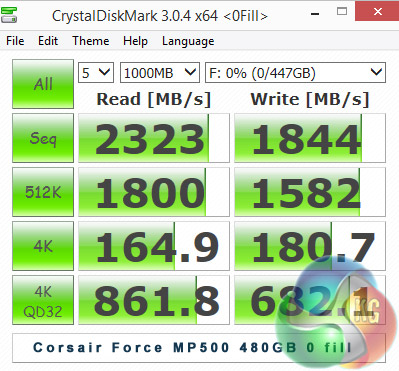
The MP500 lags a good way behind the current king of the hill Samsung SSD960 Pro in the CrystalDiskMark 4K QD32 test at the default benchmark setting. However, the Phison PS5007-E7 controller is clearly happier dealing with highly compressible data as can be seen by the jump in read performance in particular, when the drive is tested with the highly compressible data test of CrystalDiskMark.
The ATTO Disk Benchmark performance measurement tool is compatible with Microsoft Windows. Measure your storage systems performance with various transfer sizes and test lengths for reads and writes. Several options are available to customize your performance measurement including queue depth, overlapped I/O and even a comparison mode with the option to run continuously.
Use ATTO Disk Benchmark to test any manufacturers RAID controllers, storage controllers, host adapters, hard drives and SSD drives and notice that ATTO products will consistently provide the highest level of performance to your storage.

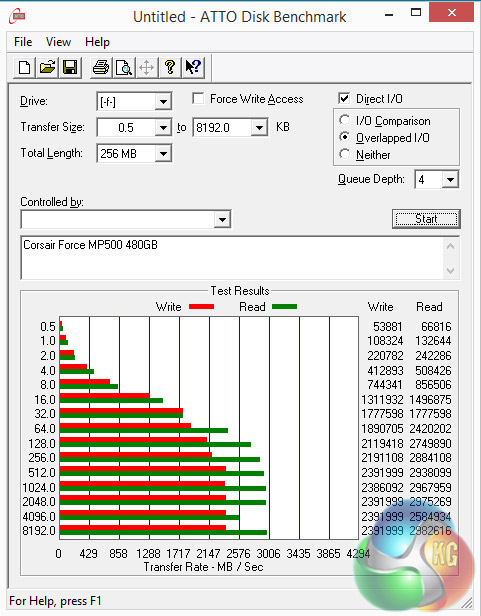
Corsair quote Sequential performance figures for the 480GB MP500 as up to 3,000MB/s for reads and up 2,400MB/s for writes, figures that proved to be pretty much bang on with the 2,975MB/s reads and 2,391MB/s writes that we got from the ATTO benchmark.
AS SSD is a great free tool designed just for benching Solid State Drives. It performs an array of sequential read and write tests, as well as random read and write tests with sequential access times over a portion of the drive. AS SSD includes a sub suite of benchmarks with various file pattern algorithms but this is difficult in trying to judge accurate performance figures.
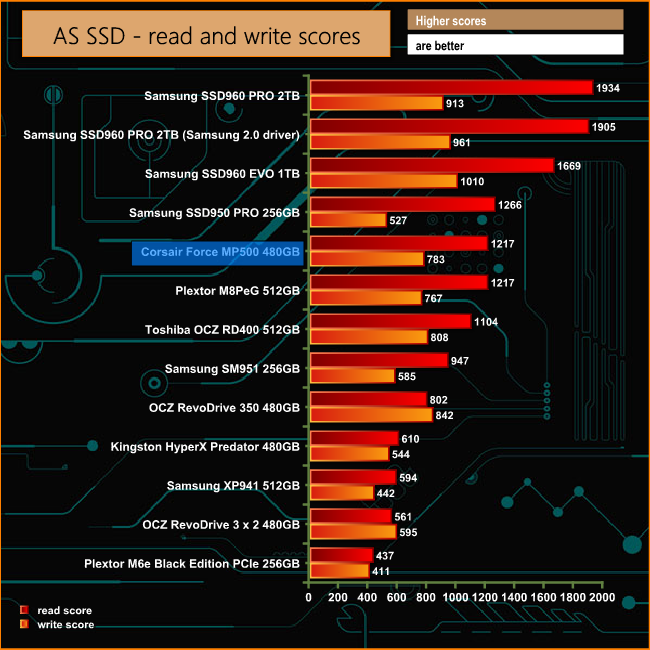
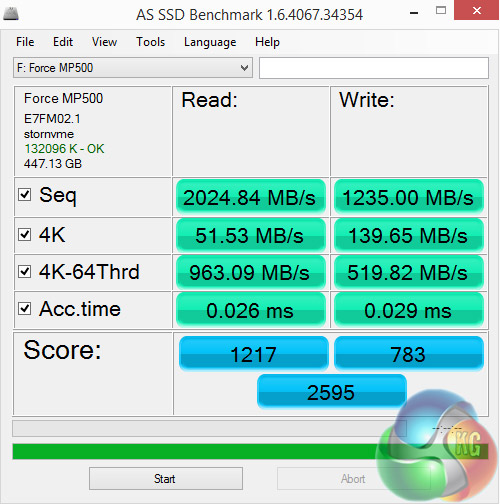
Here again, the MP500 falls below both the latest Samsung SSD960 and the previous generation SSD950 drives in the ASSSD read scores. While it still lags behind the two SSD960 drive's write scores it outperforms the SSD950 when it comes to write performance. At 963.09MB/s, the read performance of the drive at a fairly deep queue depth of 64 is impressive.
IOMeter is another open source synthetic benchmarking tool which is able to simulate the various loads placed on hard drive and solid state drive technology.
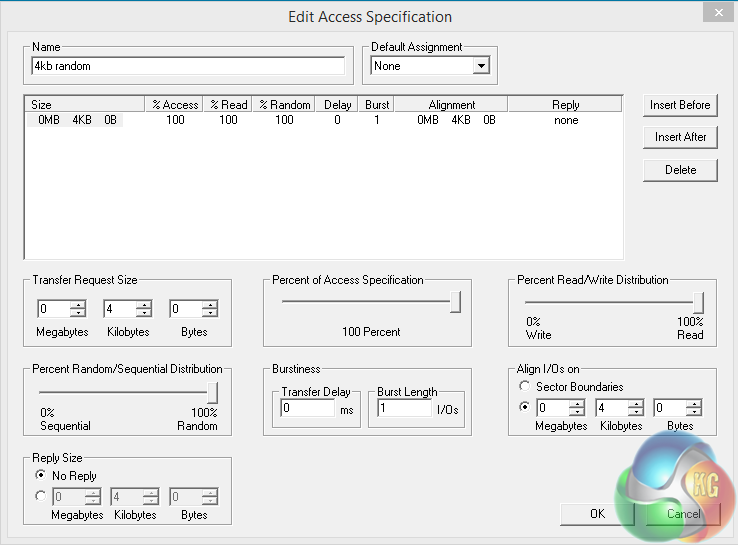
We test with both random read and write 4k tests, as shown above. There are many ways to measure the IOPS performance of a Solid State Drive, so our results will sometimes differ from manufacturer’s quoted ratings. We do test all drives in exactly the same way, so the results are directly comparable.
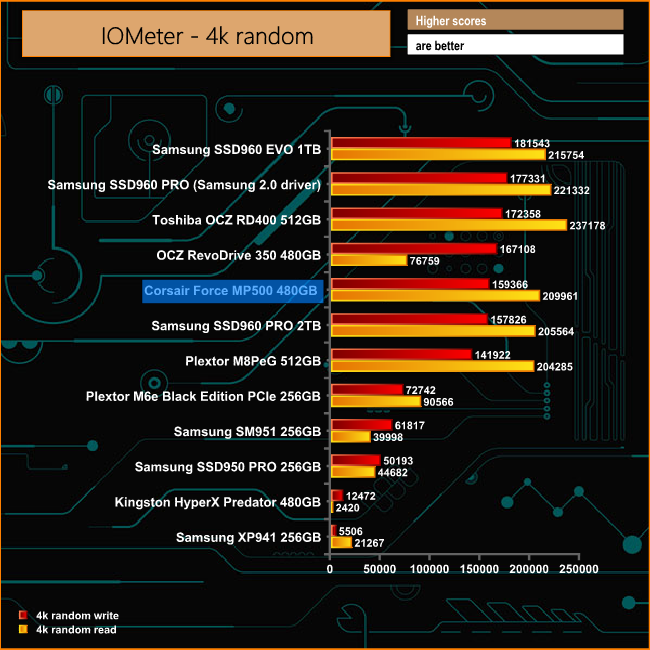
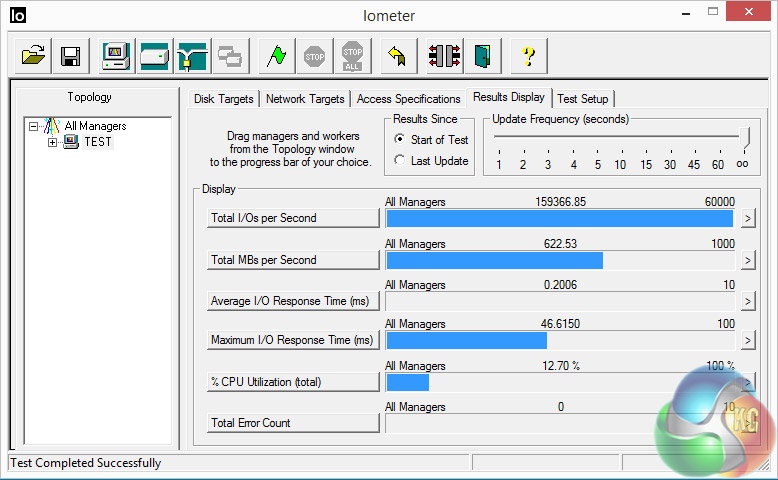

Benchmarked using our test settings with IOMeter, the drive fell way short of the official 250,000 IOPS for reads and 210,000 IOPS for writes at 209,961 IOPS and 159,366 IOPS for read and writes respectively. However, these results are better than the results for the Samsung SSD960 PRO drive using the same default Windows driver.
Futuremark’s PCMark 8 is a very good all round system benchmark but it’s Storage Consistency Test takes it to whole new level when testing SSD drives. It runs through four phases; Preconditioning, Degradation, Steady State, Recovery and finally Clean Up. During the Degradation, Steady State and Recovery phases it runs performance tests using the 10 software programs that form the backbone of PCMark 8; Adobe After Effects, Illustrator, InDesign, Photoshop Heavy and Photoshop Light, Microsoft Excel, PowerPoint, Word, Battlefield 3 and World of Warcraft. With some 18 phases of testing, this test can take many hours to run.
Preconditioning
The drive is written sequentially through up to the reported capacity with random data, write size of 256 × 512 = 131,072 bytes. This is done twice.
Degradation
Run writes of random size between 8 × 512 and 2048 × 512 bytes on random offsets for 10 minutes. It then runs a performance test. These two actions are then repeated 8 times and on each pass the duration of random writes is increased by 5 minutes.
Steady State
Run writes of random size between 8 × 512 and 2048 × 512 bytes on random offsets for final duration achieved in degradation phase. A performance test is then run. These actions are then re-run five times.
Recovery
The drive is idled for 5 minutes. Then a performance test is run. These actions are then repeated five times.
Clean Up
The drive is written through sequentially up to the reported capacity with zero data, write size of 256 × 512 = 131,072 bytes.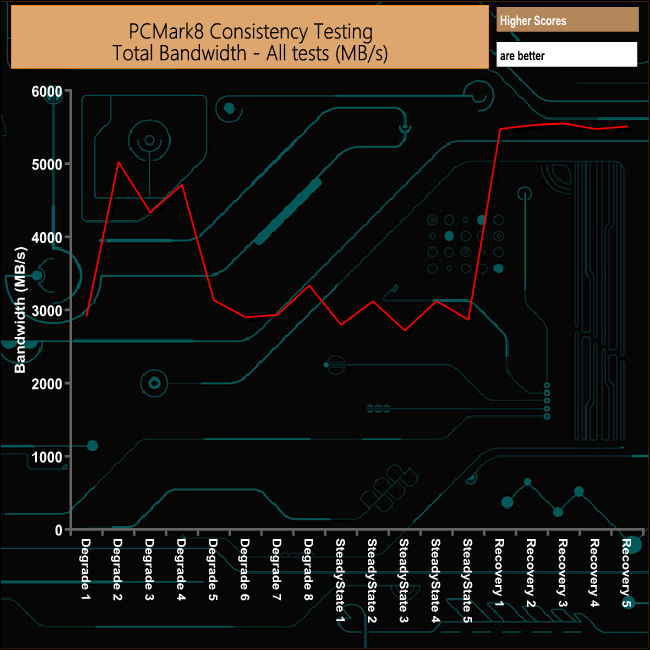
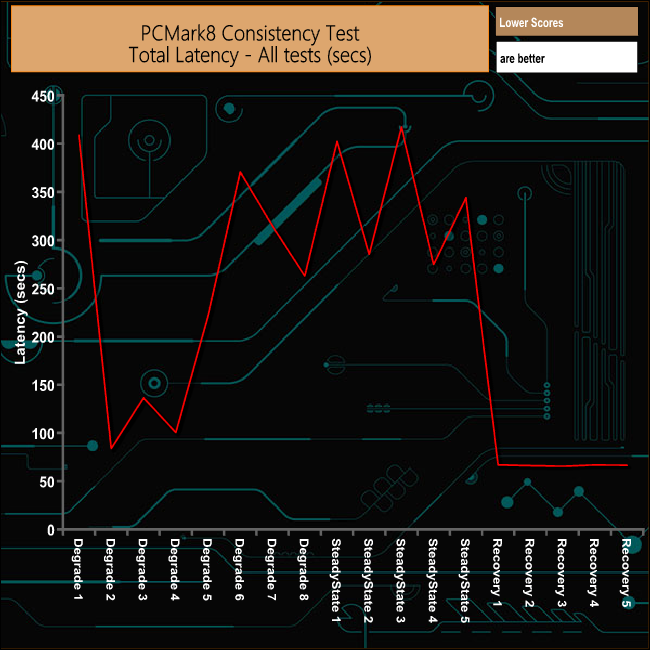
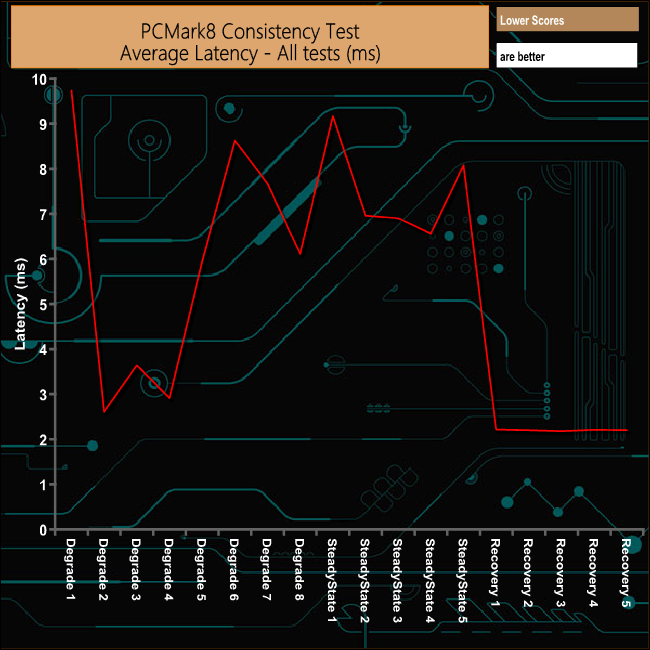
The MP500 takes quite a hit in performance in the latter stages of the degrade tests and during steady state testing, but the drives ability to recover its performance both in terms MB/s and latency is first rate.
PCMark 8's Consistency test provides a huge amount of performance data, so here we've looked a little closer at how the MP500 performs in each of the benchmarks test suites.
Adobe Creative Cloud
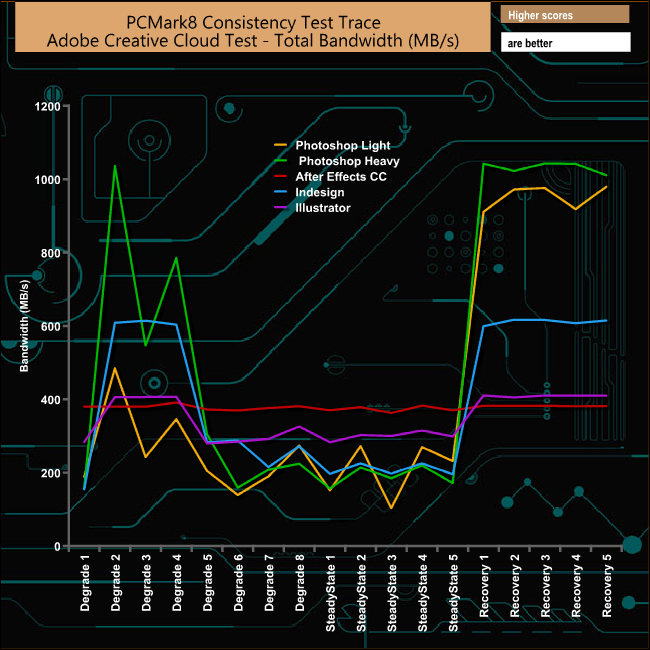
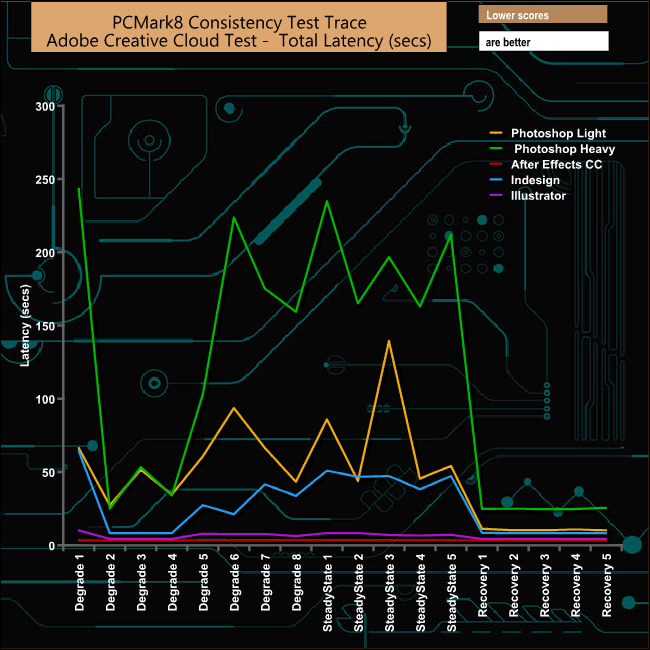
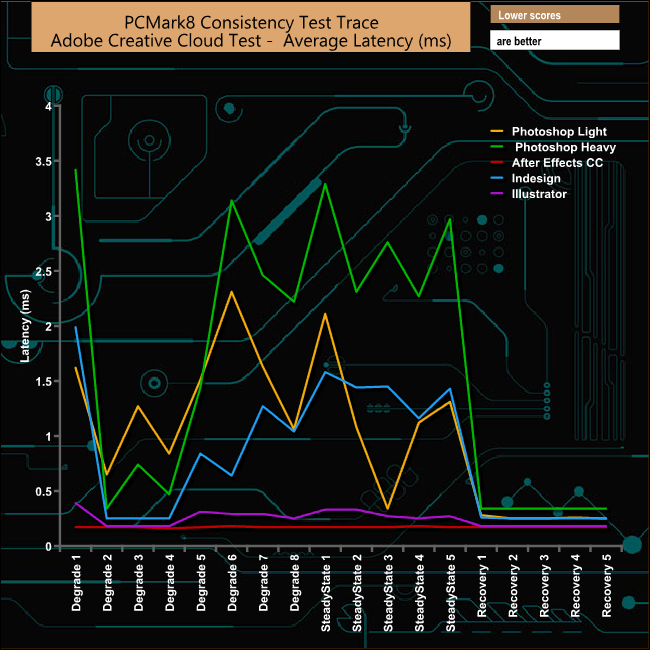
PCMark8's Photoshop Heavy test really does push the drive hard with the bandwidth dropping from 1036MB/s at the start of the Degradation test section to just 159MB/s towards the end of the section and around 200MB/s during the Steady State phase. The drive recovers extremely well from the ordeal, reaching 1040MB/s during the recovery cycle.
Microsoft Office
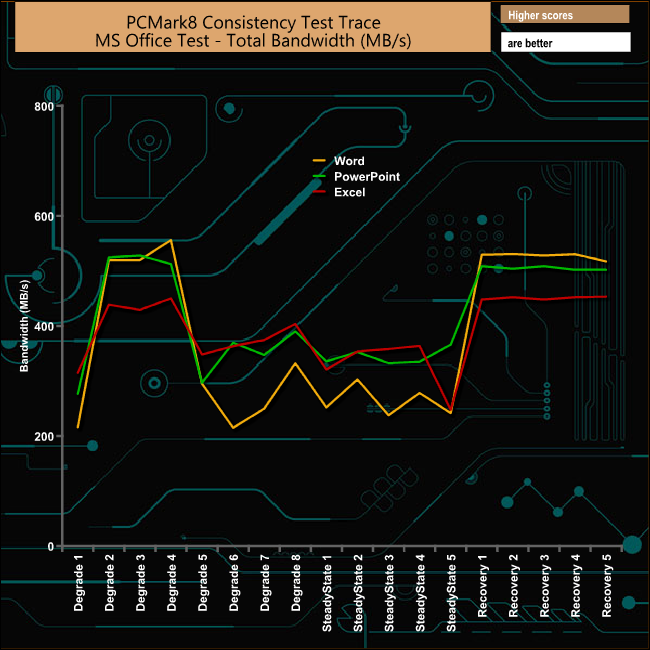
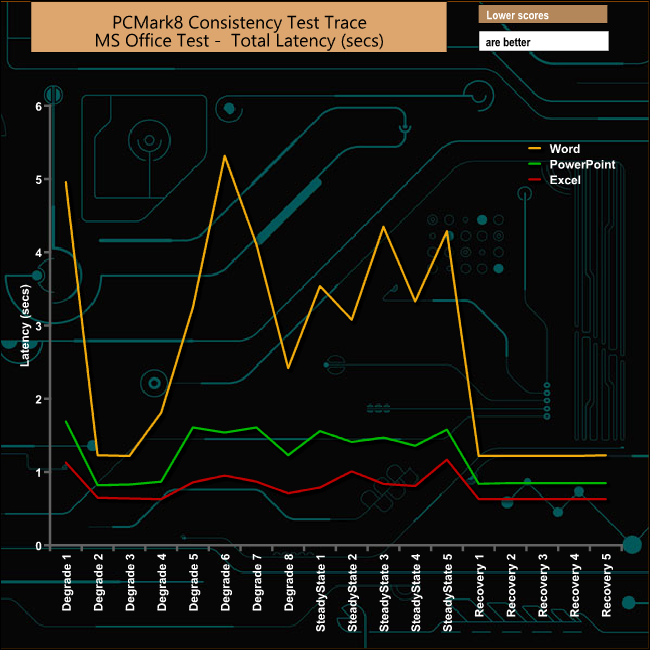
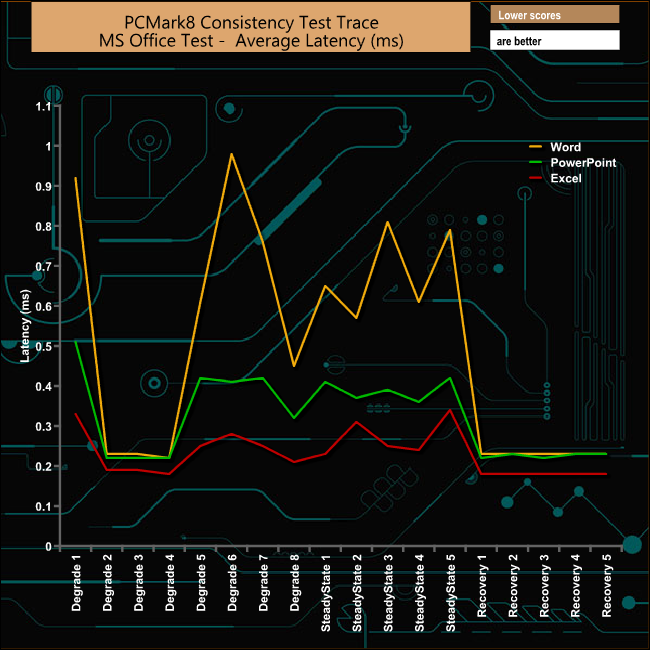
In the Microsoft Office suite, it's the Word tests that stress's the drive but nowhere near as hard as the Photoshop Heavy test. Once again the drive shows superb recovery from the Degrade and Steady State tests.
Casual Gaming
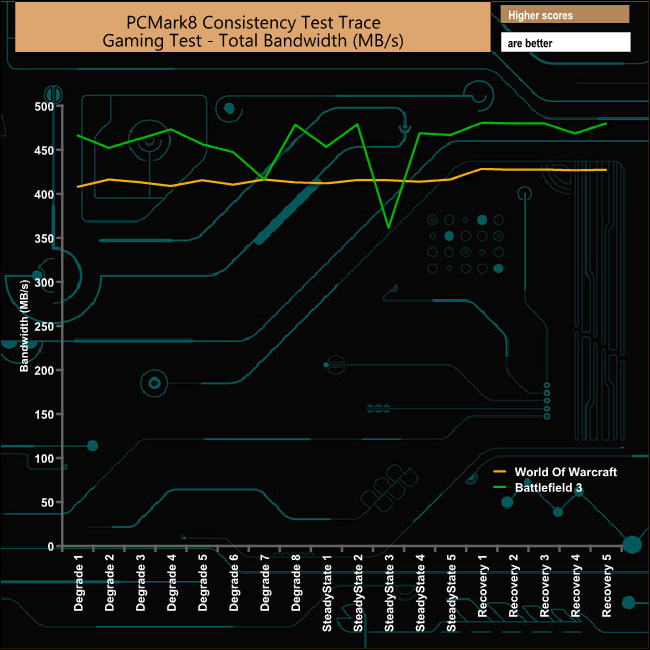
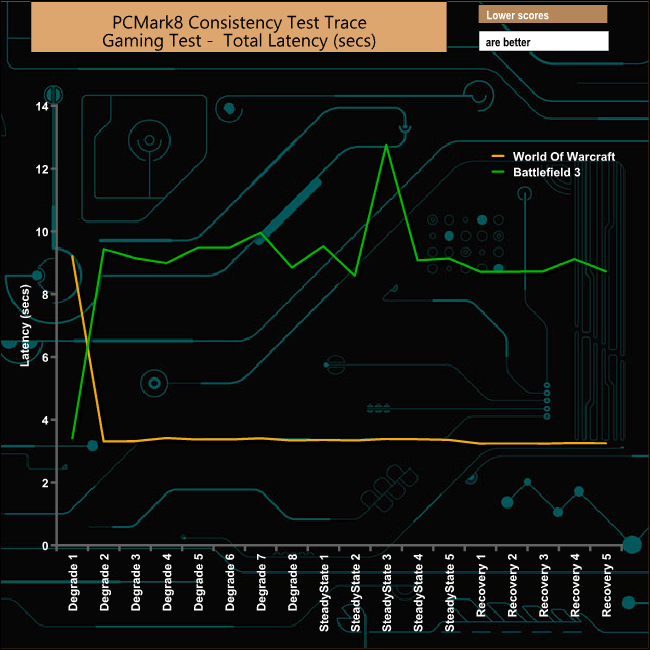
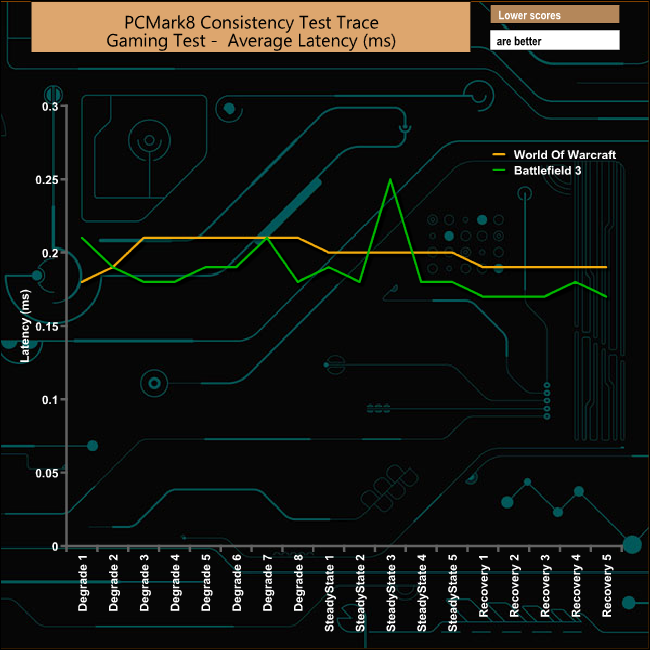
The MP500 makes light work of the Casual Gaming test, the only time it really misses a beat is during the Steady State 3 test run of Battlefield 3.
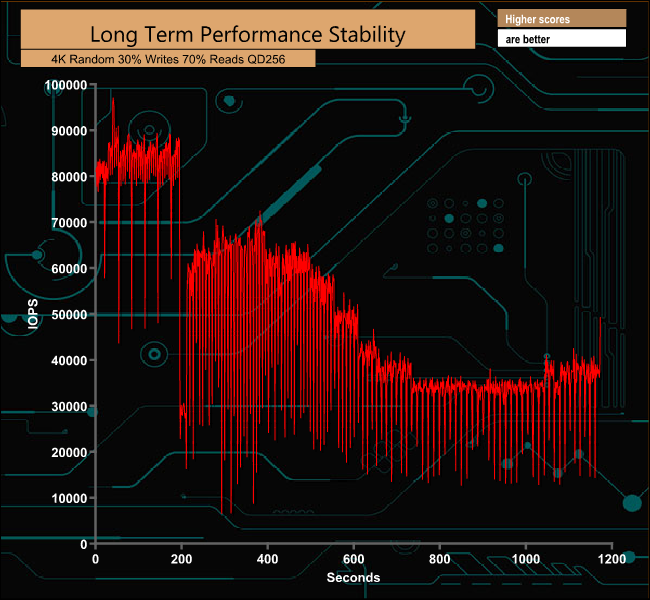
For the long term performance stability test, we set the drive up to run a 20-minute 4K random test with a 30% write, 70% read split, at a Queue Depth of 256 over the entire disk. The 480GB Corsair Force MP500 averaged 49,351 IOPS for the test with a performance stability of 55.6%.
To test real life performance of a drive we use a mix of folder/file types and by using the FastCopy utility (which gives a time as well as MB/s result) we record the performance of drive reading from & writing to a 256GB Samsung SSD850 PRO.
60GB Steam folder – 29,521 files.
50GB File folder – 28,523 files.
12GB Movie folder – 24 files (mix of Blu-ray and 4K files).
10GB Photo folder – 621 files (mix of .png, raw and .jpeg images).
10GB Audio folder – 1,483 files (mix of mp3 and .flac files).
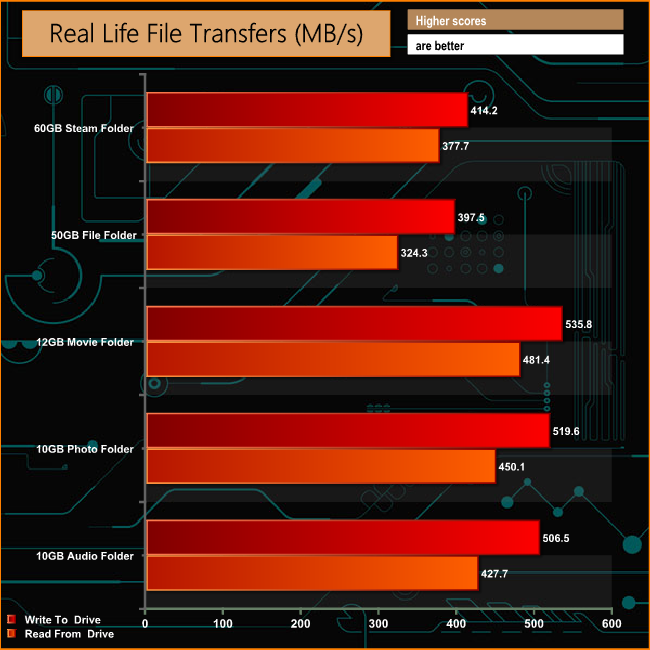
The MP500 had no problems with the real life file transfer tests regardless of the type of files it was asked to deal with.
While Corsair has been busy producing some outstanding cases, PSU and other peripherals of late, things in the storage division of the company have seemed very quiet in comparison, well at least it would seem so from the outside.
Now that's all changed with the launch of the Corsair Force MP500, their first M.2 SSD and the company's fastest drive to date. The MP500 actually marks a hat-trick of firsts for Corsair, not only the first M.2 2280 form factor but also their first NVMe supporting drive as well as the first with a PCIe interface.
The official Sequential read/write figures for the 480GB MP500 are up to 3,000MB/s and s2,400MB/s respectively which were pretty much confirmed under testing with the ATTO benchmark as we got 2,975MB/s for reads and 2,391MB/s for writes. It was a different story when it came to the 4K random read/writes results from IOMeter.
Using our test configuration the drive produced figures of 209,961 IOPS and 159,366 IOPS for reads and writes respectively, pretty impressive but way short of the official up to 250,000 IOPS read and up to 210,000 IOPS write figures.
The drive survived the rigors of PCMark8's Consistency test without any problems, recovering fully from the stresses of both the Degradation and Steady State series of tests.
At the time of writing this review, the Toolbox management software needs some tinkering with because as it stands if offers little to no support for the drive. The 480GB drive comes with an impressive TBW endurance figure of 698TB and Corsair back the drive with a 3-year warranty – it would be nice to see the drive backed by a 5-year one like some of its competitors offer.
The MP500 is a fast drive and indeed is the fastest Corsair drive we have seen to date but it still lags behind both versions; the PRO and EVO of Samsung's SSD960. But the fly in the ointment as far as performance v price is concerned is Corsair's pricing of the drive. The 480GB version of the drive costs around £305 which doesn't look so inviting when you consider the 500GB EVO version of the SSD960 is cheaper at around £278 while if the budget can stretch a bit higher than the MP500, the 512GB SSD960 PRO is around £60 more expensive.
We found the 480GB version of the MP500 available to pre-order at Overclockers for £304.99 (inc VAT) HERE
Pros
- Performance.
Cons
- Management software urgently needs updating.
- Pricing needs a tweak.
- 3-year warranty seems a bit mean.
Kitguru says: It's good to see Corsair back at the sharp end of things in the SSD market but the pricing of the MP500 needs a little tinkering with to make it truly competitive.

Be sure to check out our sponsors store EKWB here