

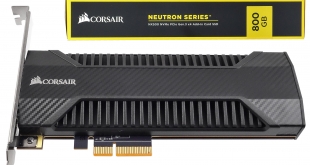
Corsair might not be the first name that springs to mind when thinking about SSDs but the company has a portfolio of drives for the mainstream and high-performance ends of the drive market. The latest drive joining the latter market segment is the Neutron NX500.
The new Neutron NX500 is built on an HHHL (Half-Height, Half-Length) format with a PCIe Gen3 x4 NVMe interface. It uses a combination of a Phison PS5007-E7 controller and 15nm MLC NAND.
At launch, the drive is available in two capacities; 400GB (CSSD-N400GBNX500) and the 800GB (CSSD-N800GBNX500) flagship we are looking at here, with a 1.6TB version slated for launch in a couple of months.
Quoted Sequential read/write performance for the 800GB drive are up to 3,000MB/s and 2,400MB/s respecitvly. 4K random performance is quoted as up to 300,000 IOPS for reads and up to 270,000 IOPS for writes.
Corsair state that the endurance for the drive is 1,396TBW and back the drive with a 5-year warranty.
Physical Specifications:
Usable Capacities: 400GB 800GB
NAND Components: 15nm Toggle 2.0 MLC
Interface: PCIe 3.0 x4 NVMe
Form Factor: HHHL (Half-Height, Half-Length)
NAND Controller: Phison PS5007-E7
Dimensions: 165 x 121 x 21mm
Firmware Version: E7FM04.5
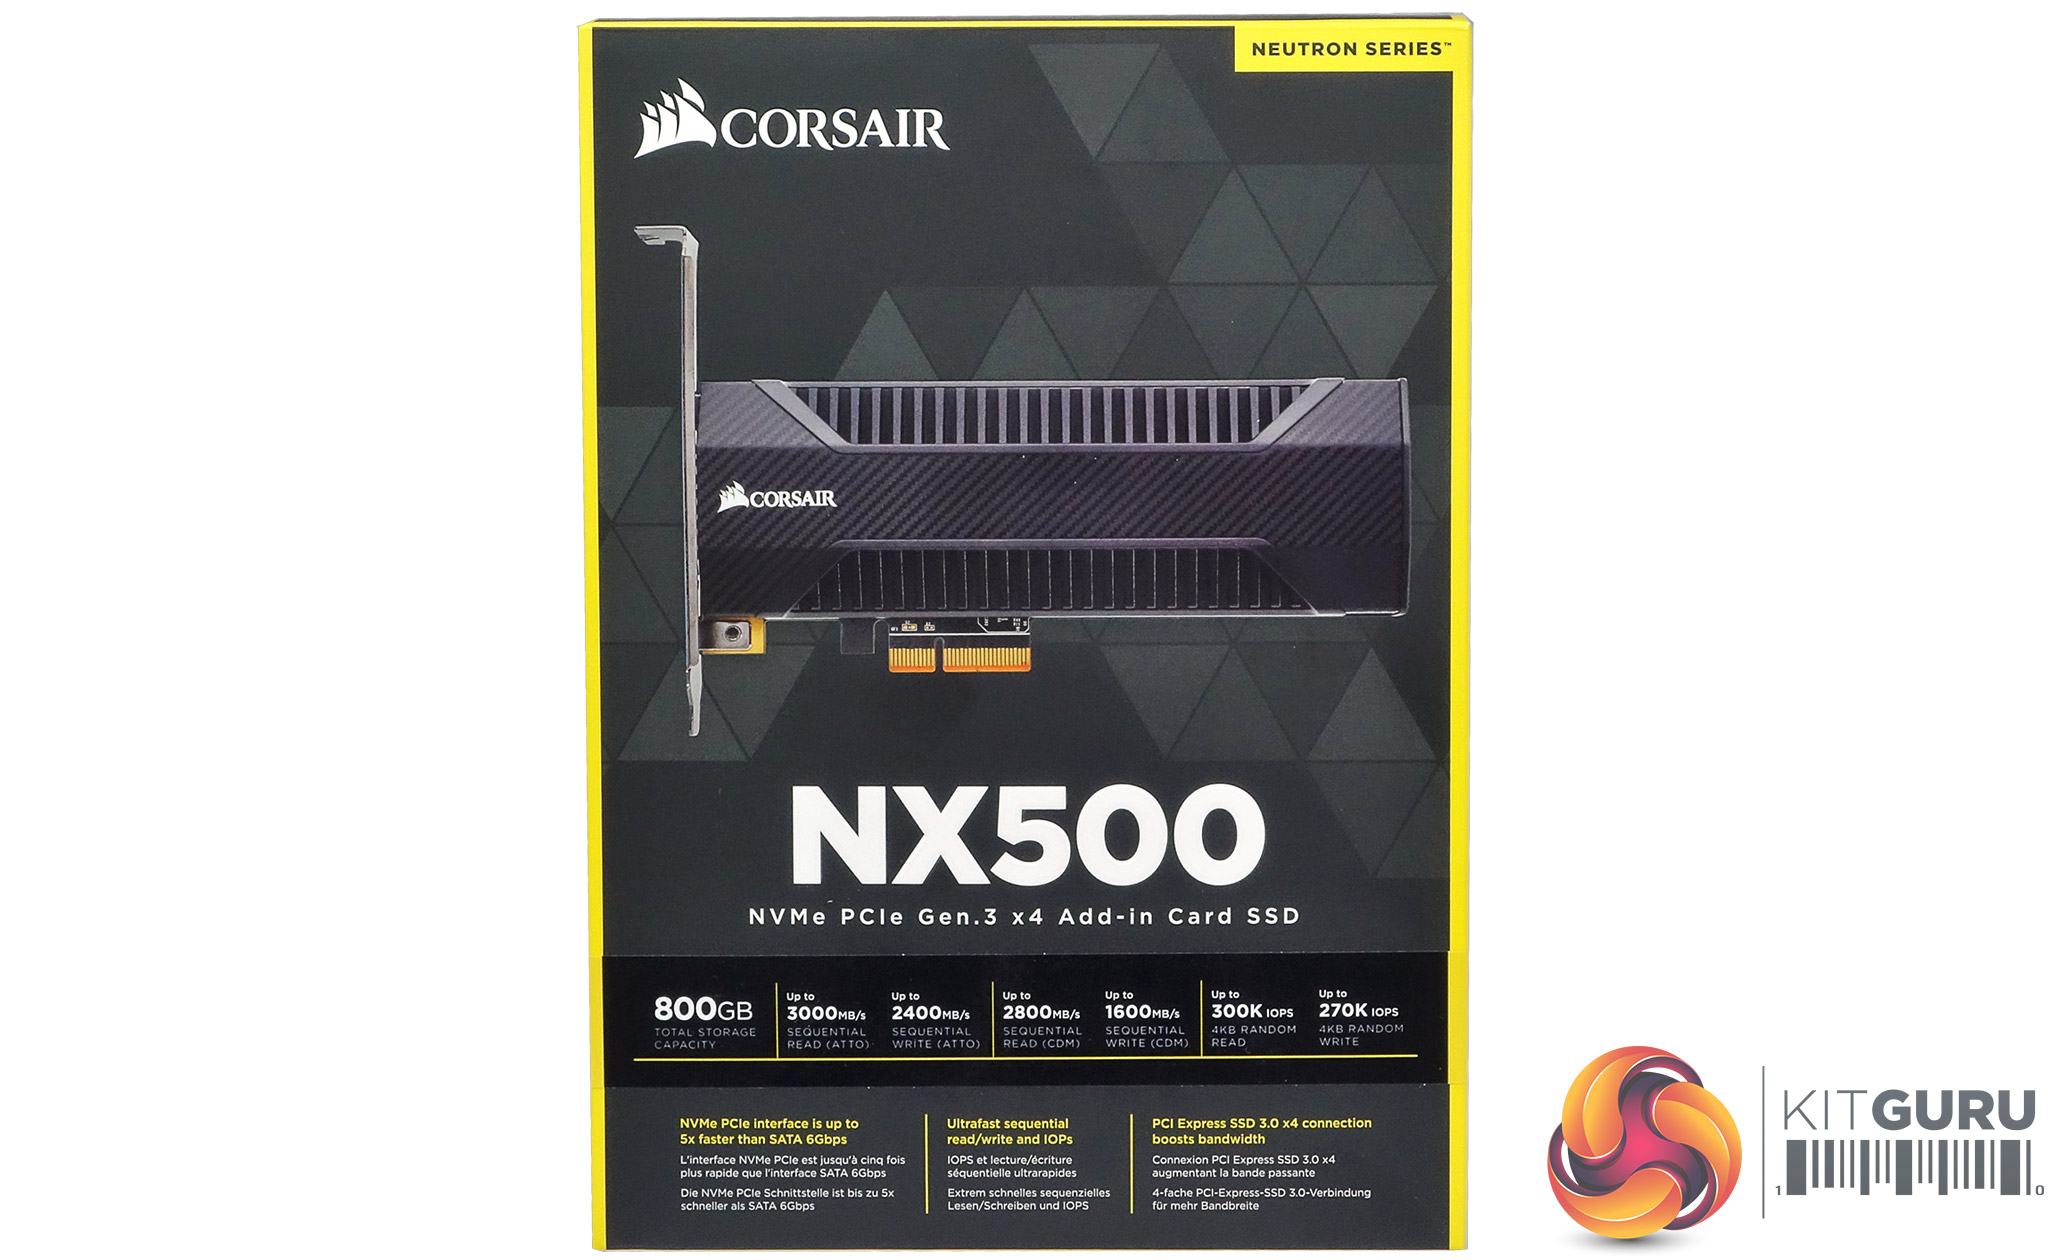

The Neutron NX500 comes in a stylish box with a good, clear image of the drive on the front. The drive image and the model number are raised slightly off the box surface and have a high gloss finish.
A band runs along the front of the box and down both sides which displays the drive's capacity (with is repeated on both side panels) and Sequential and 4K random read/write performance figures. Under this band are three panels with brief information points about the NMVe PCIe interface, the drive performance and the PCIe x4 interface.
On the right hand side of the rear of the box are images of the drive in two planes with dimensions. Once again, these images have a high gloss finish which makes them stand out against the black background of the box. Under these images is a graph showing how effective the heatsink is. The left hand side of the box rear is given over to multilingual marketing points about the drive.
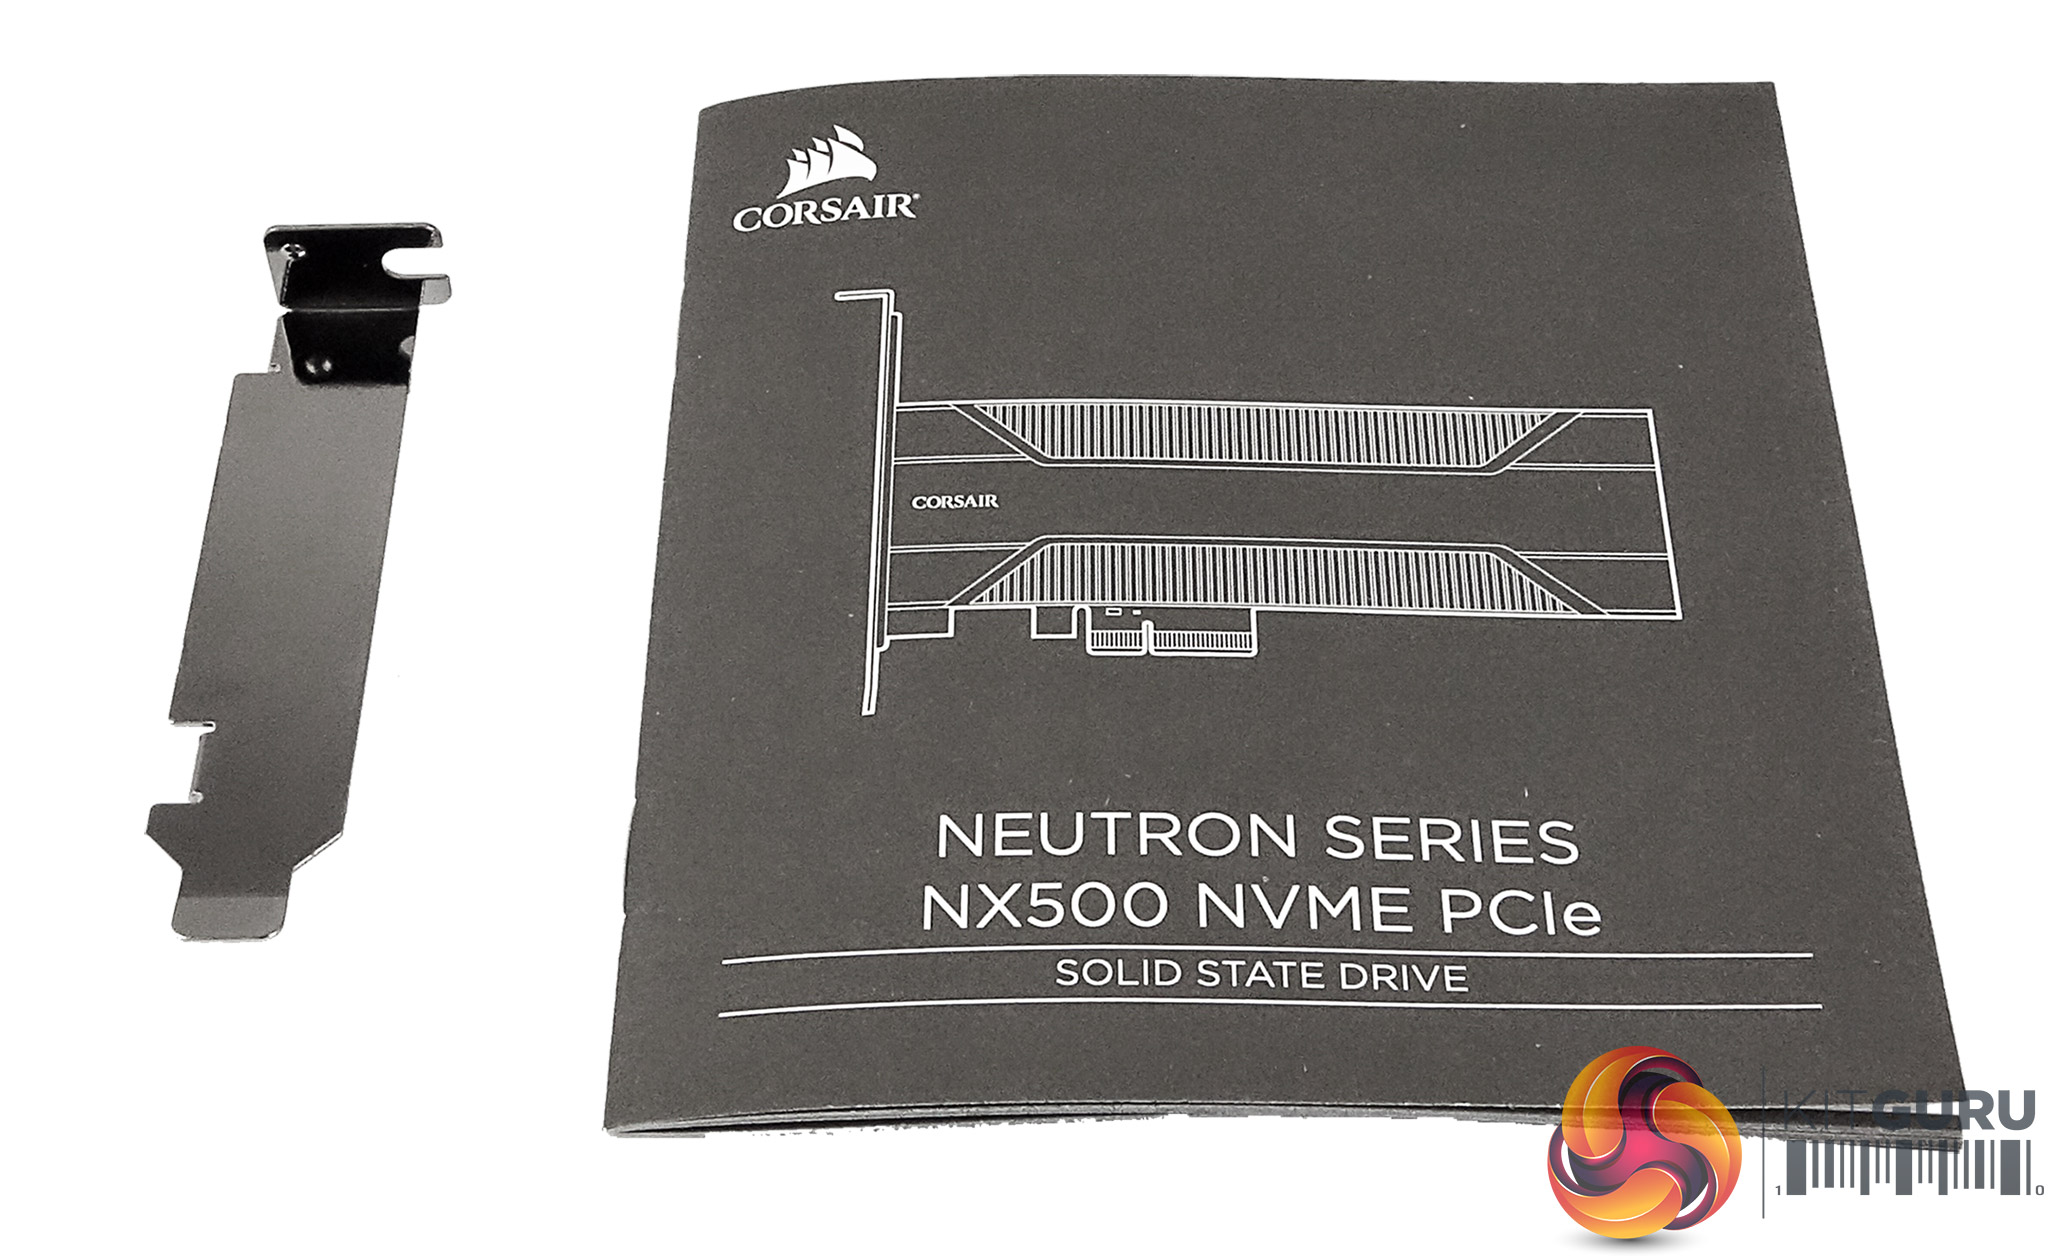
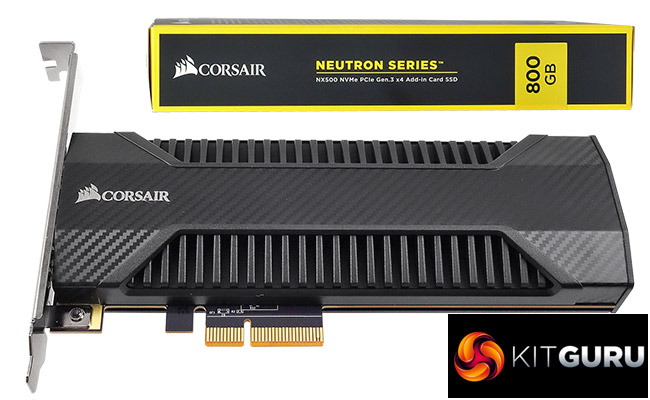
Bundled in with the drive is a low profile bracket and a quick installation guide.
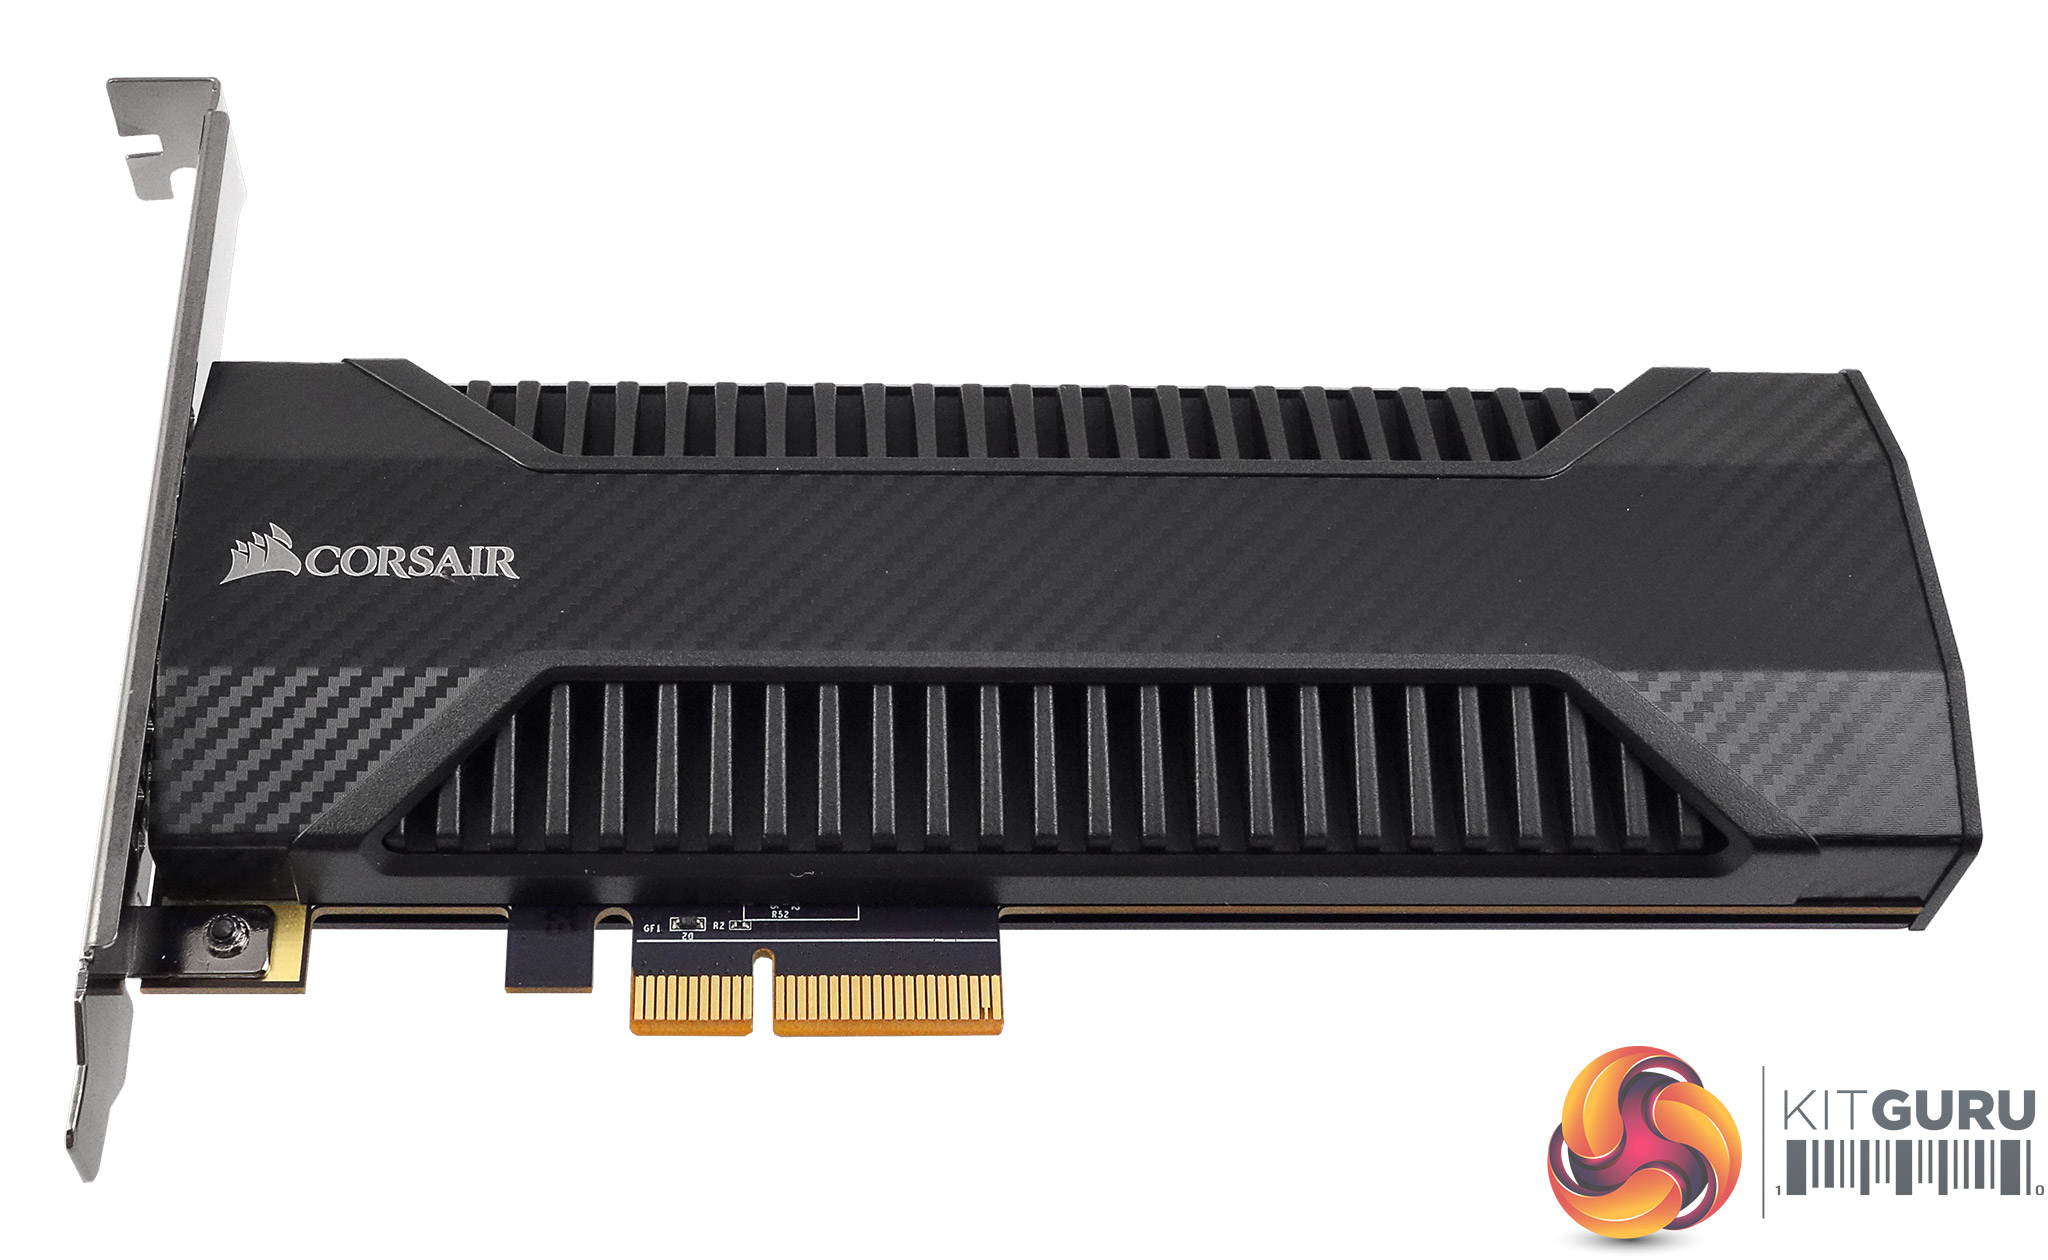
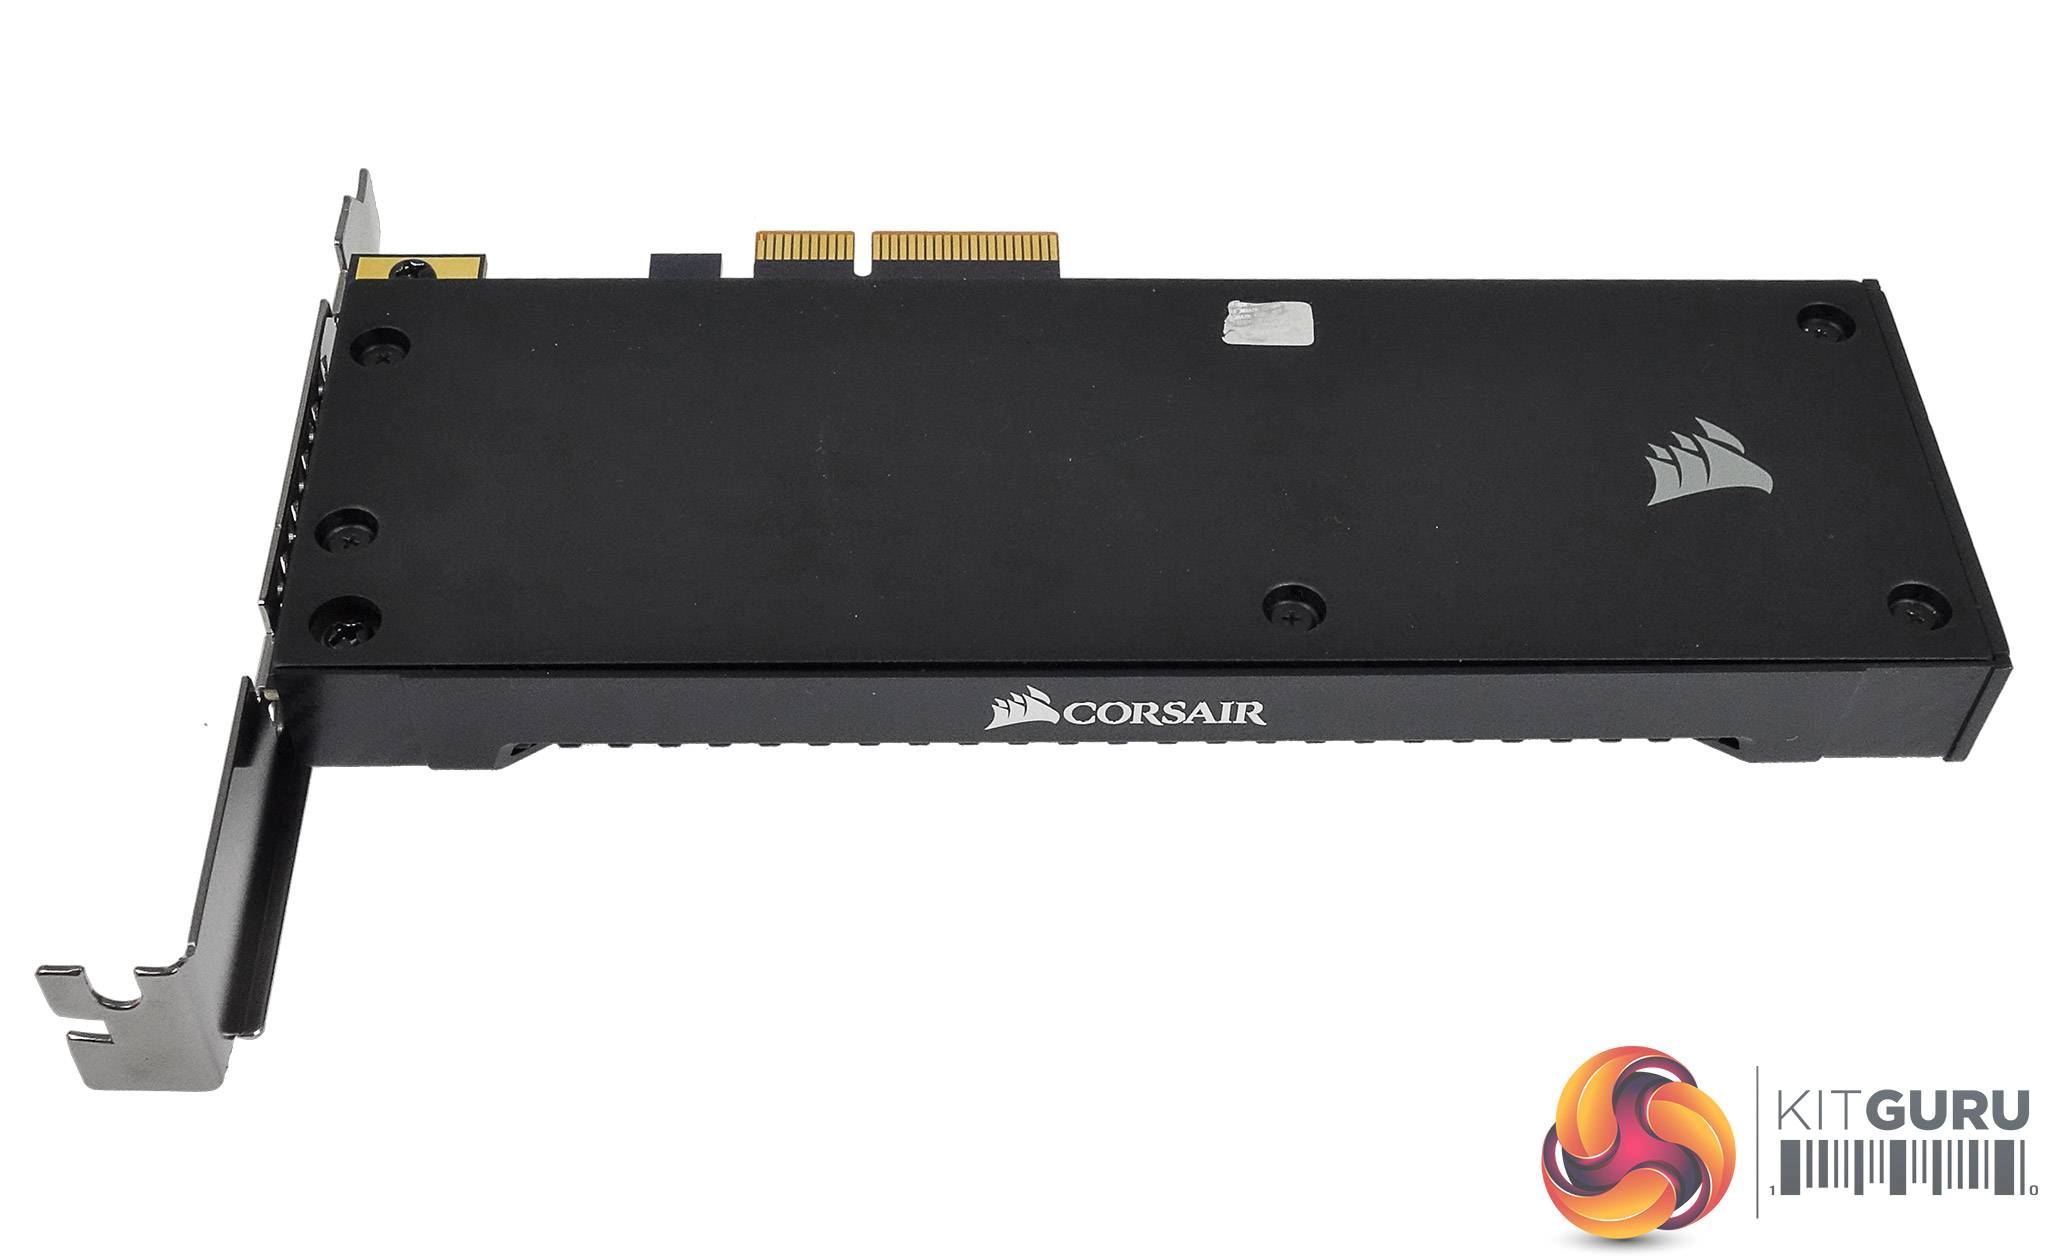
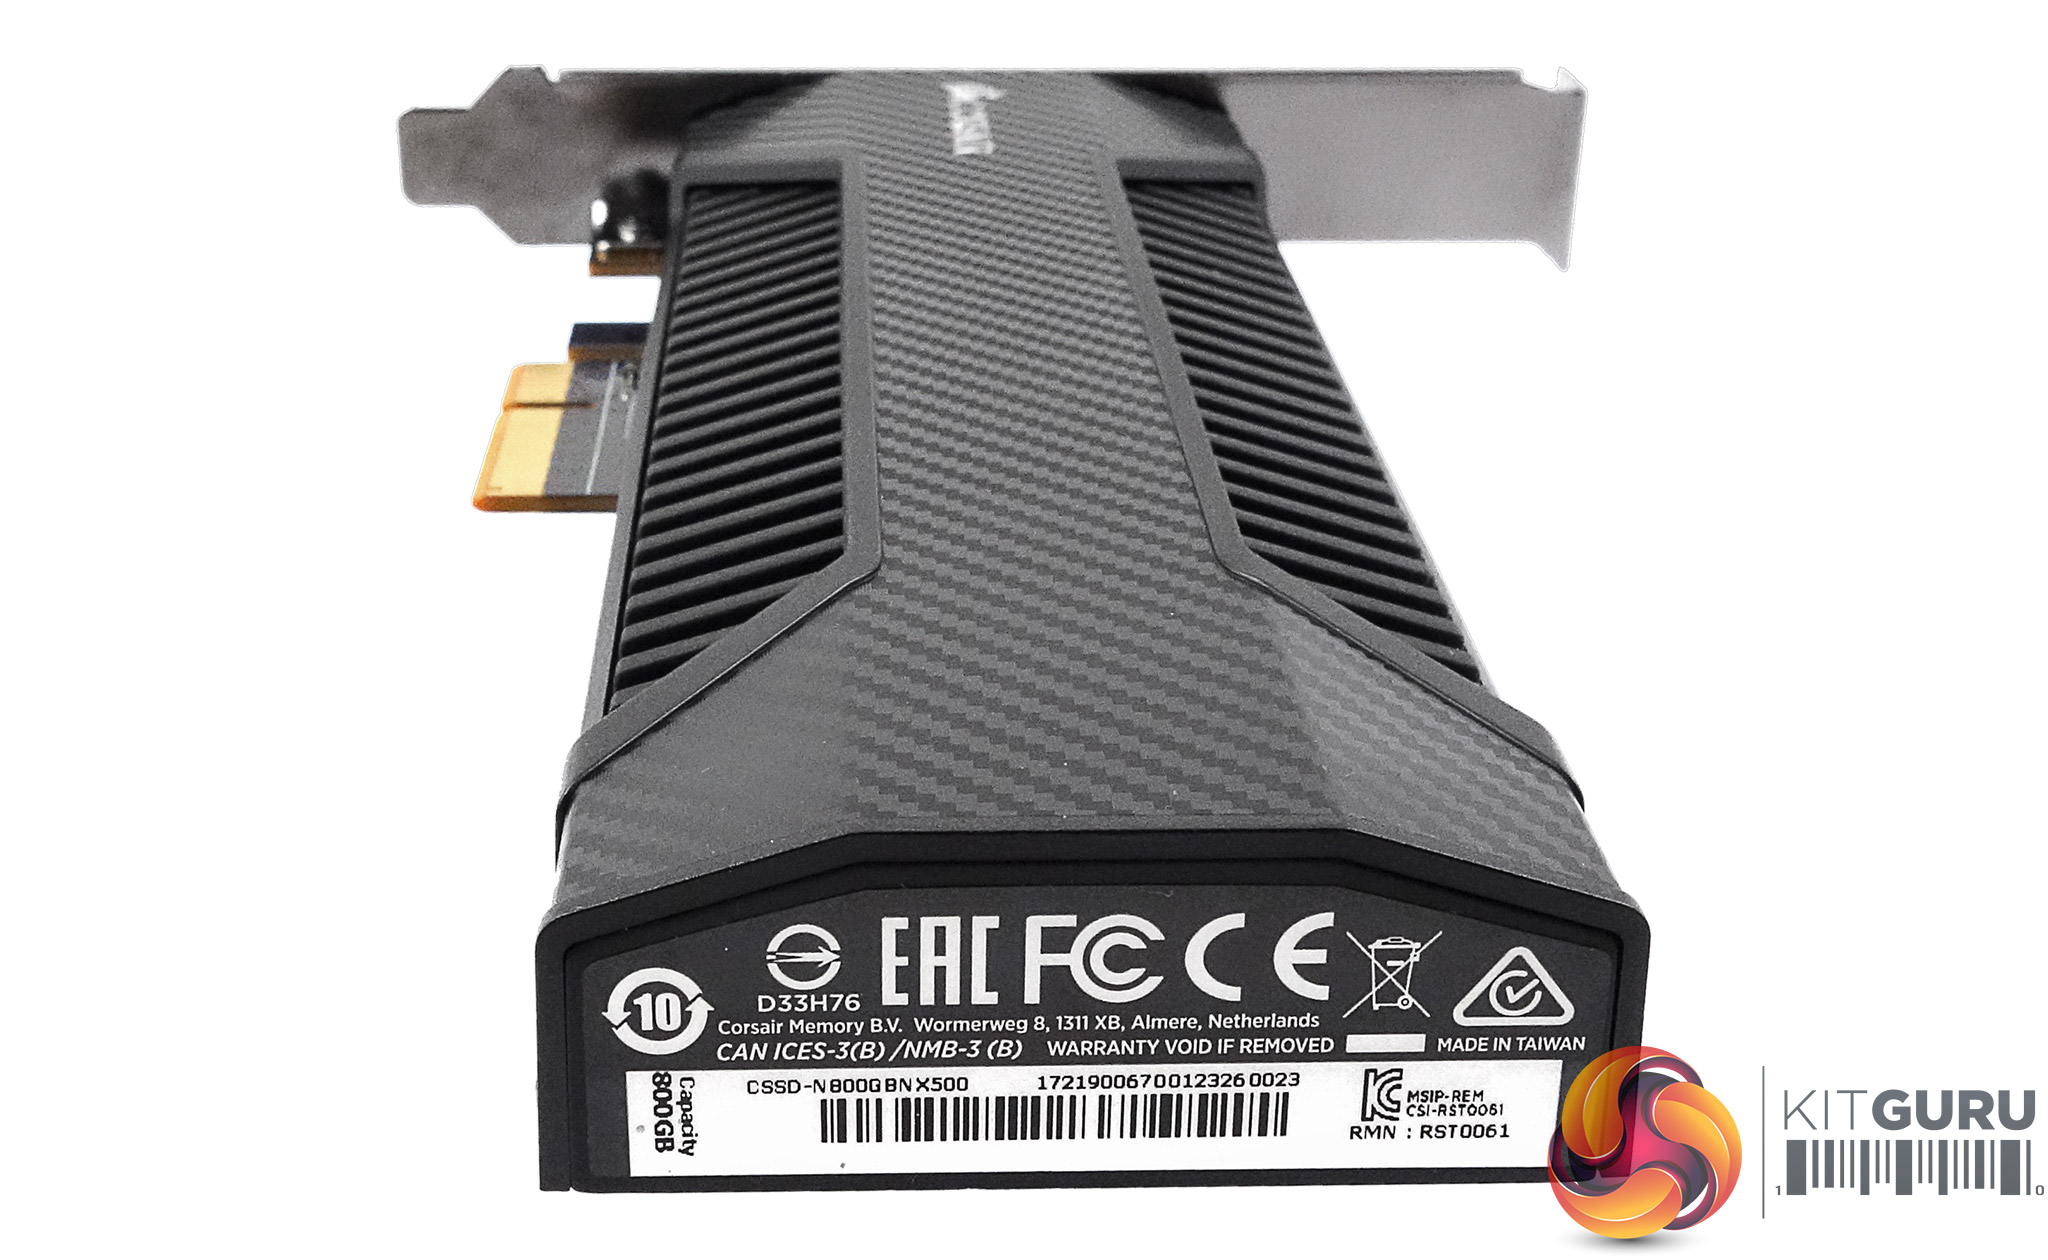
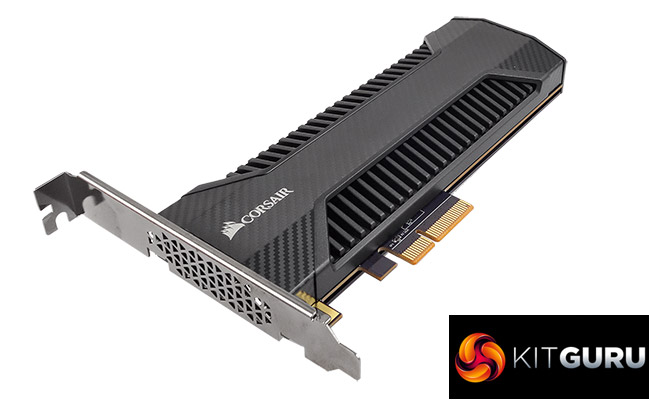
The PCB is completely covered by an attractive looking heatsink/cooler on the front, with the centre section sporting a neat carbon fibre-like finish. The rear of the PCB is covered by a plain plate with the Corsair logo on it.
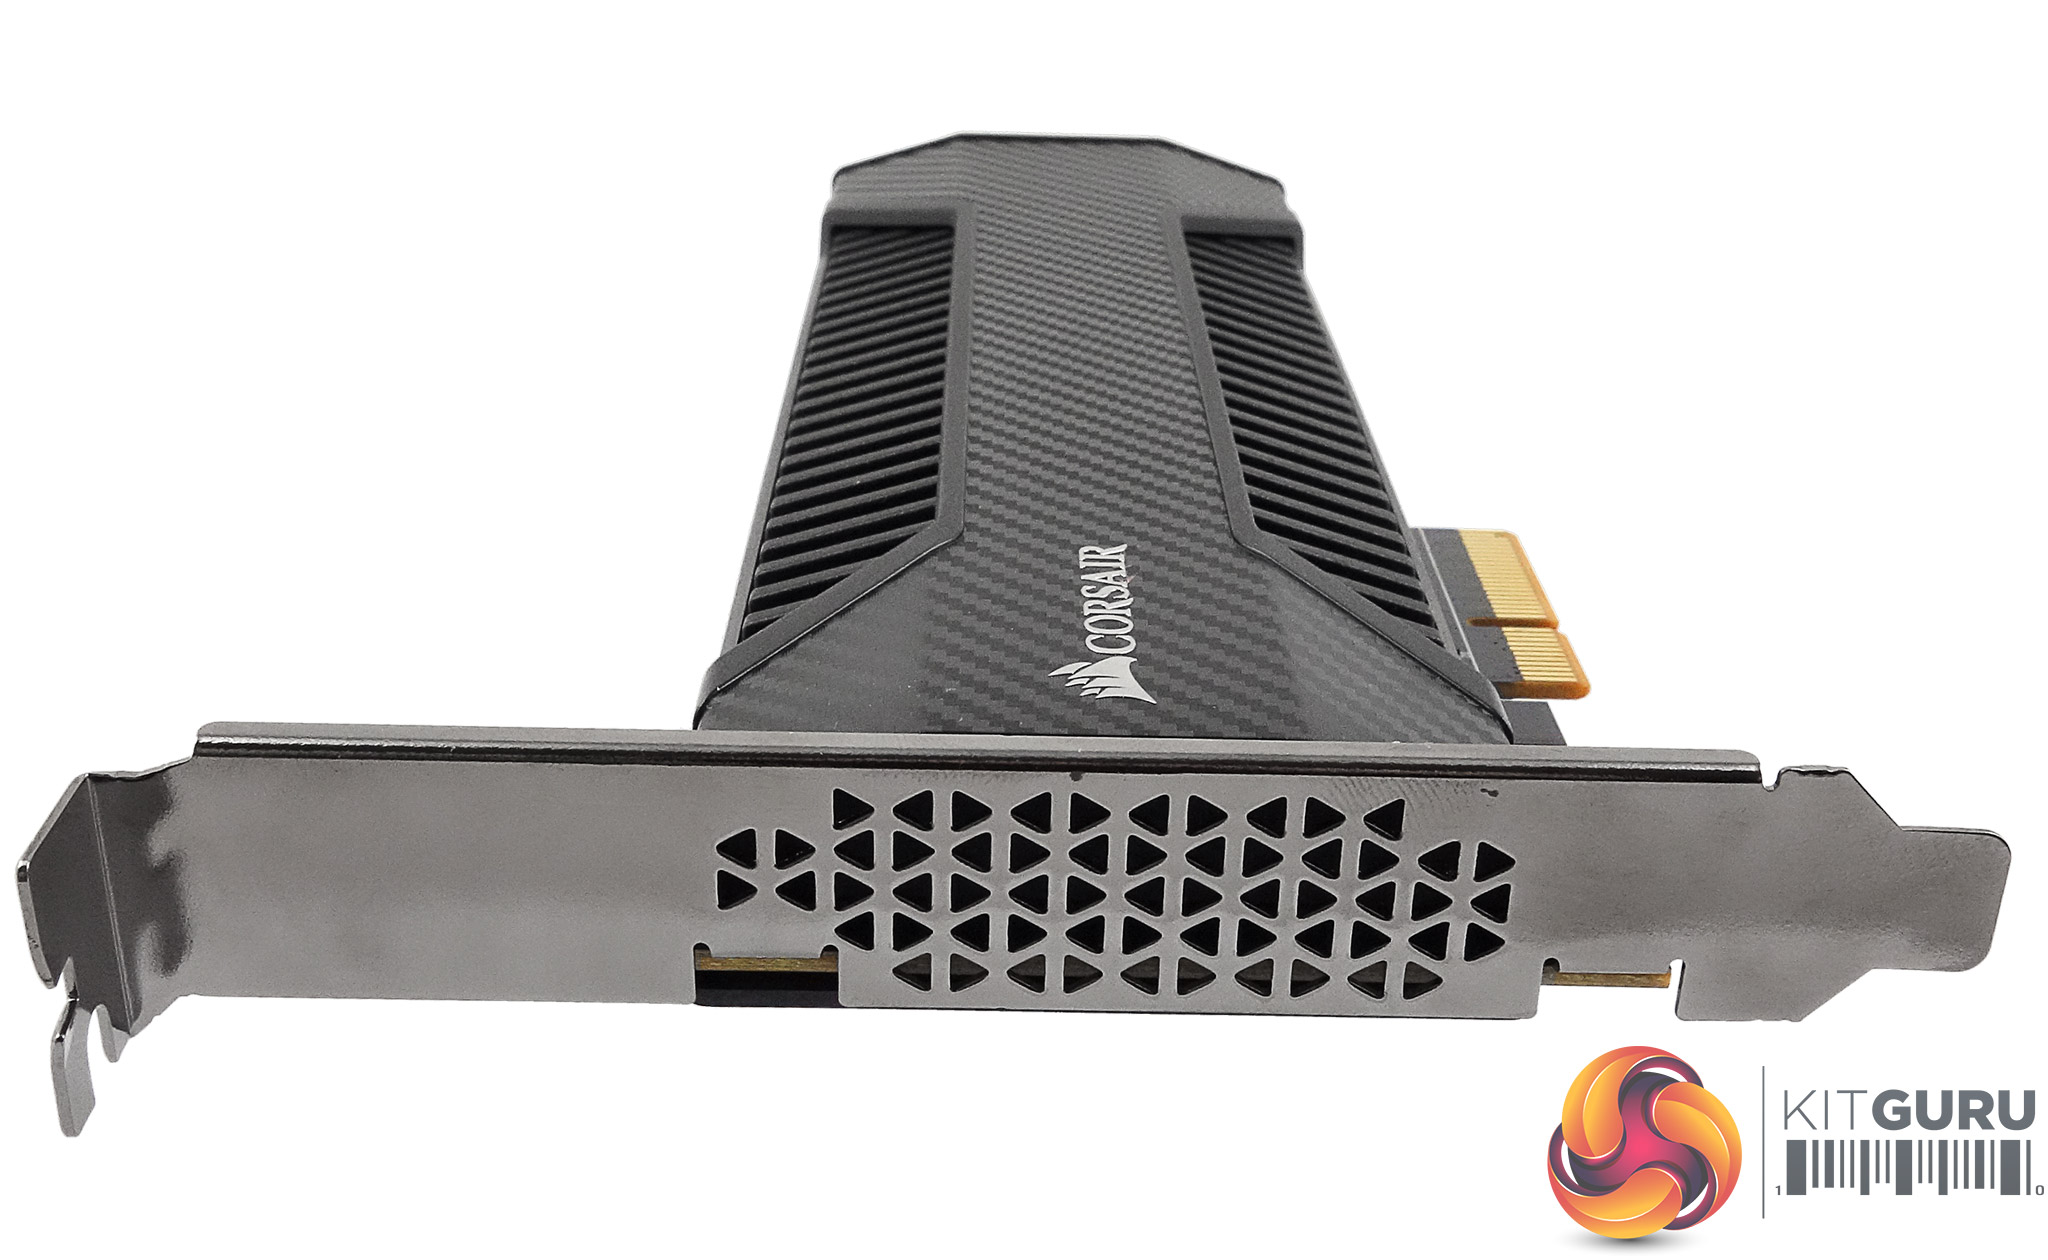
The PCIe mounting bracket has a neatly designed grill cut in it to aid in the cooling of the drive.
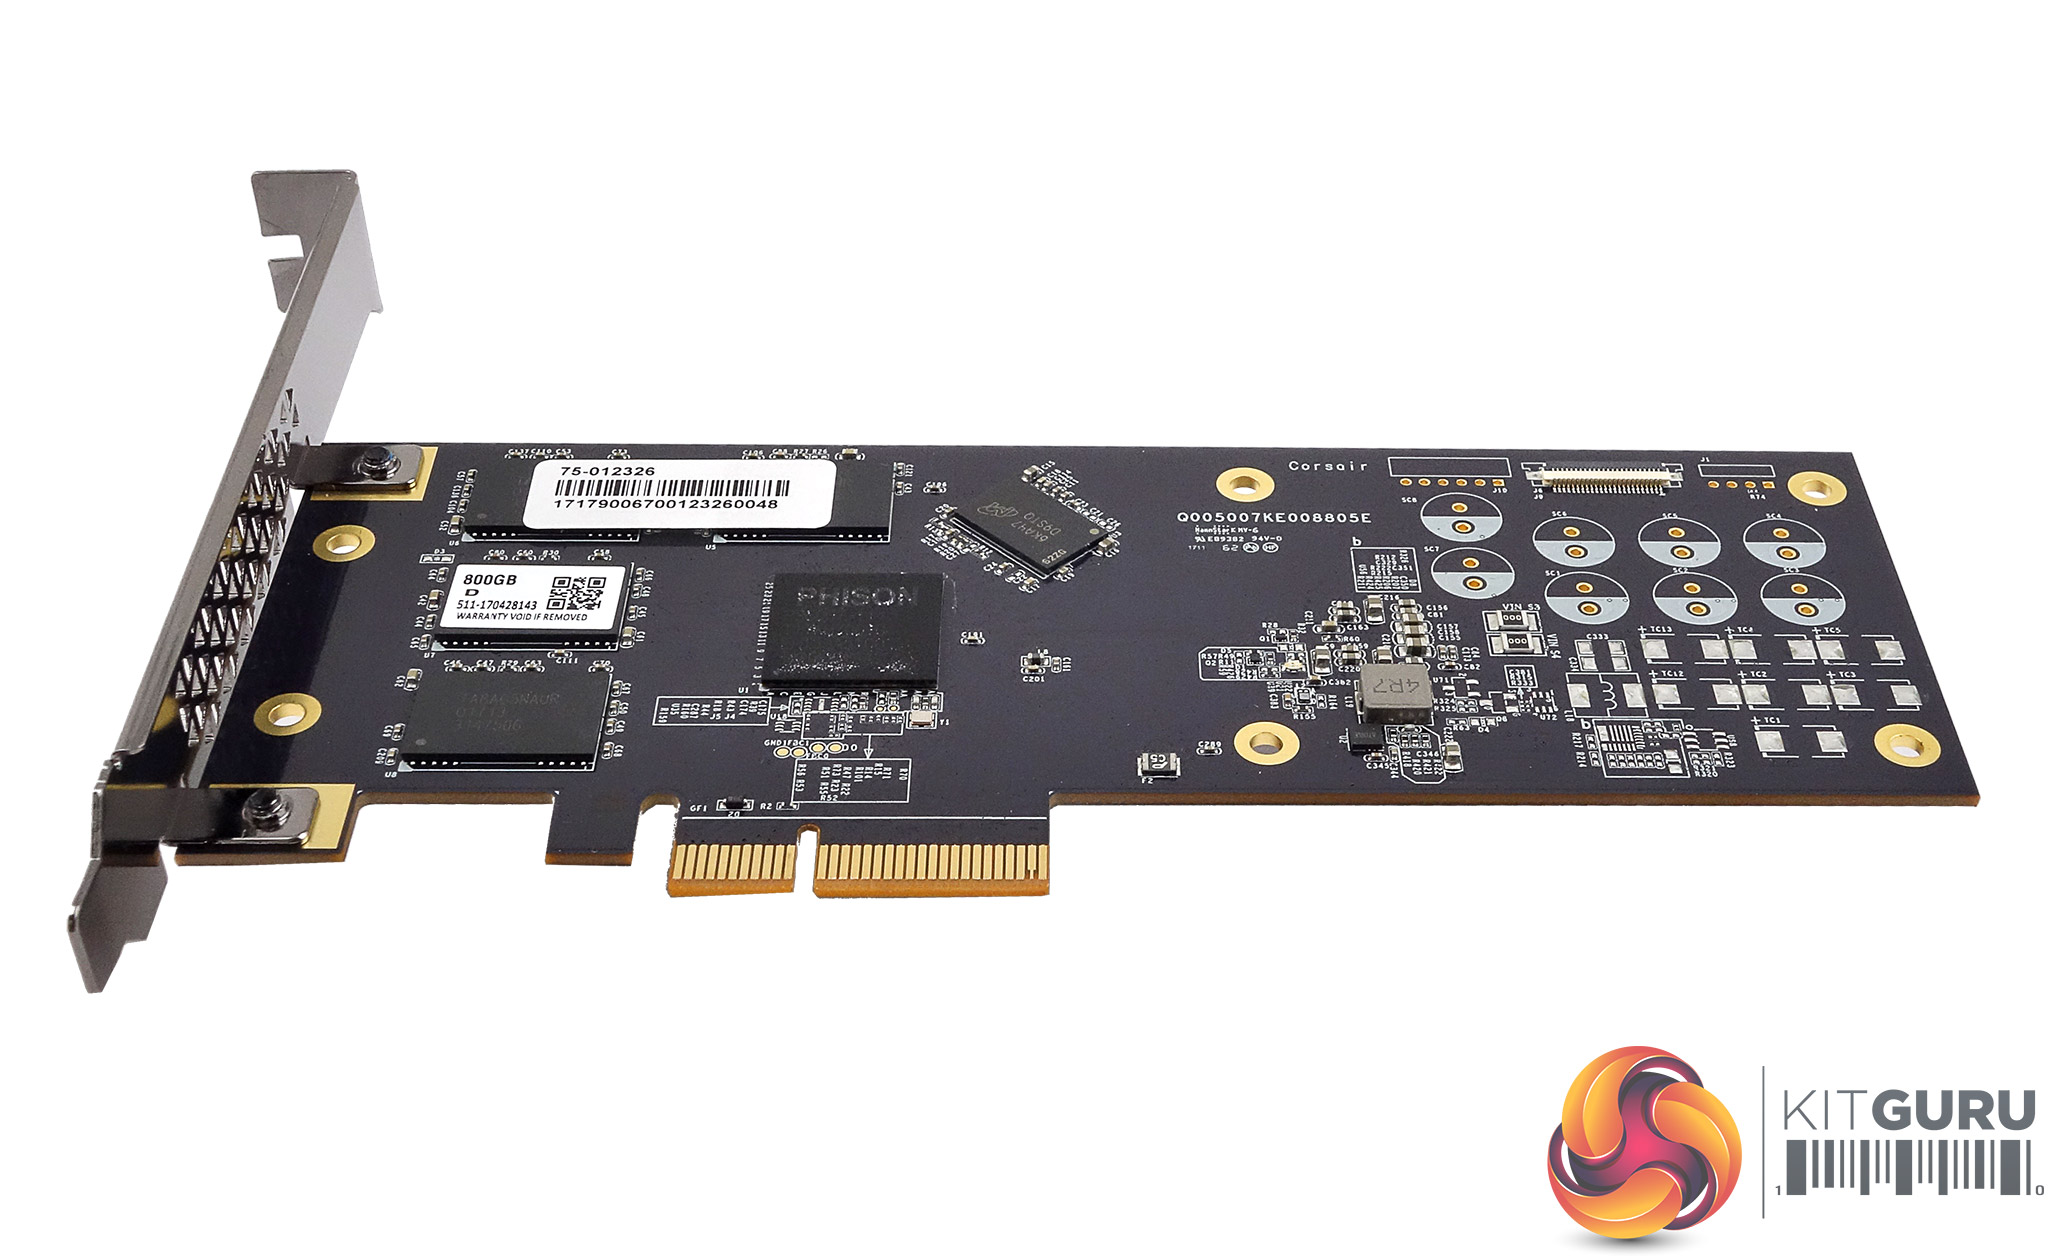
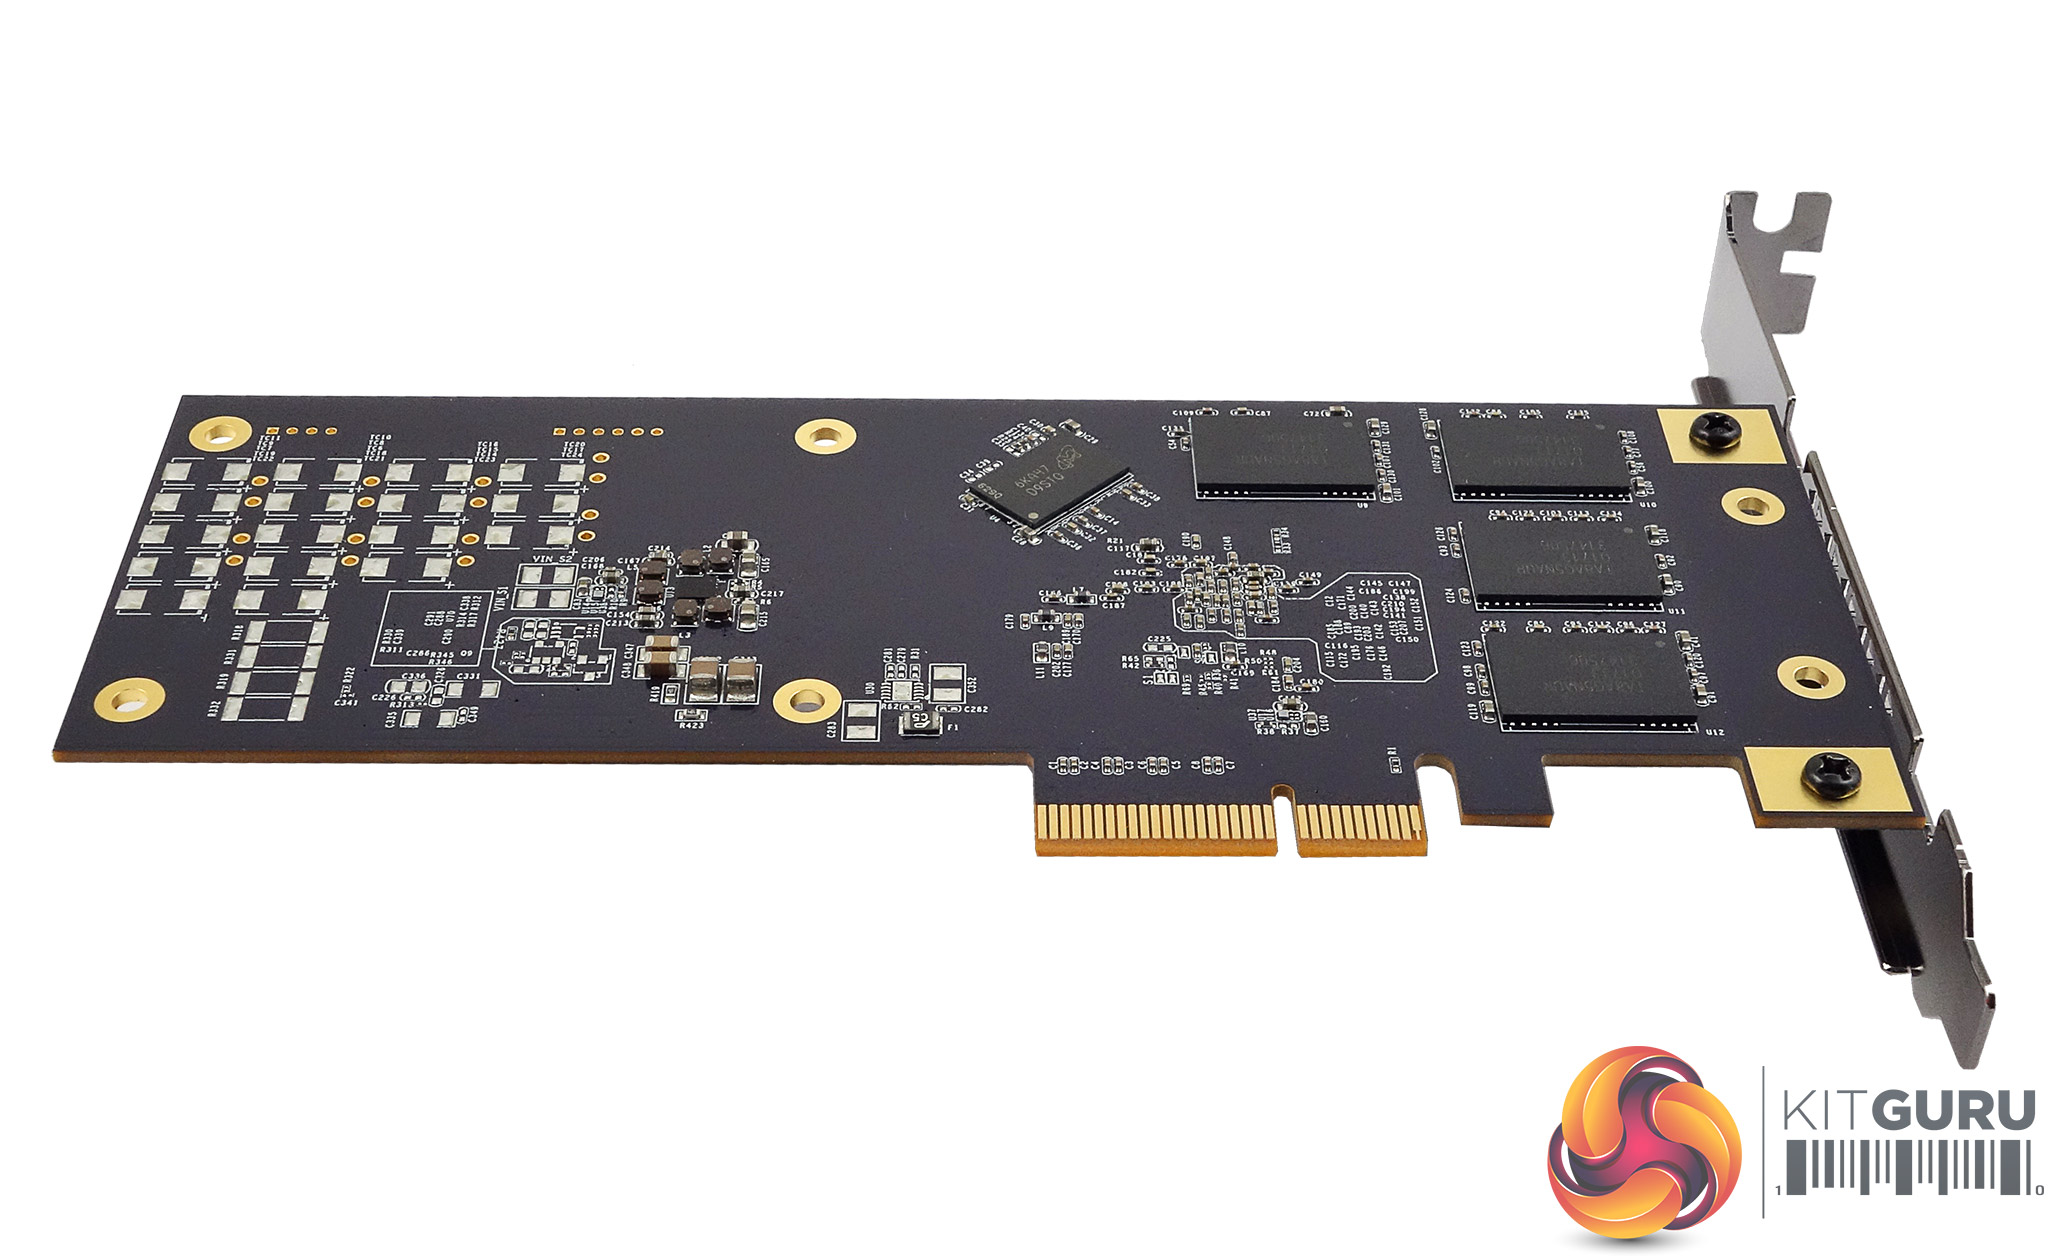
The top of the PCB itself holds four Toshiba 15nm MLC NAND packages coded TA8AG5NAUR, the Phison PS5007-E7 controller and a DDR3-1600 Micron cache chip. The rear of the board holds another four NAND packages and a second cache chip. The two cache chips give the 800GB NX500 a total of 2GB of cache (the 400GB drive makes do with 1GB of cache).
The 8-channel PS5007-E7 is Phison’s first NVMe controller and features SmartECC, which reconstructs faulty pages due to ECC failures, SmartRefresh which monitors ECC health status and refreshes ECC blocks periodically which improves data retention and SmartFlush. SmartFlush cuts down the amount of time any data is spent in cache which helps to ensure maximum data retention should the drive suffer a power loss.
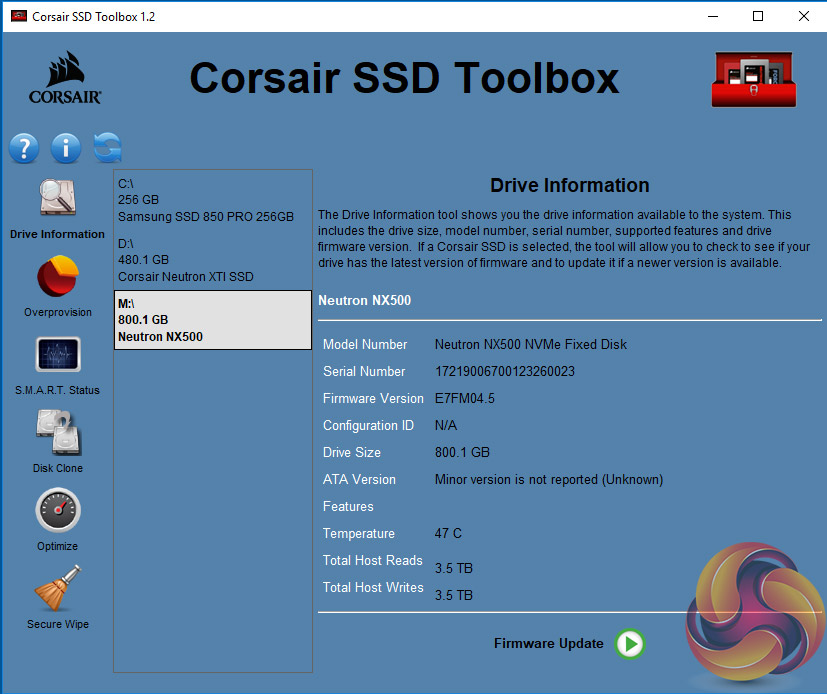
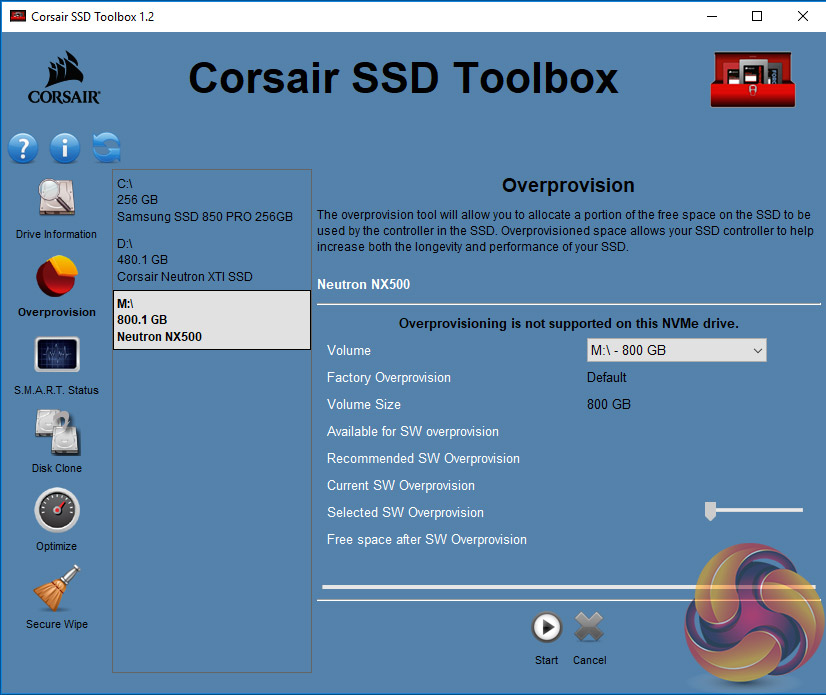
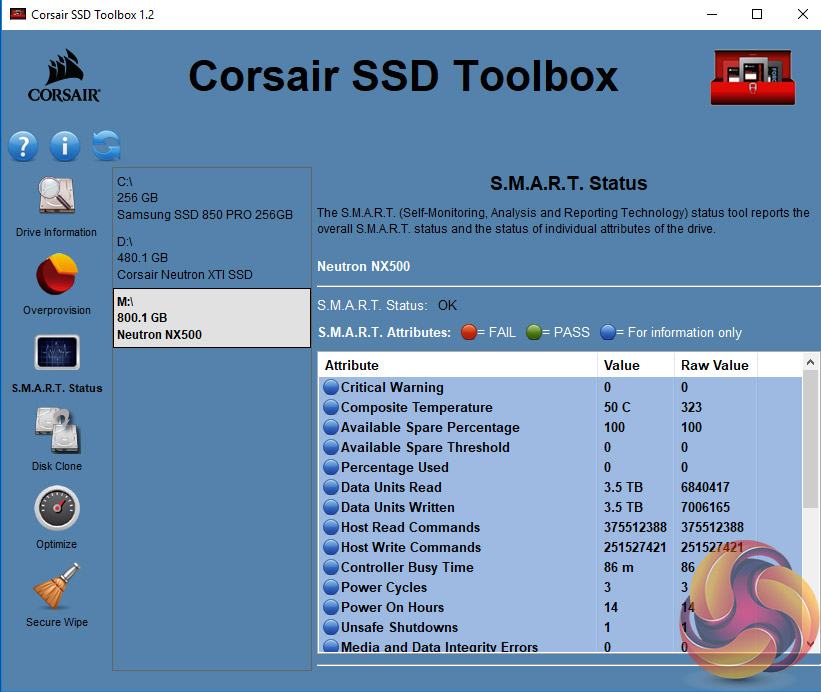
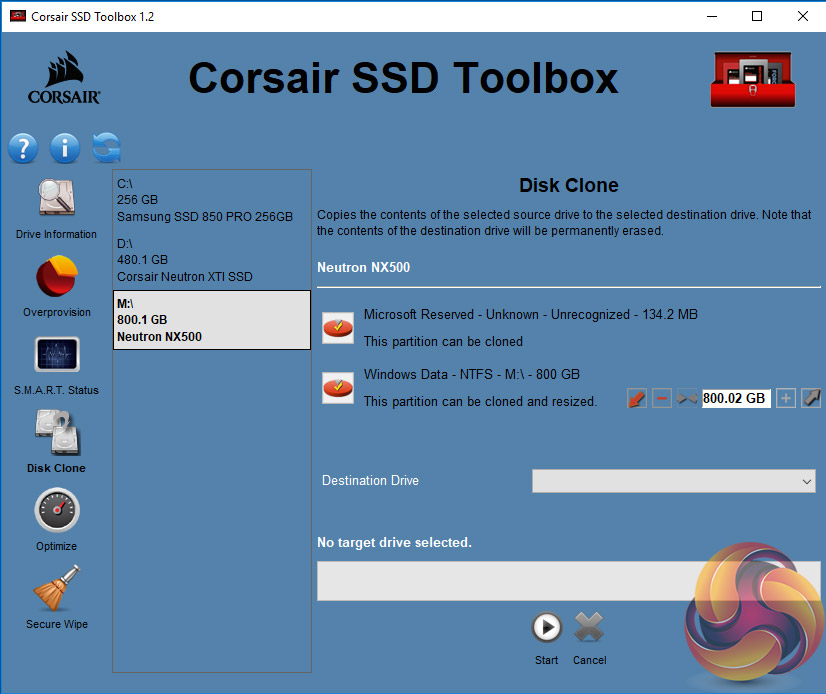
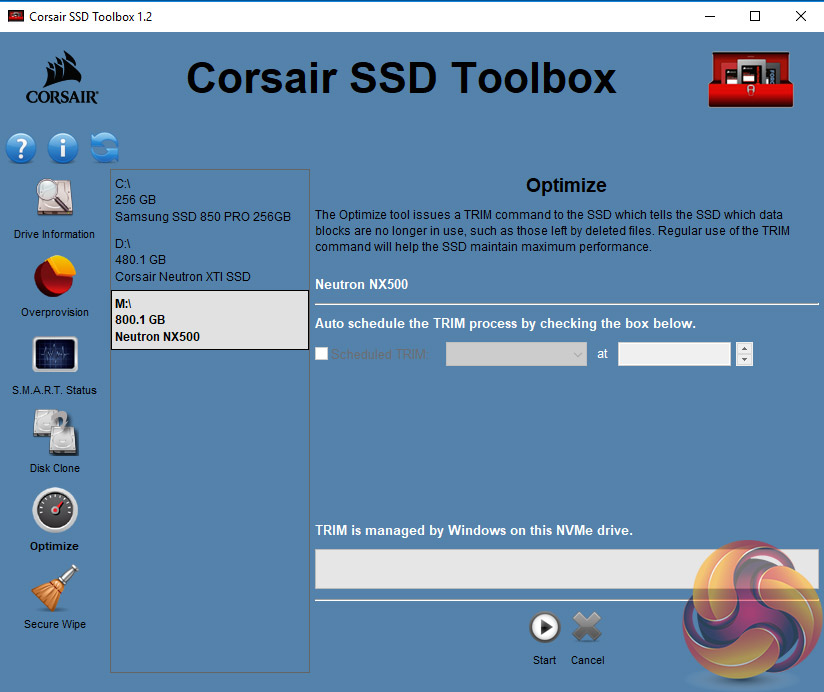
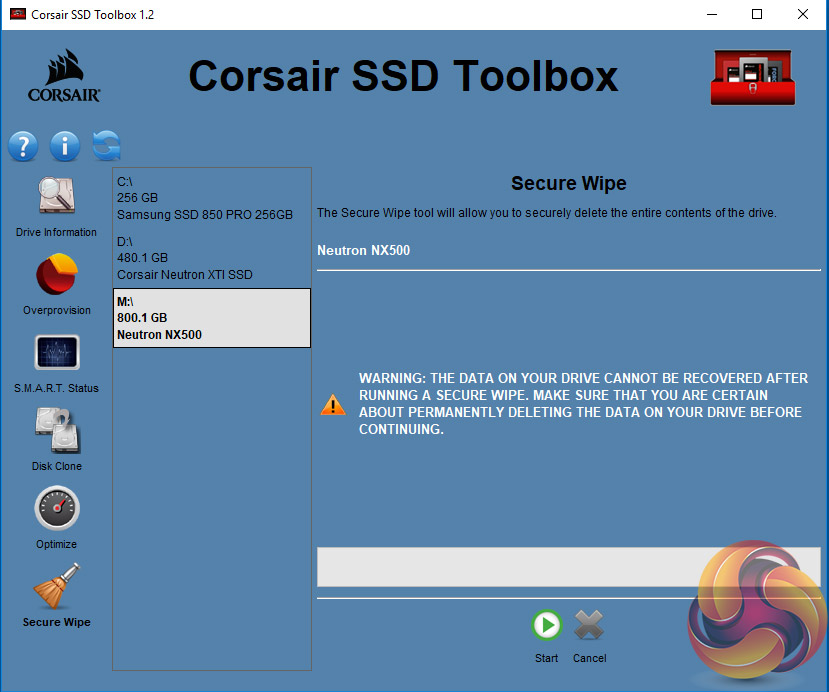
Corsair's SSD management software is called SSD Toolbox. It displays drive and S.M.A.R.T information as well as enabling firmware updates, secure wipe and manually adjusting the drive's over-provisioning and TRIM operations. There is also a Disk Clone utility to copy the contents of one drive to another.
For testing, the drives are all wiped and reset to factory settings by HDDerase V4. We try to use free or easily available programs and some real world testing so you can compare our findings against your own system.
This is a good way to measure potential upgrade benefits.
Main system:
Intel Core i7-7700K with 16GB of DDR4-3200 RAM, Sapphire R9 390 Nitro and an Asus Prime Z270-A motherboard.
Other drives
Corsair Force MP500 480GB
Intel Optane Memory 32GB
Kingston HyperX Predator 480GB
OCZ RevoDrive 350 480GB
OCZ RevoDrive 3 x2 480GB
Plextor M8PeG 512GB
Plextor M6e Black Edition PCIe 256GB
PNY CS2030 240GB
Samsung SSD960 PRO 2TB
Samsung SSD960 EVO 1TB
Samsung SSD950 PRO 256GB
Samsung SM951 256GB
Samsung XP941 512GB
Toshiba OCZ RD400 512GB
Western Digital Black PCIe 512GB
Software:
Atto Disk Benchmark.
CrystalMark 3.0.3.
AS SSD.
IOMeter
All our results were achieved by running each test five times with every configuration this ensures that any glitches are removed from the results. Trim is confirmed as running by typing fsutil behavior query disabledeletenotify into the command line. A response of disabledeletenotify =0 confirms TRIM is active.
Crystalmark is a useful benchmark to measure theoretical performance levels of hard drives and SSD’s. We are using V3.0.3.
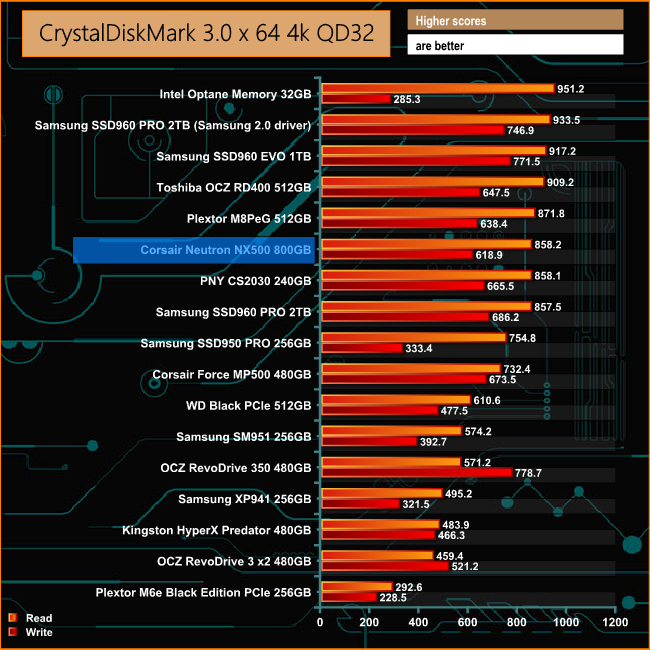
The NX500 has faster 4K read performance at a deep queue depth than Corsair's last drive – the M.2 format MP500. However, when it comes the drive's write performance, the MP500 is a little faster.
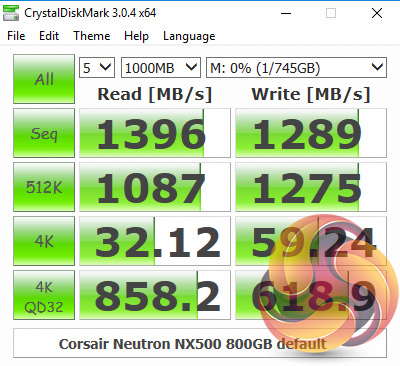
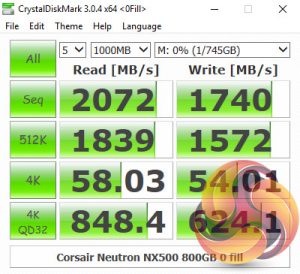
Looking at the two benchmark result screens, it seems that the Phison PS5007-E7 controller has a preference for compressible data in some of the tests although it doesn't seem to make so much difference when the drive is handling 4K data.
The ATTO Disk Benchmark performance measurement tool is compatible with Microsoft Windows. Measure your storage systems performance with various transfer sizes and test lengths for reads and writes. Several options are available to customize your performance measurement including queue depth, overlapped I/O and even a comparison mode with the option to run continuously.
Use ATTO Disk Benchmark to test any manufacturers RAID controllers, storage controllers, host adapters, hard drives and SSD drives and notice that ATTO products will consistently provide the highest level of performance to your storage.
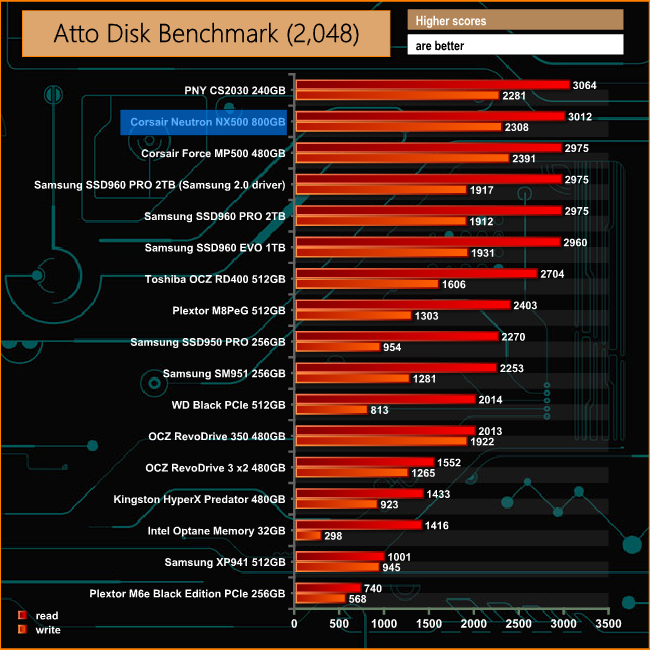
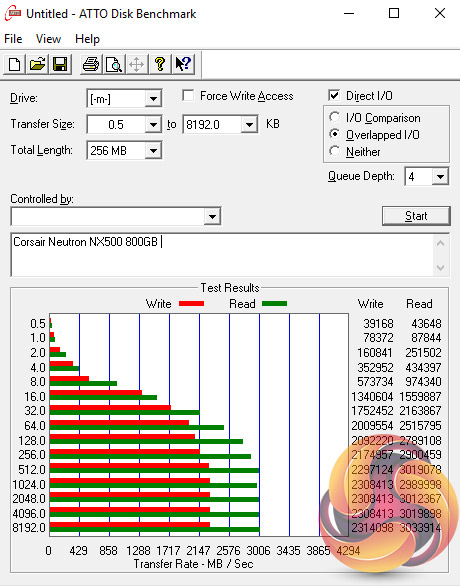
The official Sequential read/write figures for the 800GB NX500 are up to 3,000MB/s and 2,400MB/s respectively. Under the ATTO benchmark, the tested drive produced a read score of 3,012MB/s with writes coming in at 2,308MB/s. These numbers are well in the ballpark of the official figures.
AS SSD is a great free tool designed just for benching Solid State Drives. It performs an array of sequential read and write tests, as well as random read and write tests with sequential access times over a portion of the drive.
AS SSD includes a sub suite of benchmarks with various file pattern algorithms but this is difficult in trying to judge accurate performance figures.
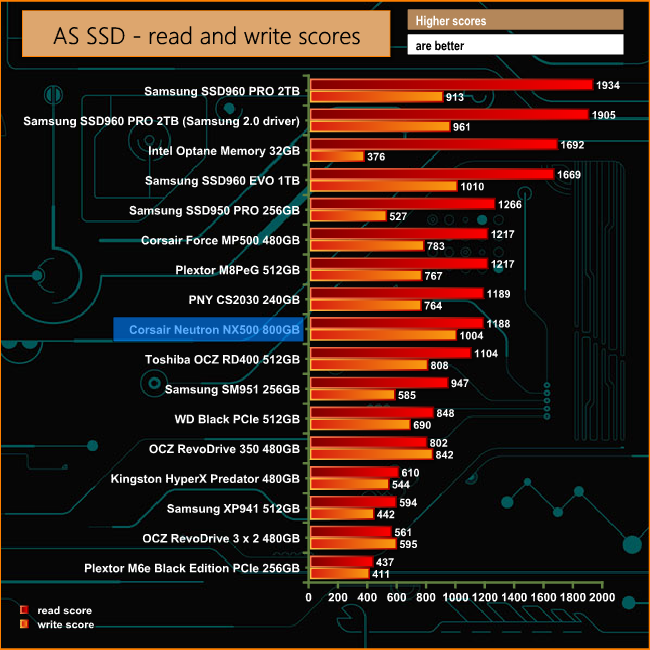
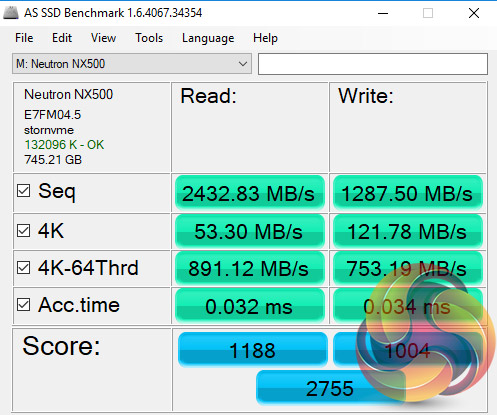
Under the AS SSD benchmark, the read score of the NX500 drops below that of the Corsair Force MP500 drive while the write score of the new drive is significantly improved compared to the previous drive.
IOMeter is another open source synthetic benchmarking tool which is able to simulate the various loads placed on hard drive and solid state drive technology.
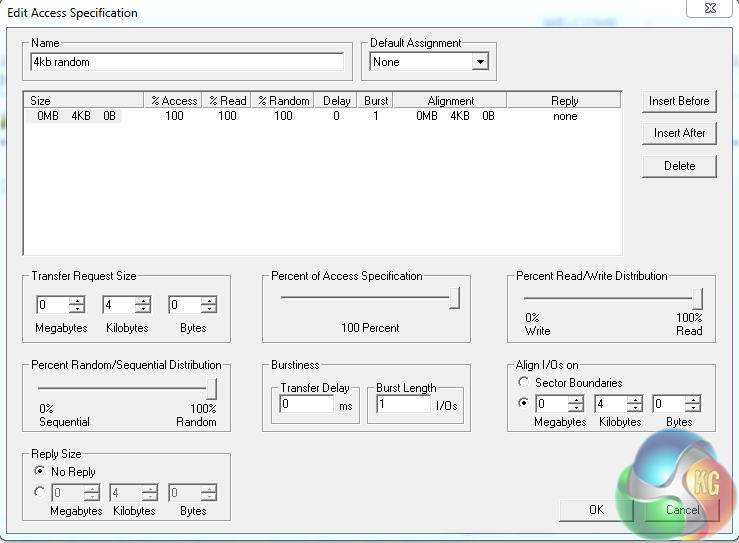
We test with both random read and write 4k tests, as shown above. There are many ways to measure the IOPS performance of a Solid State Drive, so our results will sometimes differ from manufacturer’s quoted ratings. We do test all drives in exactly the same way, so the results are directly comparable.
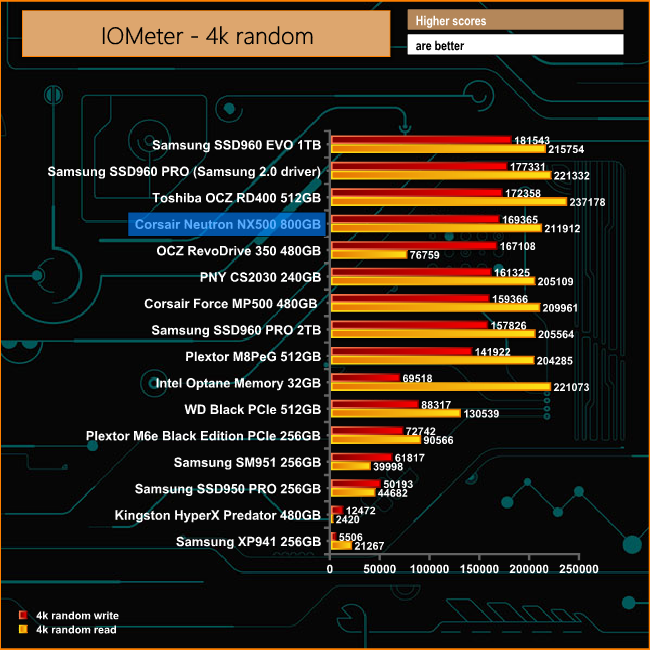
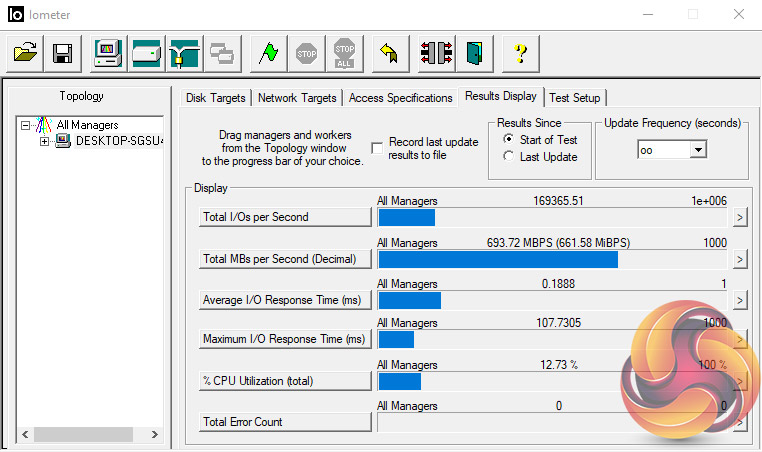
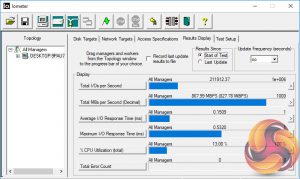
Random 4K read/write performance of the NX500 800GB drive is quoted as up to 300,000 IOPS and 270,000 IOPS, respectively. With our test setup of IOMeter, we couldn't match those official figures.
The tested drive produced 211,912 IOPS for reads and 169,365 IOPS for writes and while these didn't match the official numbers they are the fastest we have seen from a Corsair drive to date.
Futuremark’s PCMark 8 is a very good all round system benchmark but it’s Storage Consistency Test takes it to whole new level when testing SSD drives. It runs through four phases; Preconditioning, Degradation, Steady State, Recovery and finally Clean Up. During the Degradation, Steady State and Recovery phases it runs performance tests using the 10 software programs that form the backbone of PCMark 8; Adobe After Effects, Illustrator, InDesign, Photoshop Heavy and Photoshop Light, Microsoft Excel, PowerPoint, Word, Battlefield 3 and World of Warcraft. With some 18 phases of testing, this test can take many hours to run.
Preconditioning
The drive is written sequentially through up to the reported capacity with random data, write size of 256 × 512 = 131,072 bytes. This is done twice.
Degradation
Run writes of random size between 8 × 512 and 2048 × 512 bytes on random offsets for 10 minutes. It then runs a performance test. These two actions are then repeated 8 times and on each pass the duration of random writes is increased by 5 minutes.
Steady State
Run writes of random size between 8 × 512 and 2048 × 512 bytes on random offsets for final duration achieved in degradation phase. A performance test is then run. These actions are then re-run five times.
Recovery
The drive is idled for 5 minutes. Then a performance test is run. These actions are then repeated five times.
Clean Up
The drive is written through sequentially up to the reported capacity with zero data, write size of 256 × 512 = 131,072 bytes.
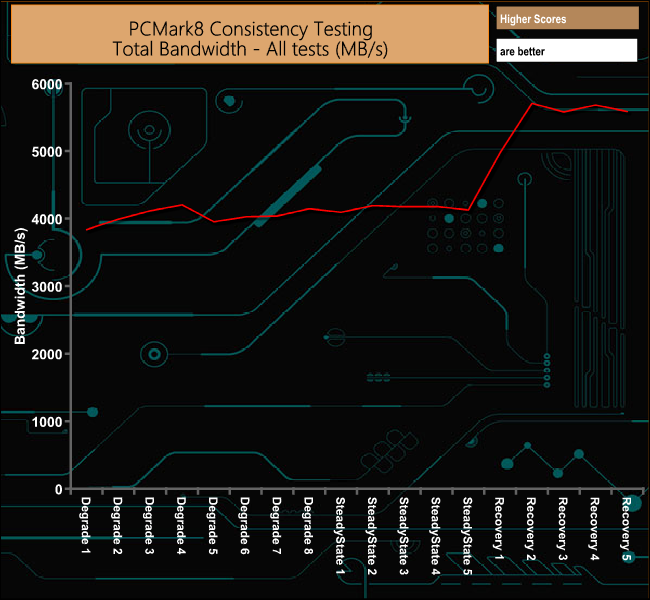
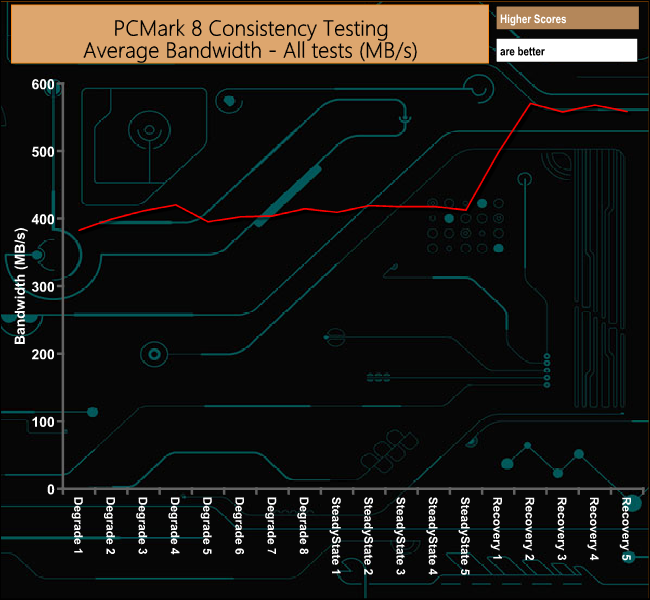
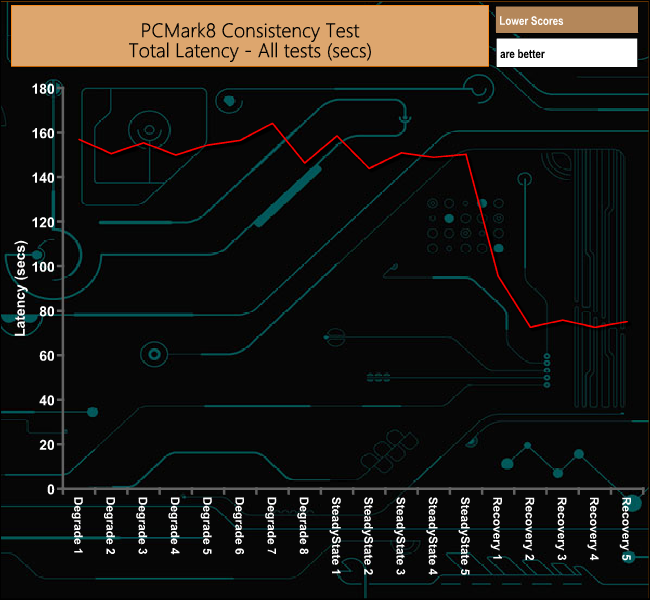
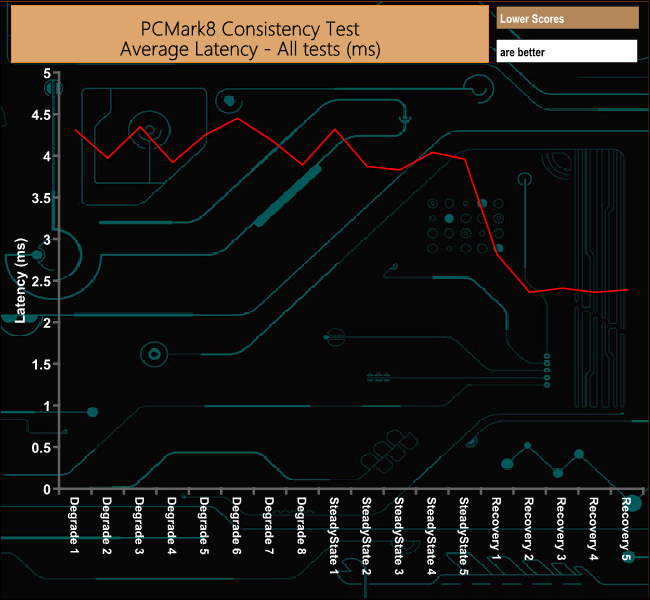
The NX500 dealt with the rigours of PCMark 8's Consistency test without too many problems and it certainly recovers very well from the ordeal, averaging 550.47MB/s during the recovery phase.
PCMark 8’s Consistency test provides a huge amount of performance data, so here we’ve looked a little closer at how the Neutron NX500 performs in each of the benchmarks test suites.
Adobe Creative Cloud
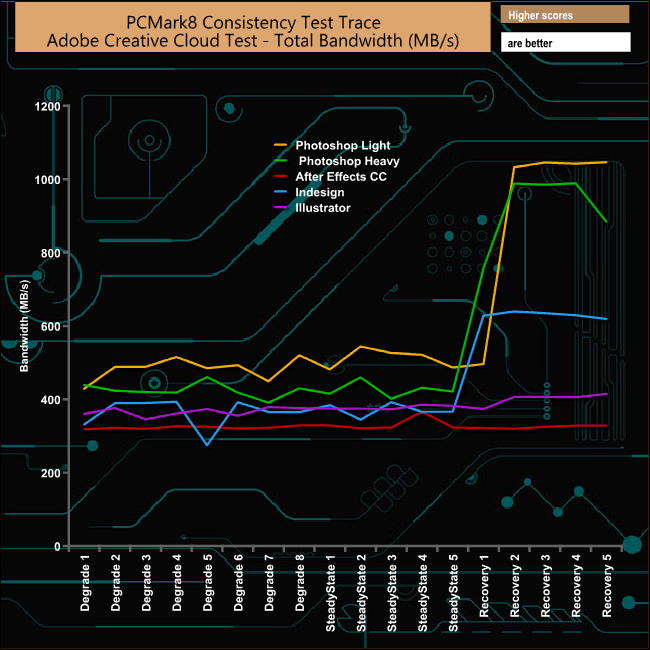
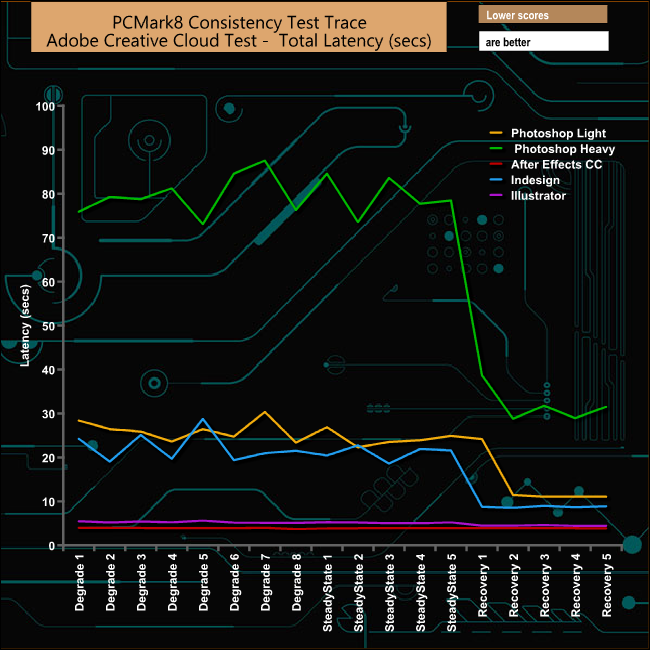
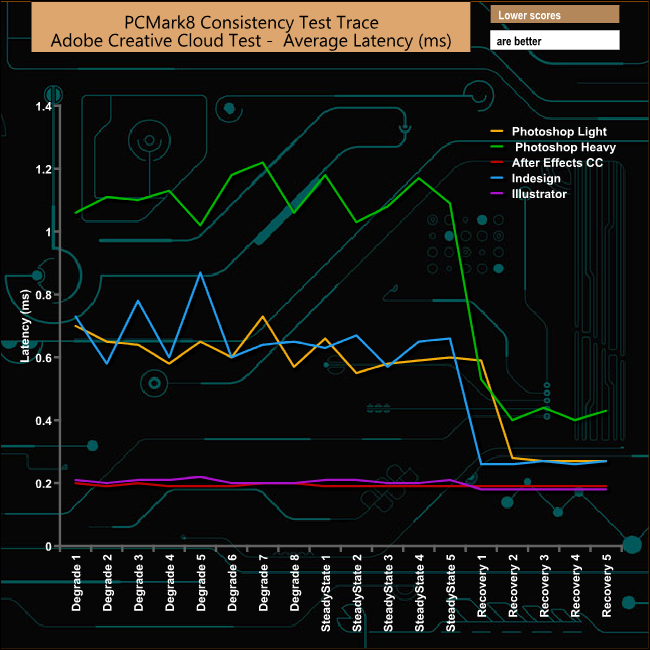
The two Adobe Photoshop traces, the Heavy one in particular, really push a drive under test conditions. Well, that is normally the case but neither of the tests seem to trouble the NX500 very much. Also, under both of these tests the drive recovered very well.
Microsoft Office
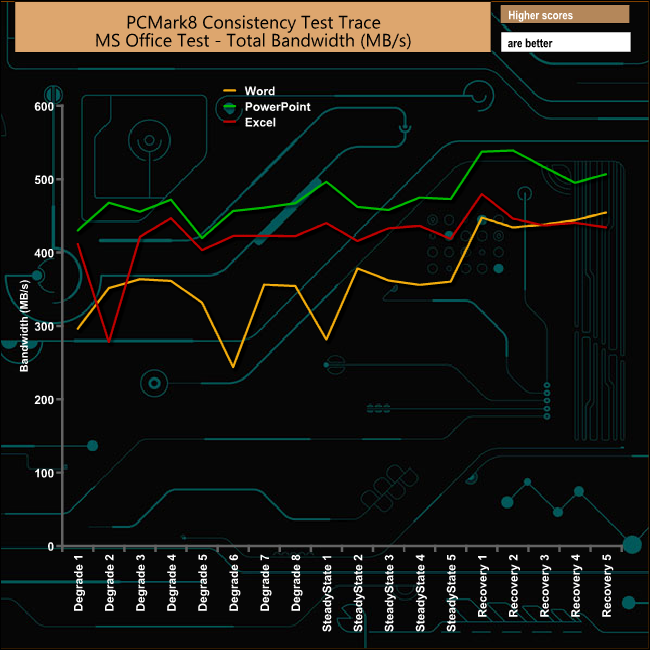
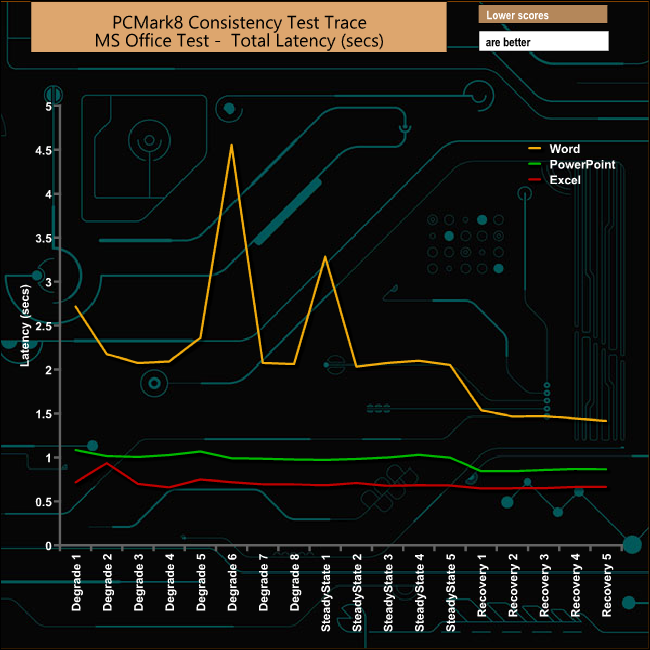
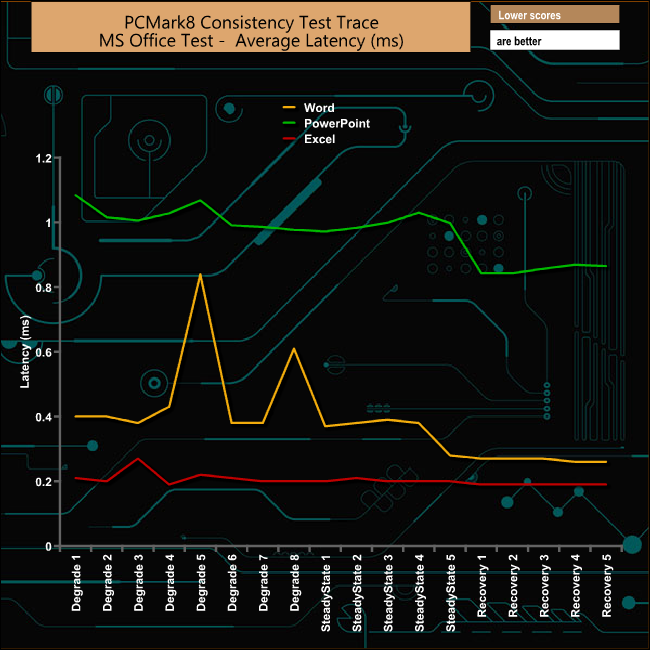
The NX500 displayed a couple of distinct drops in performance during the Microsoft Word test run, once in one of the Degragation phases and again in the first Steady State phase. However, the drive recovers from both and goes on through the Recovery process at an average of 443.75MB/s.
Casual Gaming
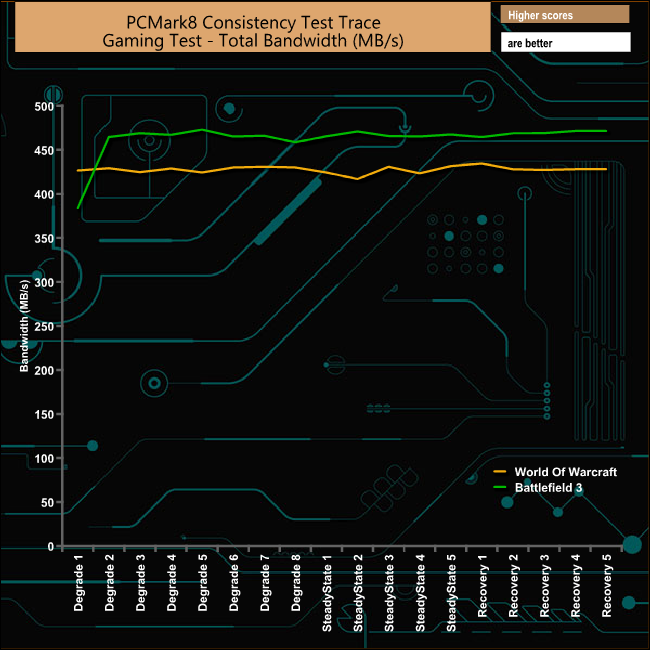
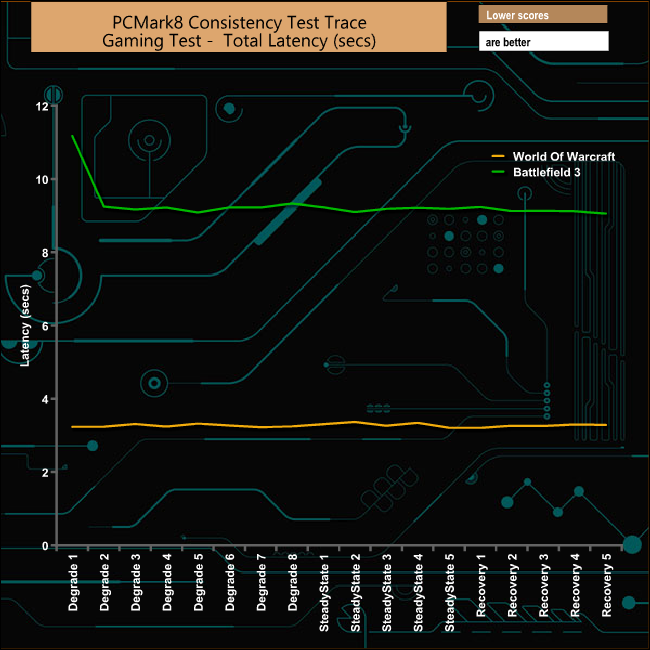
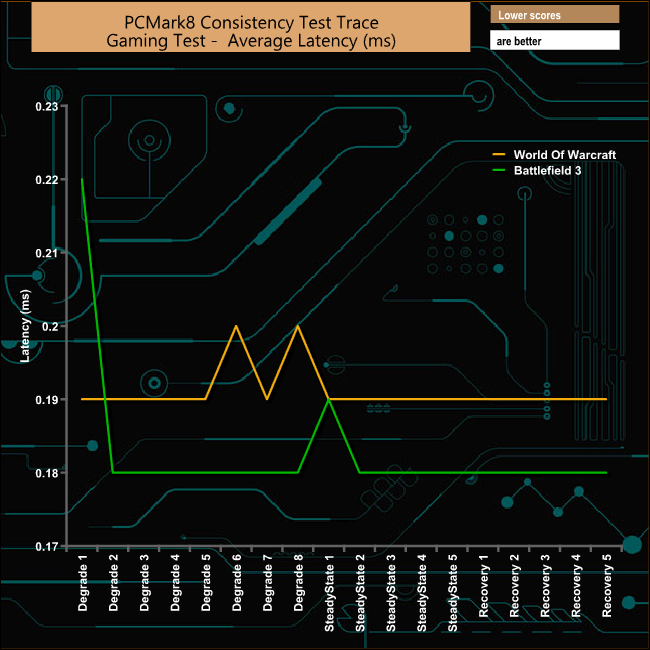
The two gaming test suites proved no problem to the Neutron NX500. The drive averaged 427.63MB/s across the World Of Warcraft run and 462.67MB/s for the Battlefield 3 test.
Just like the Consistency test, PCMark 8’s standard Storage test also saves a large amount of performance data. The default test runs through the test suite of 10 applications three times. Here we show the total bandwidth performance for each of the individual test suites for the third and final benchmark run.
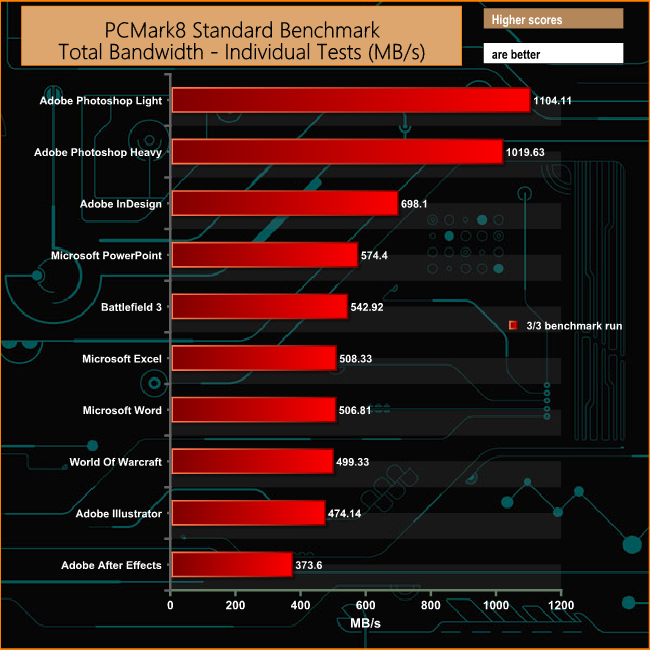
The NX500 shows solid performance throughout the third and final pass of the benchmark suite for the standard PCMark8 Storage test. Particularly impressive is the way it deals with the heavy demands of both Adobe Photoshop tests.
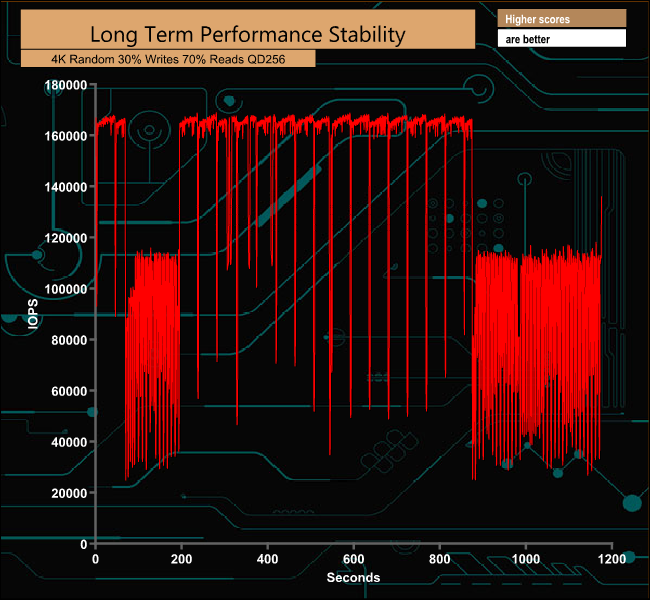
For the long term performance stability test, we set the drive up to run a 20-minute 4K random test with a 30% write, 70% read split, at a Queue Depth of 256 over the entire disk. The 800GB Neutron NX500 averaged 136,002 IOPS for the test with a performance stability of 81% which is very good.
To test real life performance of a drive we use a mix of folder/file types and by using the FastCopy utility (which gives a time as well as MB/s result) we record the performance of drive reading from & writing to a 256GB Samsung SSD850 PRO.
60GB Steam folder – 29,521 files.
50GB File folder – 28,523 files.
12GB Movie folder – 24 files (mix of Blu-ray and 4K files).
10GB Photo folder – 621 files (mix of .png, raw and .jpeg images).
10GB Audio folder – 1,483 files (mix of mp3 and .flac files).
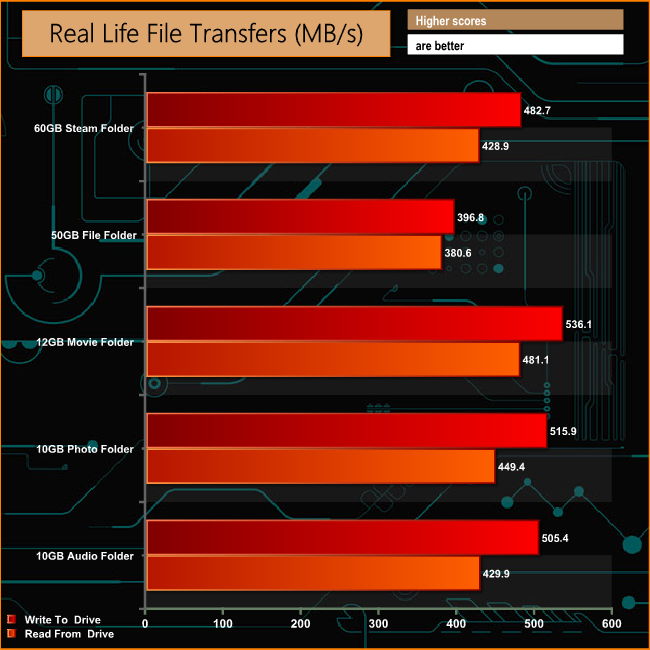
There's no doubting the performance of the Neutron NX500 when it comes to our real life file transfer tests. The drive sailed though the tests, posting some of the fastest transfer rates we have seen including those for the 50GB file folder and the 60GB Steam folder which are often stumbling blocks to drives. Not so with the NX500 – both folders just took a shade over two minutes to write to the drive and to be read back. All three media files were written to the drive at over 500MB/s.
A lot of thought has gone into Corsair's Neutron NX500 look and feel. Even something as seemingly mundane as the box it comes in has been designed in such a way as to make it stand out from the crowd on a shelf full of boxes. The drive itself looks the part with a well designed and finished heatsink covering the PCB. Thankfully, it's not all show as the drive produces some very good performance figures.
Corsair quote Sequential read/write figures for the 800GB drive of up to 3,000MB/s and 2,400MB/s respectively. Under the ATTO benchmark, the reviewed drive produced a read figure of 3,012MB/s with writes coming in at 2,308MB/s confirming the official figures. The official random 4K performance is stated as up to 300,000 IOPS and 270,000 IOPS for reads and writes respectively.
Using our test setup of IOMeter, we couldn't match the top official figures but the 211,912 IOPS for reads and 169,365 IOPS for writes we achieved are the fastest IOPS figures we have seen for a Corsair drive to date.
Synthetic benchmarks are fine, but what about real life? Well, with our real-life file transfer tests, the Neutron NX500 posted some of the fastest transfers we've seen to date. It took just over two minutes to write and read back both the 50GB file folder and the 60GB Steam folder. All three of our media folders (12GB Movie, 10GB Photo and 10GB audio) were each written to the drive in under 30 seconds; the Movie folder at 536MB/s, Photo folder at 515MB/s and 505MB/s for the Audio folder.
The 800GB version of the Corsair Neutron NX500 is priced at £795.99 (inc VAT).
Discuss on our Facebook page HERE.
Pros:
- Superb all-round performance.
- Endurance.
- 5-year warranty.
Cons:
- It's not cheap.
KitGuru says: Corsair are not the most prolific of drive manufacturers, but in the Neutron NX500 they certainly have a drive to make people sit up and notice.


I’d be more tempted to read this review if it wasn’t across 13 damn pages.
View all pages.
How does it compare to Samsung’s 960 pro in 512gb and 1tb ssds? I’m simply too lazy to look for old 960 reviews.
I would imagine that like you and myself, EVERYONE reading this review would like to know how it compares to the current champion, the Samsung 960 Pro, so I find it quite ridiculous that they wouldn’t include such a comparison.
You do know there is an option to view all pages on one page, right?!
I guess I’m not the only lazy one and I don’t write reviews. Or is this actually a “preview”? It’s getting harder and harder to tell the difference these days.