It's a sign of just how swiftly the NVMe SSD market is maturing that drive manufacturers are starting to turn their attention away from the mainstream/high-end market segments to battle it out at the other end of the market where the real money is made - the entry level/value market space. The latest company to join the fray is Kingston with its A1000, priced at £135. The A1000 is a single-sided M.2 2280 drive using a Gen 3.0 PCIe x2 interface with a three capacity line-up; 240GB, 480GB (the drive Kingston kindly supplied for review) and the flagship 960GB drive. At the heart of the A1000 is a Phison PS5008-E8 four channel controller which in turn looks after Toshiba 256Gb BiCS 3D TLC NAND flash memory. Kingston quotes a sequential read figure of up to 1,500MB/s across the range with writes quoted as up to 800MB/s for the 240GB drive, 900MB/s for the 480GB drive and up to 1,000MB/s for the 960GB drive. The 240GB and 480GB drives share the same 4K random read figure of up to 100,000 IOPS with the 960GB drive capable of delivering up to 120,000 IOPS. Random writes are quoted as up to 80,000 IOPS for the 240GB drive, up to 90,000 IOPS for the 480GB and 100,000 for the 960GB unit. TBW endurance figures for the range are; 150TB for the 240GB model, 300TB for the 480GB and 600TB for the 960GB drive. Kingston back the drives with a 5-year warranty. Physical Specifications: Usable Capacities: 480GB NAND Components: Toshiba 256GbBiCS 3D TLC NAND Controller: Phison PS5008-E8 Cache: Micron DDR3L Interface: PCIe x2 Gen 3.0 NVMe Form Factor: 2280 M.2 Dimensions: 22 x 80 x 3.5mm Drive Weight: 7g Firmware Version: E8FK11.G The A1000 comes in a protective blister pack with the drive sitting under a clear plastic shroud for extra protection. The only other things in the tray besides the drive are a tiny 'getting started' guide and an activation code for Acronis True Image HD which can be downloaded from Kingston's website. There's no mounting screw included, which will only be a problem if you lost the one(s) that should have been included with your motherboard. The 480GB A1000 is a single-sided M.2 2280 drive with a label covering all the components on the front side. The rear side is bare PCB. Removing the label (and voiding the warranty) reveals all the drive's components. There are four Toshiba 256Gb BiCS 3D TLC NAND packages (labelled as Kingston FB12808UCT1-32), the Phison PS5008-E8 four channel controller and a DDR3 cache IC. The PS5008-E is built on a 40nm process and is compatible with PCIe Rev 3.1 and NVMe 1.2. It supports MLC and TLC as well as 3D NAND. It also supports Phison's StrongECC, SmartECC and SmartFlush technologies as well as AES-256 and Pyrite data protection technologies. For testing, the drives are all wiped and reset to factory settings by HDDerase V4. We try to use free or easily available programs and some real world testing so you can compare our findings against your own system. This is a good way to measure potential upgrade benefits. We are in the process of updating our testing procedures for NVMe SSDs, adding new tests, refining others and using the latest versions of CrystalDiskMark, ATTO and AS SSD benchmarks. For a time we will show both old and new screenshots of these benchmarks as we transition from the older tests to the newer ones. We will try and re-test as many of the previously reviewed NVMe drives as we can so as to build up new versions of our comparative performance graphs. The test setups for the new tests are listed below. Each test is run five times. 128KB Sequential Read / Write. Transfer Request Size: 128KB Span: 8GB Thread(s): 1 Outstanding I/O: 1-32 Test Run: 20 minutes per test 4K Sustained Random Read / Write. Transfer Request Size: 4KB Span: 80GB Thread(s): 4 Outstanding I/O: 1-32 Test Run: 20 minutes per test 4K Random 70/30 mix Read/Write. Transfer Request Size: 4KB Span: 80GB Reads: 70% Writes: 30% Thread(s): 4 Outstanding I/O: 2 – 32 Test Run: 20 minutes Main system: Intel Core i7-7700K with 16GB of DDR4-3200 RAM, Sapphire R9 390 Nitro and an Asus Prime Z270-A motherboard. Other drives Corsair Force MP500 480GB Corsair Neutron NX500 800GB Intel Optane Memory 32GB Intel SSD760p 512GB Kingston HyperX Predator 480GB Kingston KC1000 960GB OCZ RevoDrive 350 480GB OCZ RevoDrive 3 x2 480GB Patriot Hellfire 240GB Plextor M9Pe(Y) 512GB Plextor M8PeG 512GB Plextor M6e Black Edition PCIe 256GB PNY CS2030 240GB Samsung SSD960 PRO 2TB Samsung SSD960 EVO 1TB Samsung SSD950 PRO 256GB Samsung SM951 256GB Samsung XP941 512GB Toshiba OCZ RD400 512GB Western Digital Black PCIe 512GB Software: Atto Disk Benchmark. CrystalMark 3.0.3. AS SSD. IOMeter. Futuremark PC Mark 8 All our results are achieved by running each test five times with every configuration to ensure that any anomalies are removed from the results. TRIM is confirmed as running by typing 'fsutil behavior query disabledeletenotify' into the command line. A response of 'disabledeletenotify =0' confirms TRIM is active. CrystalDiskMark is a useful benchmark to measure theoretical performance levels of hard drives and SSDs. We are using V3.0.3. but will be switching to V6.0 shortly so we have added the two CrystalDiskMark 6 result screenshots. Kingston's A1000 480GB drive isn't quite as fast as the last entry-level NVMe drive we looked at, Intel's SSD 760p, but it is still a relatively quick drive considering its price. The Phison PS5008-E8 controller seems to have a preference for compressible data when it comes to read performance, something which is demonstrated by the slightly different tests run by the older V3.0.3 compared to CrystalDiskMark V6.0. The ATTO Disk Benchmark performance measurement tool is compatible with Microsoft Windows. Measure your storage systems performance with various transfer sizes and test lengths for reads and writes. Several options are available to customize your performance measurement including queue depth, overlapped I/O and even a comparison mode with the option to run continuously. Use ATTO Disk Benchmark to test any manufacturers RAID controllers, storage controllers, host adapters, hard drives and SSD drives and notice that ATTO products will consistently provide the highest level of performance to your storage. Once again we are upgrading which ATTO version we are using for NVMe drives so have included the result screenshot from the new version as well. The official sequential read/write figures for the 480GB A1000 are up to 1,500MB/s and 900MB/s, numbers we could confirm and indeed even better with the ATTO benchmark. Our review drive produced a read performance of 1,767MB/s with writes coming in at 1,010MB/s. AS SSD is a great free tool designed just for benching solid state drives. It performs an array of sequential read and write tests, as well as random read and write tests with sequential access times over a portion of the drive. AS SSD includes a sub suite of benchmarks with various file pattern algorithms but this is difficult in trying to judge accurate performance figures. For an entry level NVMe drive, the Kingston A1000 performs reasonably well in the more stringent AS-SSD test. IOMeter is another open source synthetic benchmarking tool which is able to simulate the various loads placed on hard drive and solid state drive technology. We test with both random read and write 4K tests. There are many ways to measure the IOPS performance of a SSD, so our results will sometimes differ from manufacturers' quoted ratings. We do test all drives in exactly the same way, however, so the results are directly comparable. Going by our 4K Random read/write tests, the official 4K figures for the 480GB A1000 seem a little on the conservative side. Reads are officially quoted as up to 100,000 IOPS, yet our review drive easily topped that mark at 162,356 IOPS. Write performance was also faster than the official figure of up to 90,000 IOPS at 98,420 IOPS. Stressing out the drive across queue depths between 1 and 32 saw the A1000 stumble in the read test at the QD2 mark, dropping to 1,095.77MB/s, but it soon picked up again to peak at 1,598.43MB/s at a QD of 8. After QD1, the write performance was more stable, peaking at 1,130.51MB/s at the QD32 mark. In our sustained 4K read test, the drive's performance climbed steadily as the queue depth deepened, reaching 176,458 IOPS at a QD of 32. In the sustained 4K write test the drive peaked first at the QD4 mark at 119,115 IOPS before dropping back to peak again at a QD of 32 with 121,413 IOPS. 
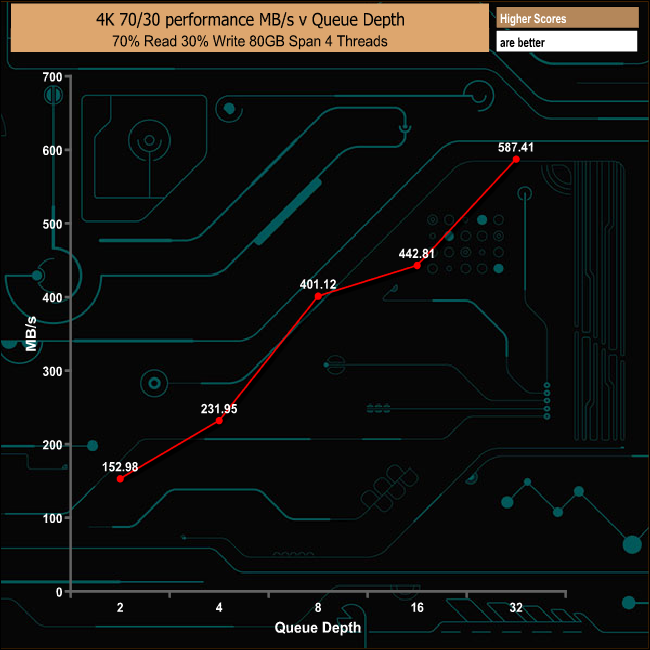
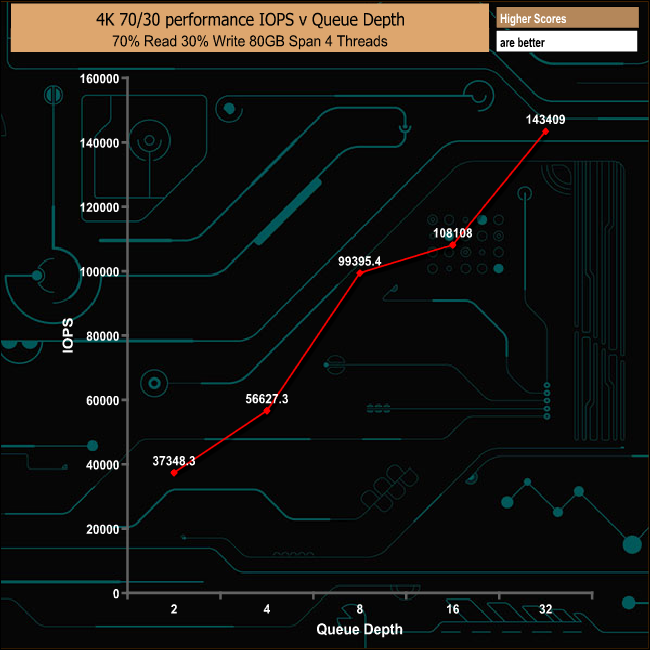
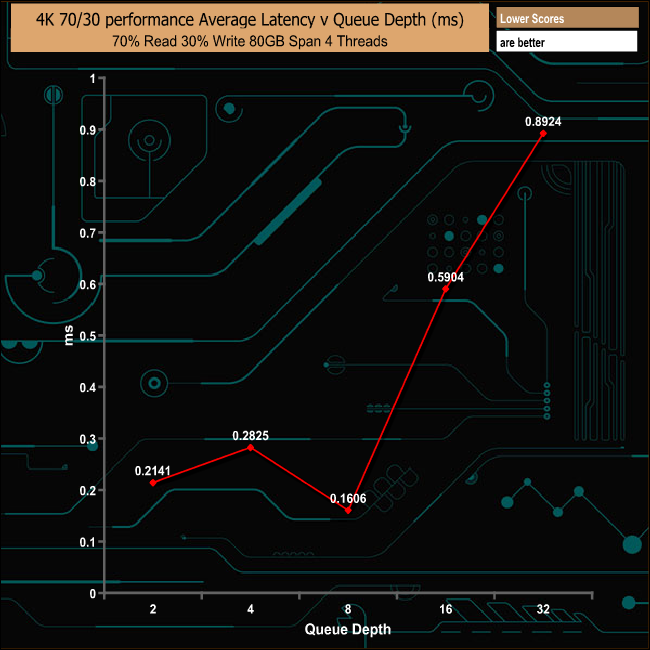
For a drive designed for the entry level market, the A1000 again performed very well in our 70/30 mixed read/write test. In our throughput tests the A1000 produced some pretty erratic results for both reads and writes. During the read test, the drive faltered at the 64KB block size, dropping to 239.67MB/s but recovered well only to stumble again at the 1MB block size, before finally recovering to finish the test at 1,442.77MB/s. There was also a couple of significant drops in the write performance, one at the 128KB block size and again at the 512KB block where the performance fell from the 1,088.63MB/s at the 256KB block to 793.79MB/s. The drive didn't recover that well from this last drop, either, finishing the test run at 987.52MB/s. Futuremark’s PCMark 8 is a very good all round system benchmark but it’s Storage Consistency Test takes it to whole new level when testing SSD drives. It runs through four phases; Preconditioning, Degradation, Steady State, Recovery and finally Clean Up. During the Degradation, Steady State and Recovery phases it runs performance tests using the 10 software programs that form the backbone of PCMark 8; Adobe After Effects, Illustrator, InDesign, Photoshop Heavy and Photoshop Light, Microsoft Excel, PowerPoint, Word, Battlefield 3 and World of Warcraft. With some 18 phases of testing, this test can take many hours to run. Preconditioning The drive is written sequentially through up to the reported capacity with random data, write size of 256 × 512 = 131,072 bytes. This is done twice. Degradation Run writes of random size between 8 × 512 and 2048 × 512 bytes on random offsets for 10 minutes. It then runs a performance test. These two actions are then repeated 8 times and on each pass the duration of random writes is increased by 5 minutes. Steady State Run writes of random size between 8 × 512 and 2048 × 512 bytes on random offsets for final duration achieved in degradation phase. A performance test is then run. These actions are then re-run five times. Recovery The drive is idled for 5 minutes. Then a performance test is run. These actions are then repeated five times. Clean Up The drive is written through sequentially up to the reported capacity with zero data, write size of 256 × 512 = 131,072 bytes. The Kingston A1000 isn't going to break any bandwidth records in PCMark 8's Consistency test, but it performed pretty consistently and it also recovered from the ordeal very well indeed. PCMark 8’s Consistency test provides a huge amount of performance data, so here we’ve looked a little closer at how the 480GB Kingston A1000 performs in each of the benchmark's test suites. Adobe Creative Cloud The drive handled the tough Adobe CC Photoshop tests well enough but the performance through the Recovery phases is particularly impressive - with the Photoshop Heavy test being the only exception. Microsoft Office The Microsoft Office test traces caused the drive more stress than the Adobe CC benchmark across the Degradation and Steady State phases, although once again the Recovery segment for all tests was very good. Casual Gaming During the casual gaming test runs, the drive had real problems with the World Of Warcraft trace during the early stages of the Degradation phase, but it did recover well during the final Degradation stages and also managed the Steady State phases pretty well. As with the previous two tests, the recovery was very good. Just like the Consistency test, PCMark 8’s standard Storage test also saves a large amount of performance data. The default test runs through the test suite of 10 applications three times. Here we show the total bandwidth performance for each of the individual test suites for the third and final benchmark run. The drive coped pretty well with the standard PCMark 8 Storage Test. Even the two demanding Adobe Photoshop tests produced pretty good bandwidth figures under testing. For the long term performance stability test, we set the drive to run a 20-minute 4K random test with a 30% write, 70% read split, at a Queue Depth of 256 over the entire disk. The 480GB Kingston A1000 averaged 61,923 IOPS for the test with a performance stability of 53%, which for an entry level drive is pretty good. To test real life performance of a drive we use a mix of folder/file types, and by using the FastCopy utility (which gives a time as well as MB/s result) we record the performance of drive reading from & writing to a 256GB Samsung SSD850 PRO. The files we include are as follows: 100GB data file. 60GB ISO image. 60GB Steam folder – 29,521 files. 50GB file folder – 28,523 files. 12GB movie folder – 24 files (mix of Blu-ray and 4K files). 10GB photo folder – 621 files (mix of .png, raw and .jpeg images). 10GB audio folder – 1,483 files (mix of mp3 and .flac files). 5GB (1.5bn pixel) photo. The only occasion where the drive struggled in our real life tests was when it was dealing with the small bity files contained in the 50GB file, 60GB Steam and 10GB audio folders. General performance other than that was impressive. Having previously reviewed the DCP1000, a monster of a drive aimed squarely at the enterprise market segment, it has been quite interesting to review the new A1000 as it is aimed at the entry/value part of the market. In terms of performance, Kingston quotes sequential read & write figures for the 480GB drive as up to 1,500MB/s and up to 900MB/s respectively. Under testing we found those figures to be a little on the conservative side as the review sample produced a read figure of 1,767MB/s and 1,010MB/s in the ATTO benchmark. It was a similar story with the random 4K performance. Officially the drive is rated fpr up to 100,000 IOPS reads and up to 90,000 IOPS for writes. Using our IOMeter 4K tests, however, we got a figure of 162,356 IOPS for reads and 98,420 IOPS for writes. At the time of writing this review the A1000 isn't supported by Kingston's SSD Manager software utility but the company informed us that an update to the software to bring A1000 support is on its way. The entry level NVMe drive market is a whole new ball game for drive manufacturers and in the next few months we are bound to see many more drives pitched at this segment launching. In the meantime, Kingston have laid down a very good marker in the 480GB A1000. As an entry level NVMe drive it has decent performance and comes with a very competitive price tag. We found the 480GB Kingston A1000 available on ebuyer.com for £134.99 (inc VAT) HERE. Pros Overall performance. 5-year warranty. Cons At the time of writing, there is no Kingston SSD Manager support for the drive . KitGuru says: Kingston's first foray into the entry level NVMe drive segment is a good one; the A1000 performs well and it comes with a five-year warranty.