
We initially looked at the ‘plain jane' Patriot Viper VPN100 a while back, now we have our hands on the ‘blinged' up version of the drive in the shape of the RGB-equipped Viper VPR100. Interestingly, Patriot says that with the RGB mode switched on, performance may ‘decrease up to 20-30%' so we put that to the test.
As with the Viper VPN100 model line-up, the VPR100 RGB range consists of four capacities, the entry 256GB model, 512GB, 1TB (the drive we are looking at here) and a flagship 2TB drive. Gone is the massive passive cooler that the VPN100 used, in its place is a lower profile (7mm compared to 10.5mm) but very slightly wider (25mm versus 22mm) RGB equipped passive heatsink.
Just like the VPN100, the VPR100 is built around a Phison PS5012-E12 controller and Toshiba 3D TLC NAND. The PS5012-E12 is Phison’s second-generation PCIe Gen3 x4 NVMe controller. The 8-channel controller is built on a TSMC 28nm process and has been designed to work with TLC and QLC NAND technologies with support for Phison’s SmartECC and the latest LDPC (Low-Density Parity Check) error correction as well as AES256, TCG OPAL and TCG Pyrite hardware encryption support. With 8 NAND channels and 32 NAND chip enable lines, the maximum amount of NAND the controller can support is 8TB.
Patriot quotes Sequential performance figures on the specification sheet for the 1TB drive as up to 3,900MB/s for reads and up to 2,900MB/s for writes using the CrystalDiskMark benchmark. Also quoted are Sequential performance figures using the ATTO benchmark with the same maximum 2,900MB/s write score but with a reduced read score of 3,300MB/s, and its these two ATTO figures that appear on the box that the drive comes in.
The quoted 4K random read/write figures for the 1TB are very impressive at up to 700,000 IOPS for both reads and up to 650,000 IOPS for writes. Looking at the specification sheet for the VPR100 you come across an interesting caveat to those figures, in that if the RGB mode is switched on, quote “RGB sync may decrease up to 20-30% Read/Write speed” unquote. But more on that later.
The 1TB VPN100’s endurance is rated at 1600TB TBW and Patriot backs the drive with a 5-year warranty.
Physical Specifications:
- Usable Capacities: 1TB.
- NAND Components: Toshiba 3D TLC.
- NAND Controller: Phison PS5012-E12.
- Cache: 1GB.
- Interface: PCIe Gen3 x4 NVMe 1.3.
- Form Factor: M.2 2280.
- Dimensions: 25 x 80 x 7mm.
- Drive Weight: 45g
Firmware Version: ECFM12.3
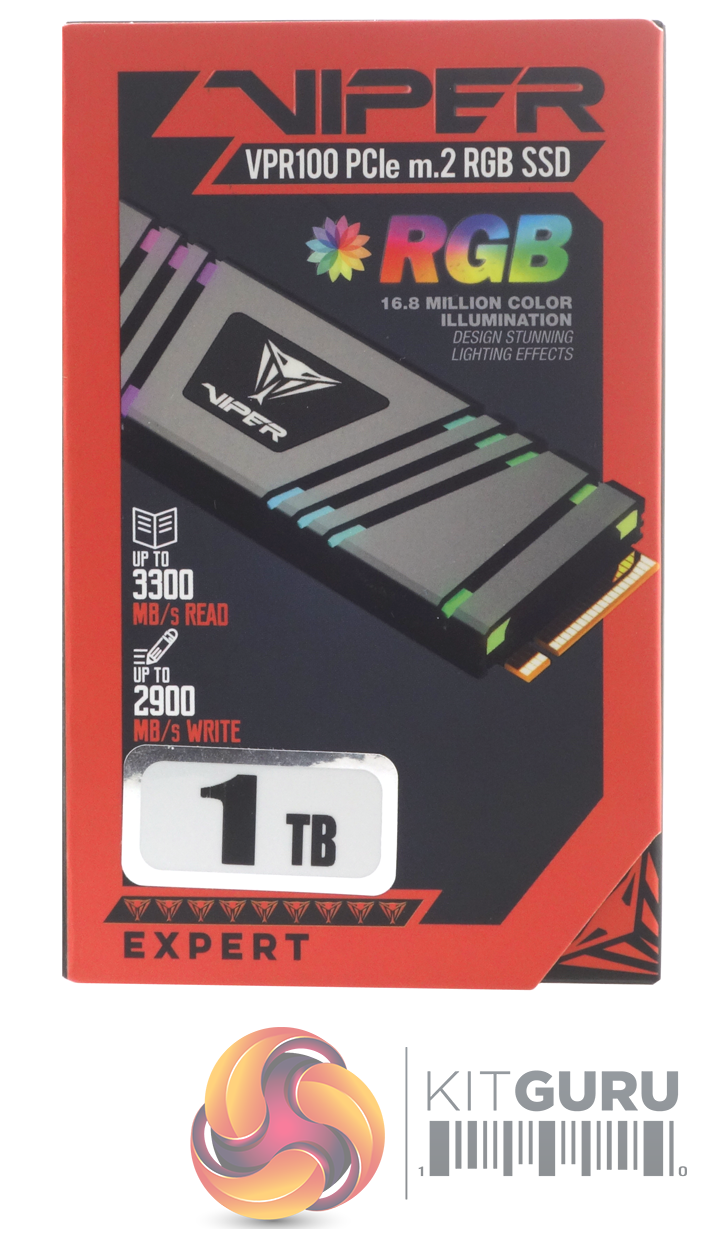

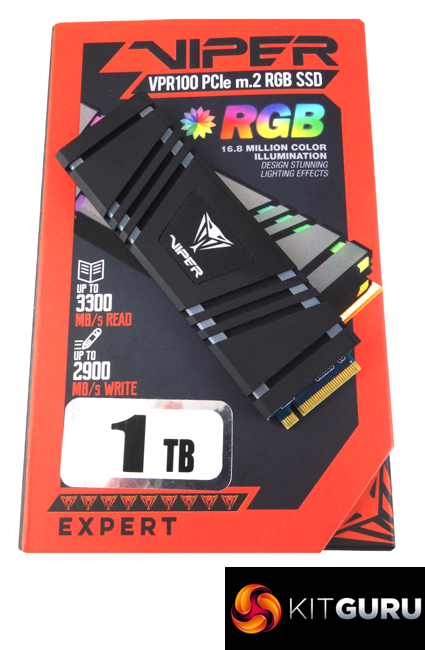
The VPR100 RGB comes in a compact, well-constructed box. On the front is an image of the drive along with Sequential read and write figures, as well as a sticker showing which capacity drive is in the box. Above the image is a brief description of the RGB technology supported by the VPR100.
The rear of the box is covered with multi-lingual points about the drive’s performance and available capacities.

The front of the box is, in fact, a lid which, when opened, allows the drive to be viewed behind a clear plastic window. The underside of the lid displays more information about the drive and its uses, along with another large image of the drive.
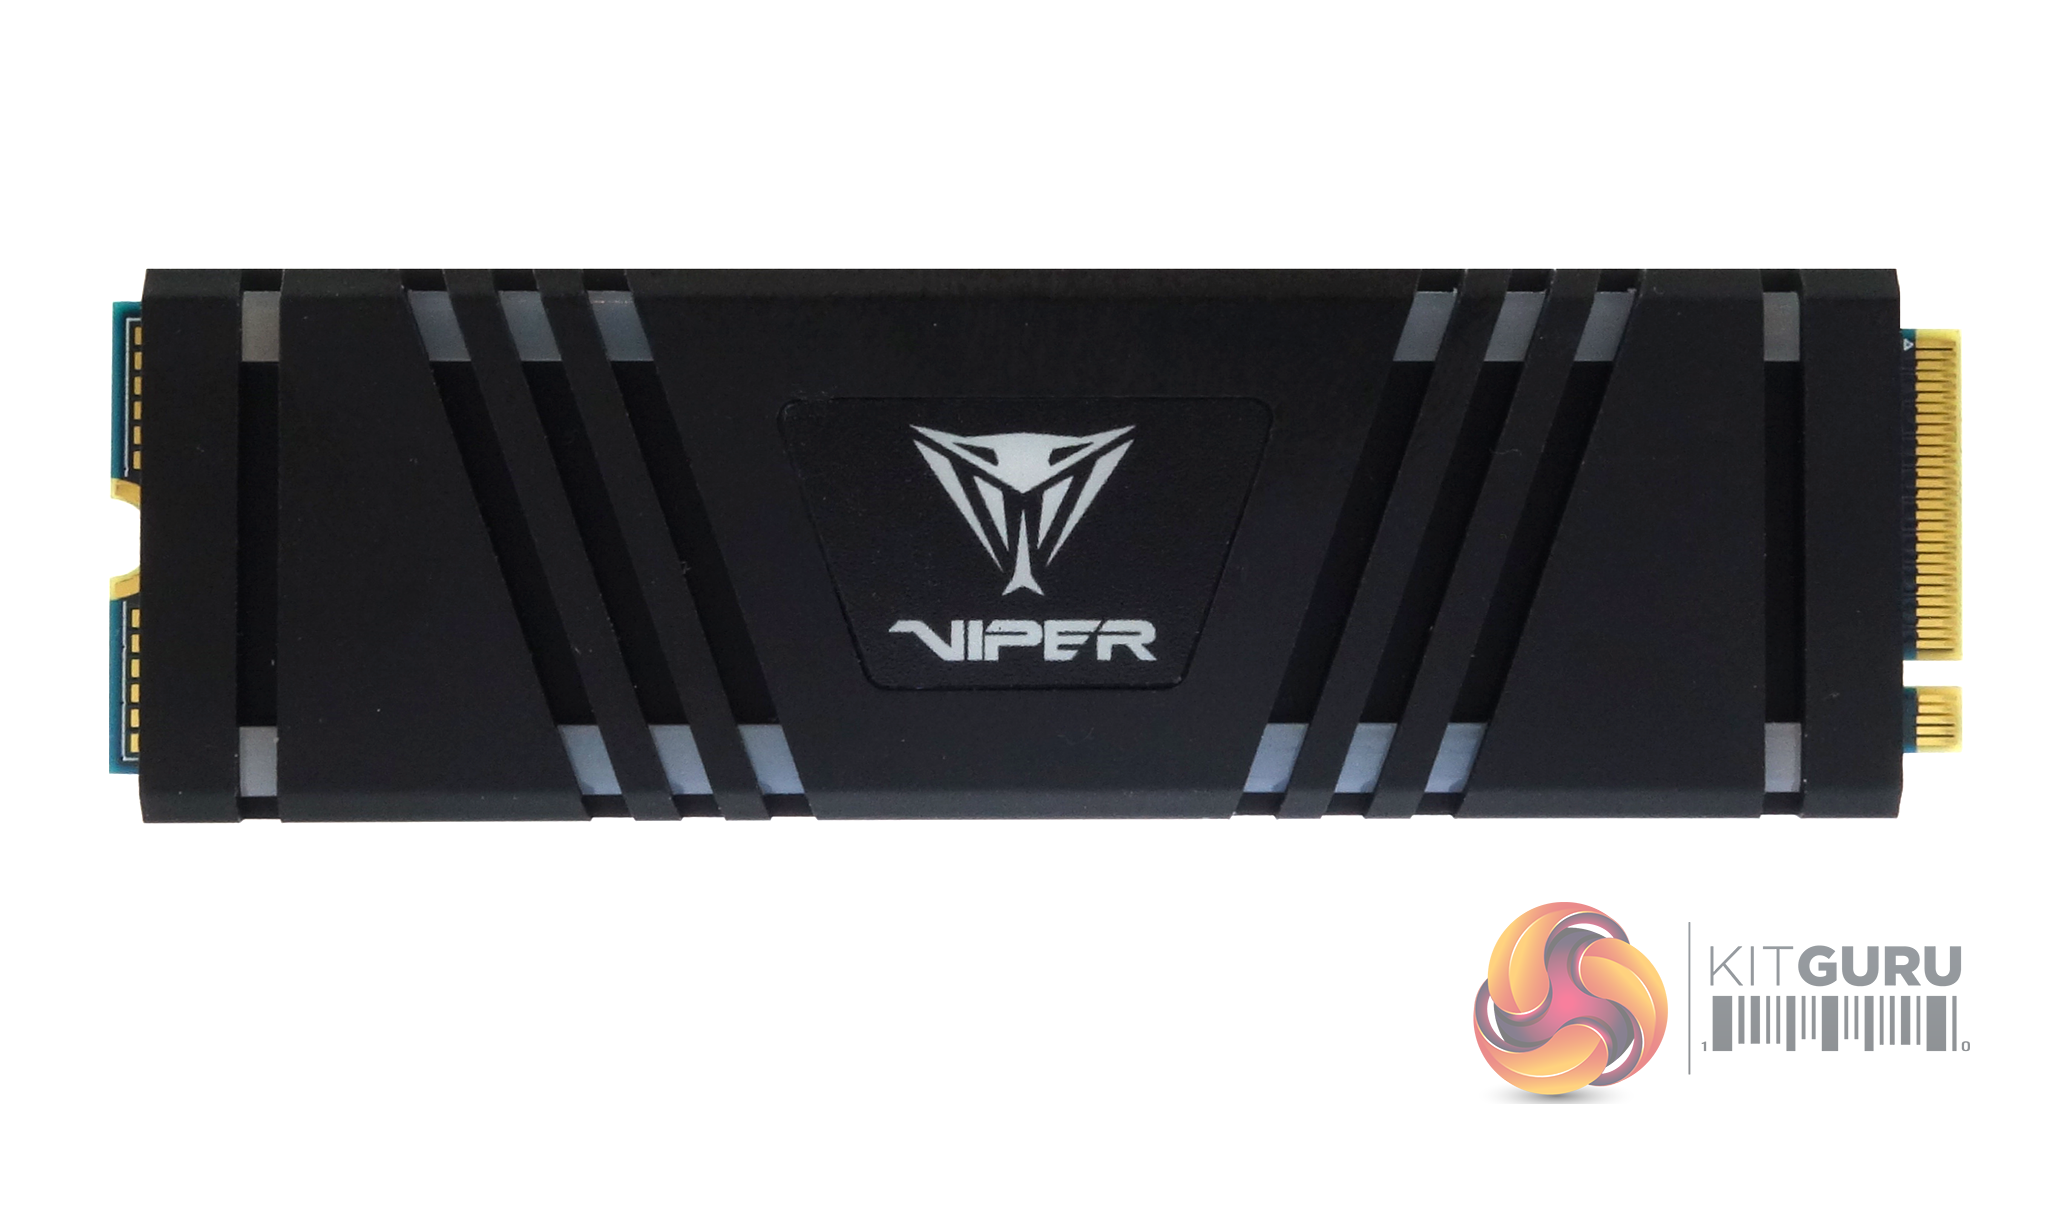
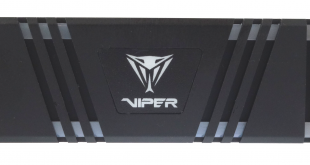
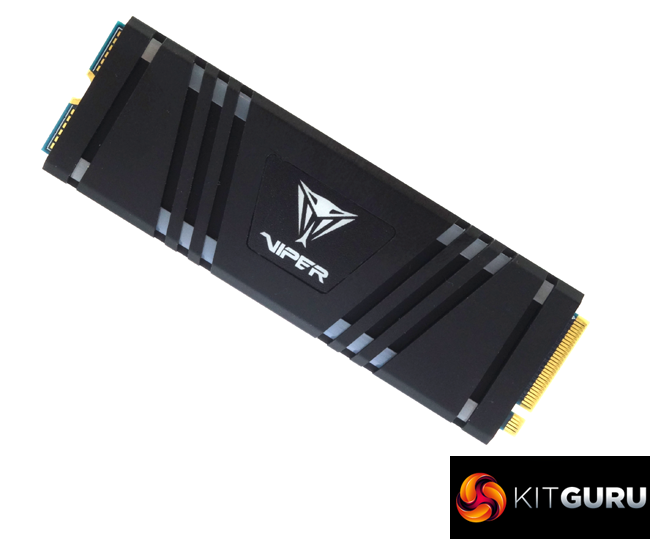
The VPR100 RGB 1TB drive is a dual-sided design. The front of the drive is covered by an impressive looking, large passive, RGB equipped heatsink. As well as the heatsink Patriot has fitted an external sensor as well, to allow the drive to perform at its best. Sitting under the heatsink is the Phison PS5012-E12 controller along with two 256GB packages of Toshiba 3D TLC NAND (labelled TABBG55AIV) and a 512GB SK hynix H5AN4G8NBJA DDR4 DRAM cache IC.
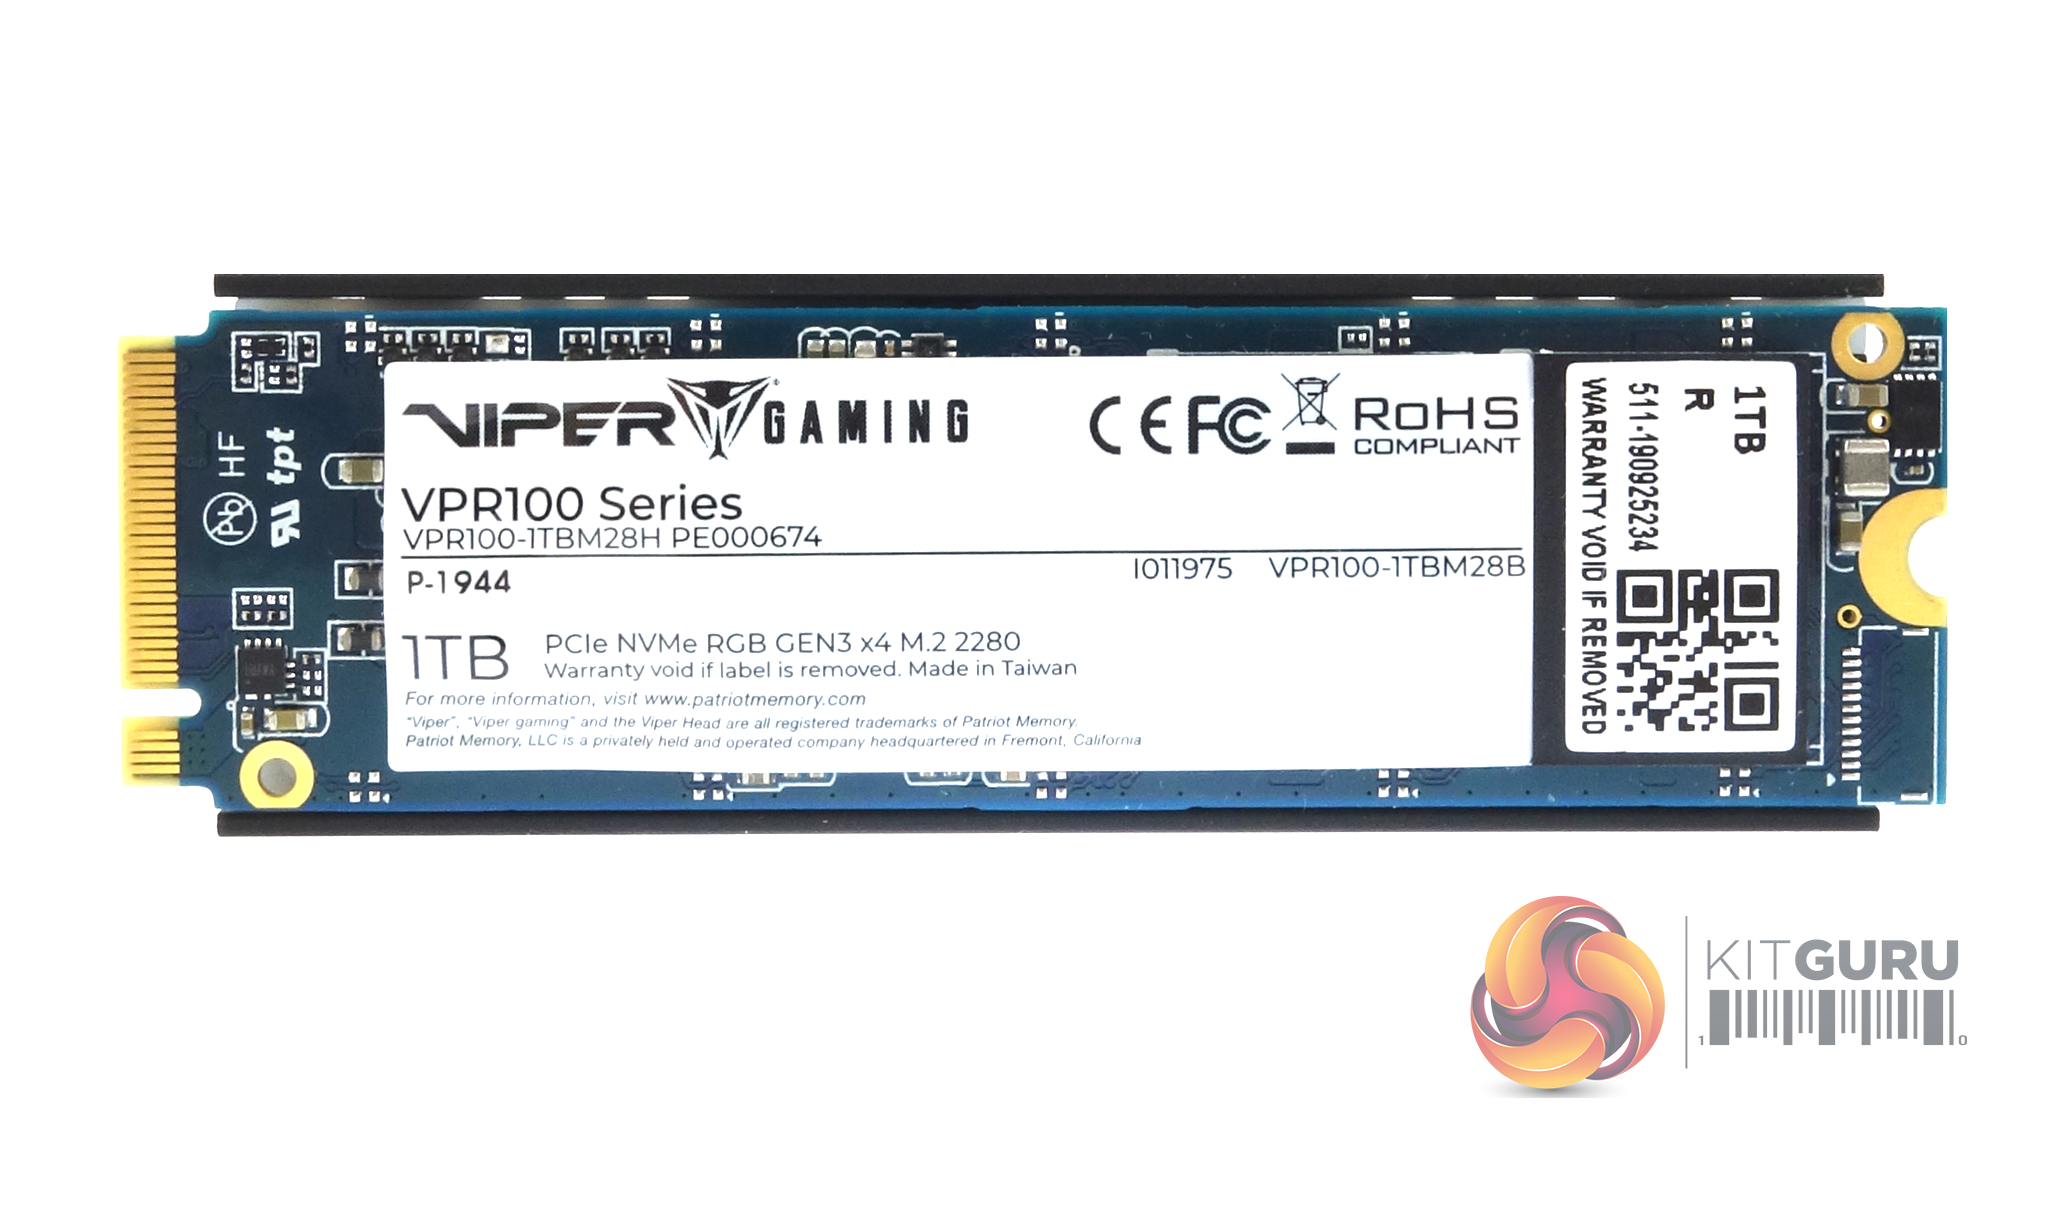
The rear of the PCB is pretty much covered by a white product sticker. Under the product label are two more 256GB NAND packages and another 512GB SK hynix H5AN4G8NBJA cache chip to give 1GB of total cache.


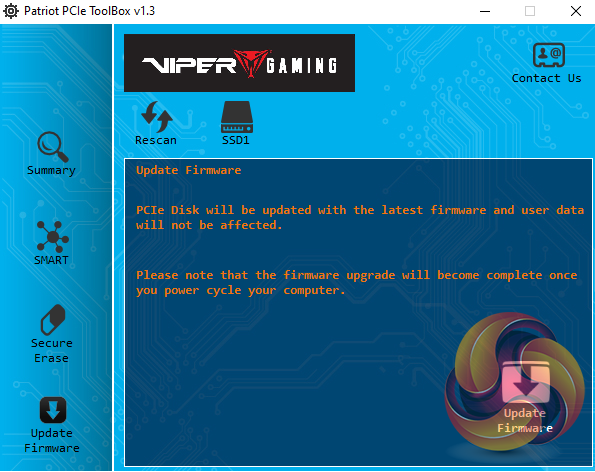
Patriot’s SSD management software, the Patriot PCIe Tool Box (v1.3) looks a pretty basic utility compared to some of its competitor's offerings but it really does offer all you really need to keep an eye on your drive. It shows information on the firmware version, serial number, total capacity, endurance, power-on time, if TRIM is enabled, and SMART data. It also allows the secure erase of the drive and the updating of the firmware.
For testing, the drives are all wiped and reset to factory settings by HDDerase V4. We try to use free or easily available programs and some real-world testing so you can compare our findings against your own system.
This is a good way to measure potential upgrade benefits.
Main system:
Intel Core i7-7700K with 16GB of DDR4-3200 RAM, Sapphire R9 390 Nitro and an Asus Prime Z270-A motherboard.
Other drives
Corsair Force MP600 1TB (PCIe Gen4)
Corsair Force MP510 960GB
Crucial P1 1TB
Kingston KC2000 1TB
Patriot Viper VPN4100 1TB (PCIe Gen4)
Patriot Viper VPN100 1TB
PNY CS3030 1TB
Seagate FireCuda 510 1TB
Samsung SSD970 PRO 1TB
Samsung SSD960 EVO 1TB
Samsung SSD960 EVO Plus 1TB
Teamgroup T-Force Cardea Zero Z440 1TB (PCIe Gen4)
Toshiba BG4 1TB
Toshiba XG6 1TB
Western Digital Black SN750 1TB
Western Digital Black SN750 1TB with Heatsink
Western Digital Blue SN550 1TB
Western Digital Black NVMe 1TB
Software:
Atto Disk Benchmark 4.00.
CrystalMark 6.0.0. / v7
AS SSD 2.0.
IOMeter.
Futuremark PC Mark 8
All our results were achieved by running each test five times with every configuration this ensures that any glitches are removed from the results. Trim is confirmed as running by typing fsutil behavior query disabledeletenotify into the command line. A response of disabledeletenotify =0 confirms TRIM is active.
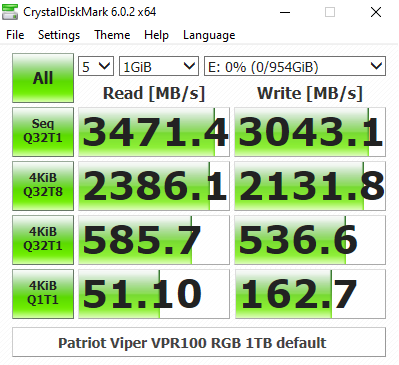
CrystalDiskMark is a useful benchmark to measure theoretical performance levels of hard drives and SSDs. We are using v6.0. and v7.0.

In the CrystalDiskMark 6 QD32 test, the Viper VPR100 shows an improvement in both read and write performance over the VPN100 drive. As the both drives use the same controller/NAND combination it's probably down to tweaks in the later version of the firmware that the VPR100 uses.


The differences between the VPR100 and VPN100 disappear when the drive is tested at a shallow QD of 1.
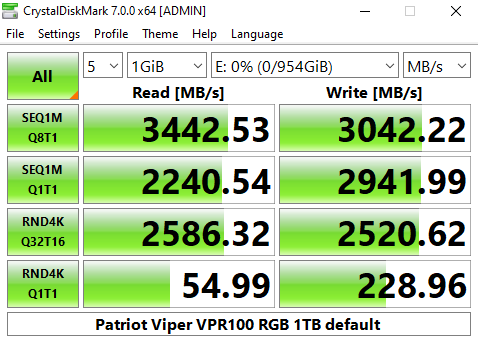
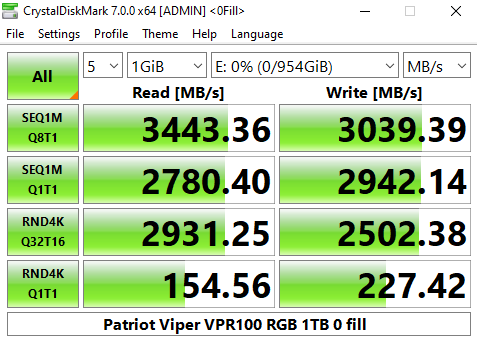
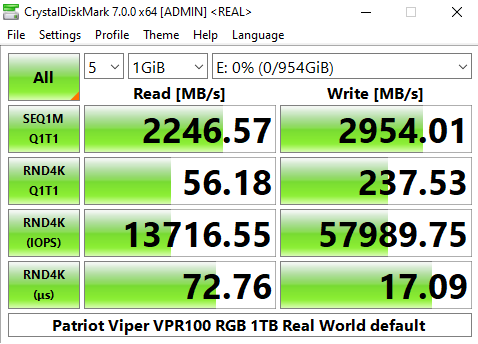
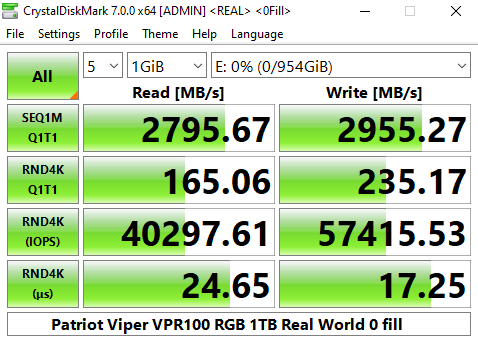
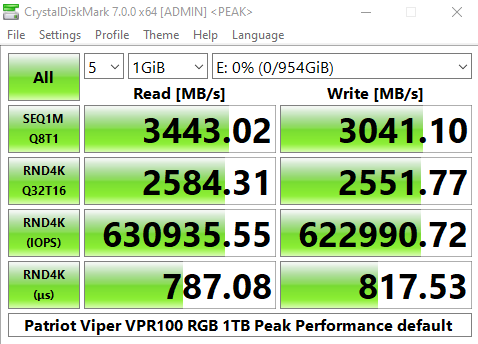
The latest version of CrystalDiskMark, version 7, includes a couple of profiles that can be used for testing – Peak Performance and Real World. The result screens for these two profiles not only display MB/s results but also IOPS and latency.
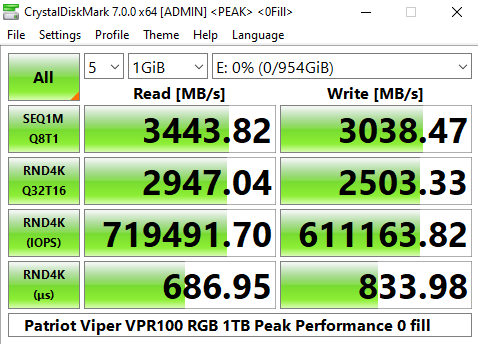
Looking at the Peak Performance results for Sequential read/write performance we see that the review drive couldn't get to the maximum official quoted CrystalDiskMark score of 3,900MB/s, with a read figure of 3,443MB/s. However, the write figure of 3,038MB/s was faster than the official 2,900MB/s.
When it came to 4K random read/write performance in the Peak Performance Profile, the drive confirmed the official 700,000 IOPS read figure with 719,491 IOPS but only when dealing with compressible data. Conversely, the faster write performance of 622,990 IOPS came when the drive was dealing with incompressible data, but impressive as that figure is, it's still short of the official maximum of 650,000 IOPS.
The ATTO Disk Benchmark performance measurement tool is compatible with Microsoft Windows. Measure your storage systems performance with various transfer sizes and test lengths for reads and writes. Several options are available to customize your performance measurement including queue depth, overlapped I/O and even a comparison mode with the option to run continuously.
Use ATTO Disk Benchmark to test any manufacturers RAID controllers, storage controllers, host adapters, hard drives and SSD drives and notice that ATTO products will consistently provide the highest level of performance to your storage.
We are using version 4.0 for our NVMe disk tests.
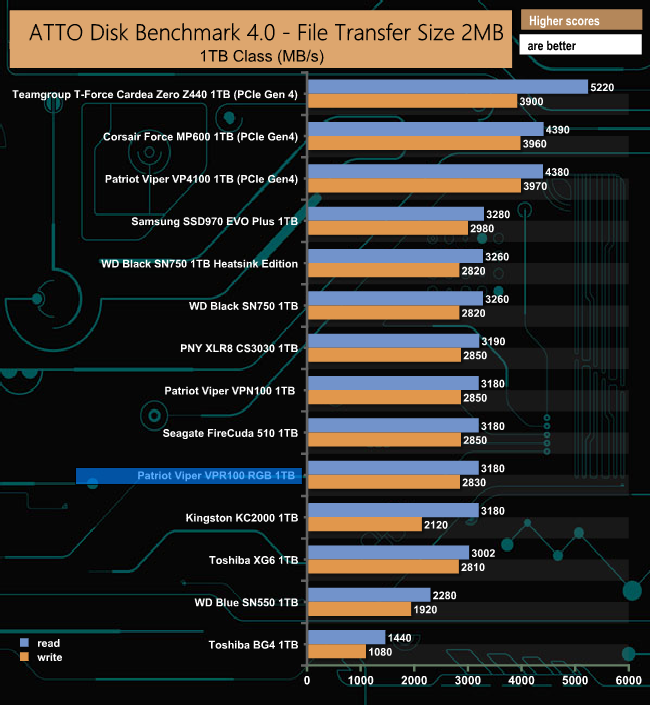
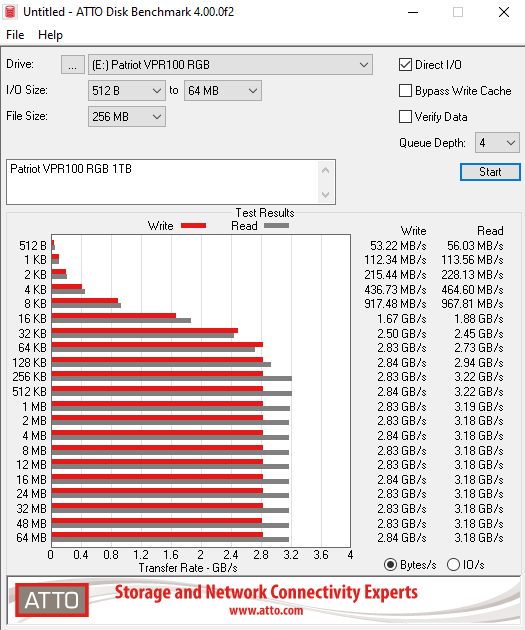
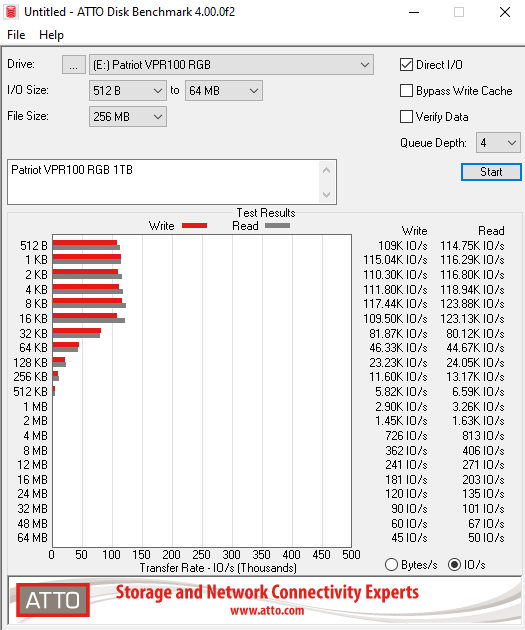
Patriot quotes official Sequential read/write figures for the drive (using the ATTO benchmark) as up to 3,300MB/s and 2,900MB/s respectively. Our review drive couldn't quite match either of those figures with reads of 3,180MB/s and writes at 2,830MB/s.
AS SSD is a great free tool designed just for benching Solid State Drives. It performs an array of sequential read and write tests, as well as random read and write tests with sequential access times over a portion of the drive. AS SSD includes a sub suite of benchmarks with various file pattern algorithms but this is difficult in trying to judge accurate performance figures.
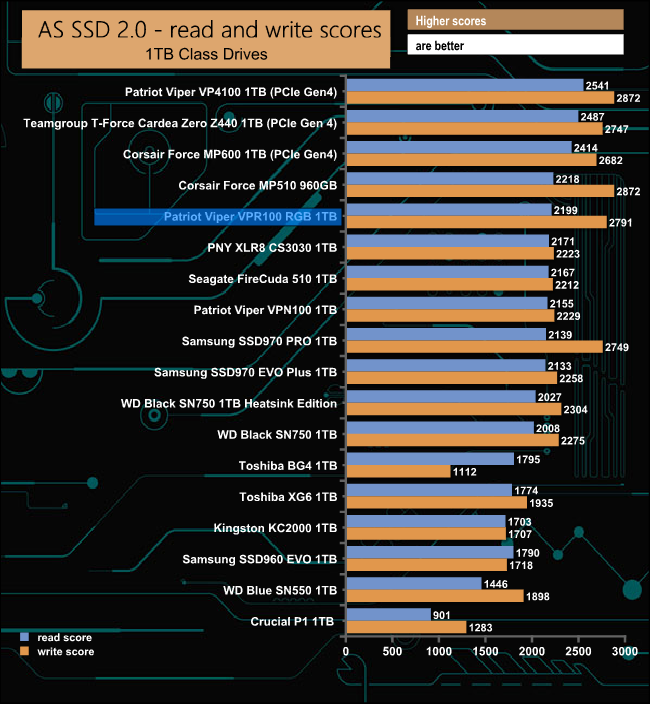
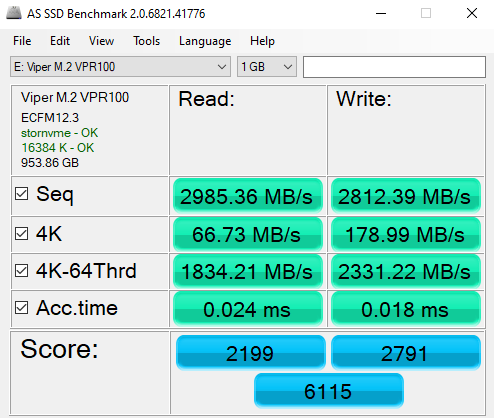
In the AS SSD benchmark, the 1TB VPR100 outscored the VPN100 for both read and writes. The read score of 2199 is 44 points better than the VPN100 while the write score of 2791 for the RGB equipped drive is a 562 point improvement.
IOMeter is another open source synthetic benchmarking tool which is able to simulate the various loads placed on hard drive and solid state drive technology. There are many ways to measure the IOPS performance of a Solid State Drive, so our results will sometimes differ from manufacturer’s quoted ratings. We do test all drives in exactly the same way, so the results are directly comparable.
We test 128KB Sequential read and write and random read and write 4k tests. The test setup’s for the tests are listed below. Each is run five times.
128KB Sequential Read / Write.
Transfer Request Size: 128KB Span: 8GB Thread(s): 1, Outstanding I/O: 1-32 Test Run: 20 minutes per test
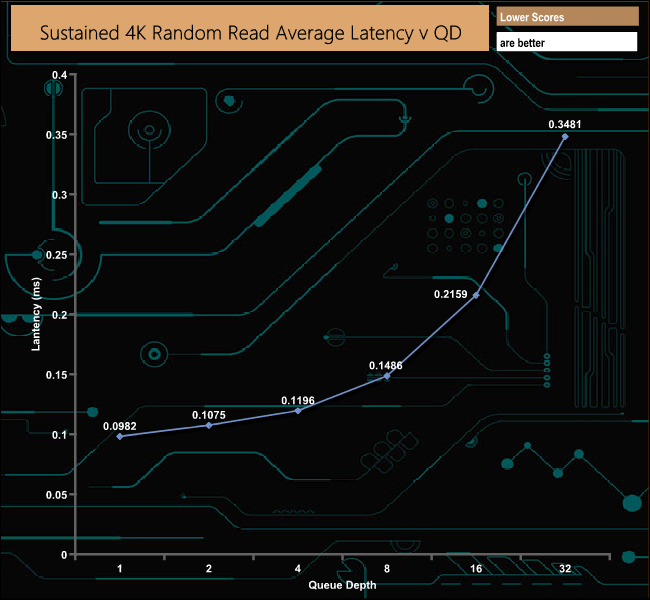
4K Sustained Random Read / Write.
Transfer Request Size: 4KB Span: 80GB Thread(s): 4, Outstanding I/O: 1-32 Test Run: 20 minutes per test
4K Random 70/30 mix Read/Write.
Transfer Request Size: 4KB Span: 80GB Reads: 70% Writes: 30% Thread(s): 4 Outstanding I/O: 2 – 32 Test Run: 20 minutes.
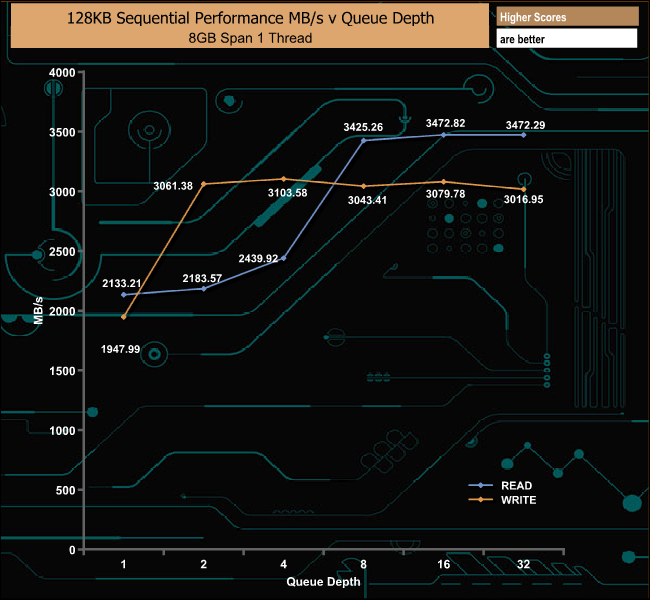
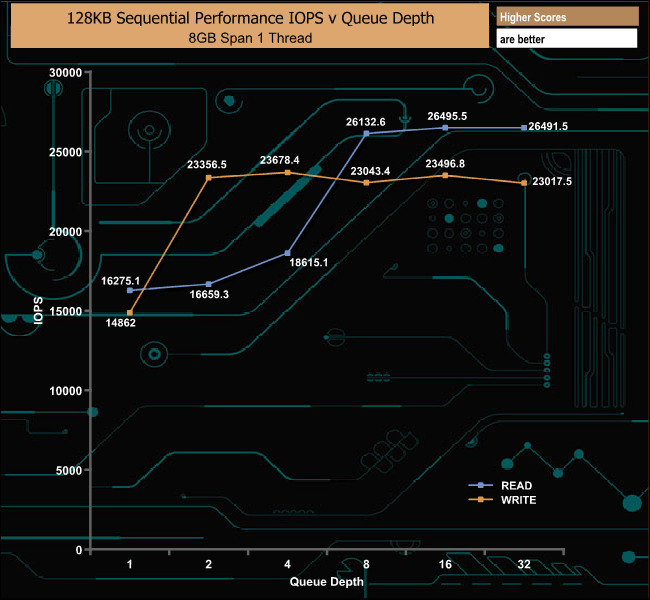
In our own Sequential tests, the fastest read performance we saw was 3472.82MB/s at a QD of 16, which is a fair way short of the official maximum of 3,900MB/s. However, the peak write performance figure of 3,103.58MB/s (QD4) is faster than the official 2,900MB/s.
128KB Sequential Read Performance v QD
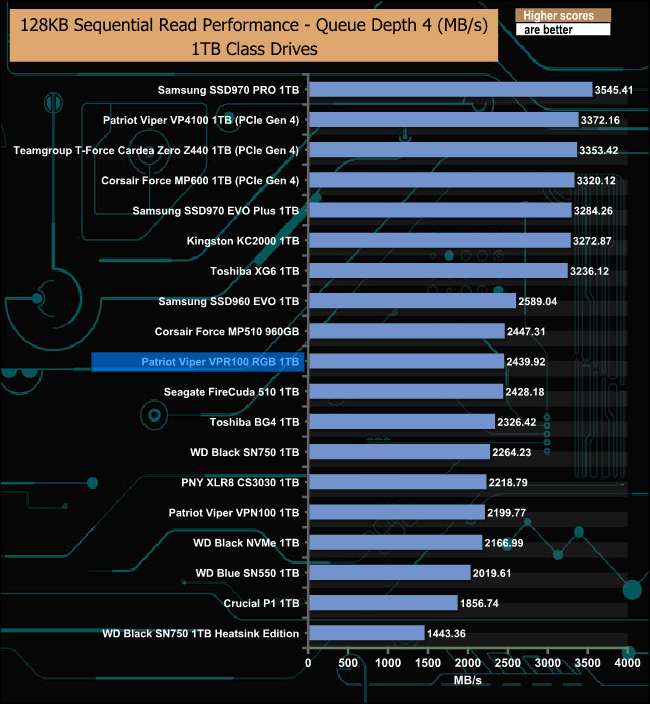
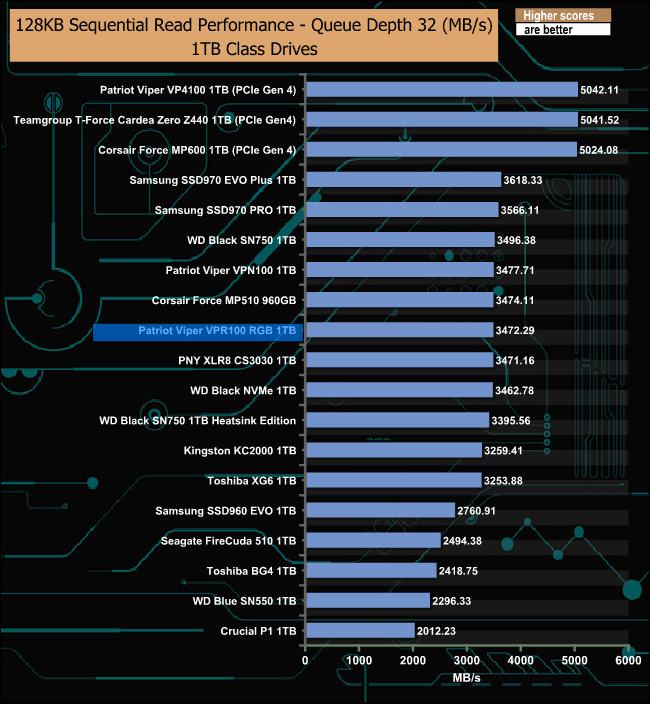
Both the Viper VPN100 and VPR100 use the same controller/NAND combination with the VPR100 having a newer version of the firmware. As you might expect there isn't much to separate the two, until it comes to the QD4 performance where the VPR100 pulls out quite a distance from the VPN100. But by the time of the QD32 test, the drives are back close together but with the VPN100 having a slight advantage.
128KB Sequential Write Performance v QD
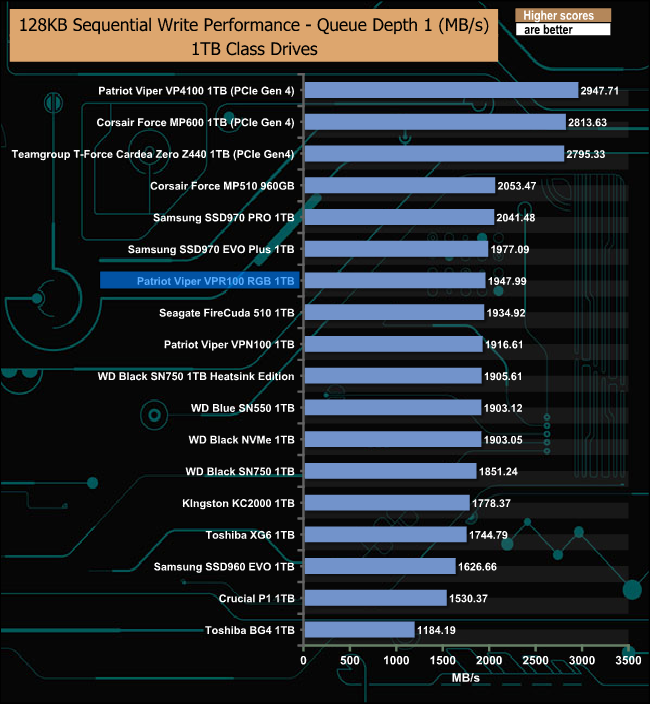
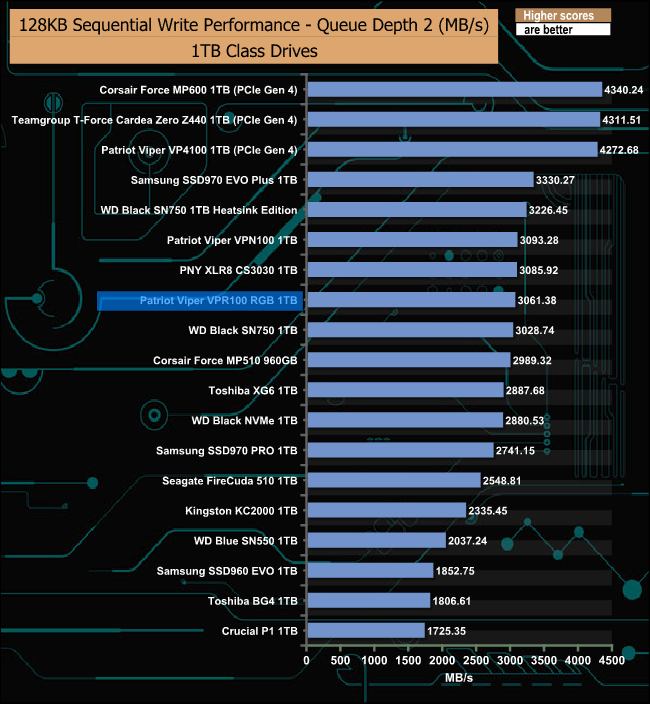
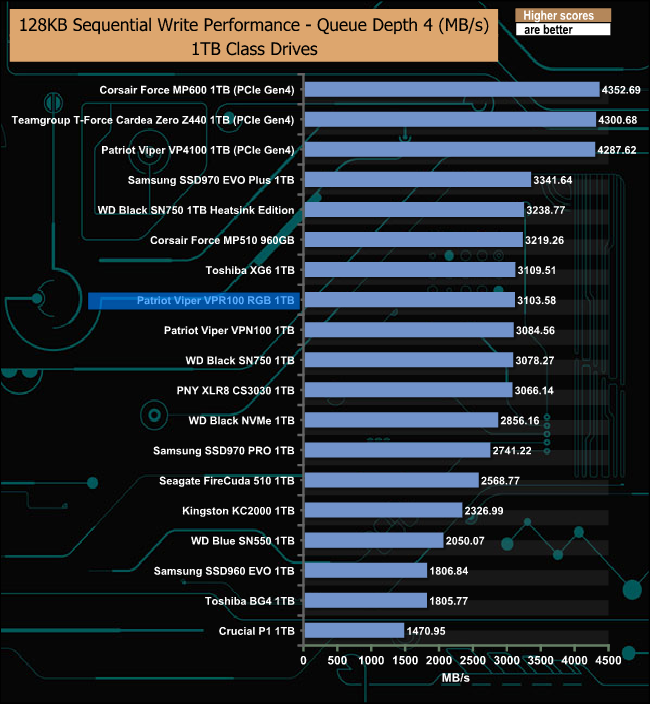
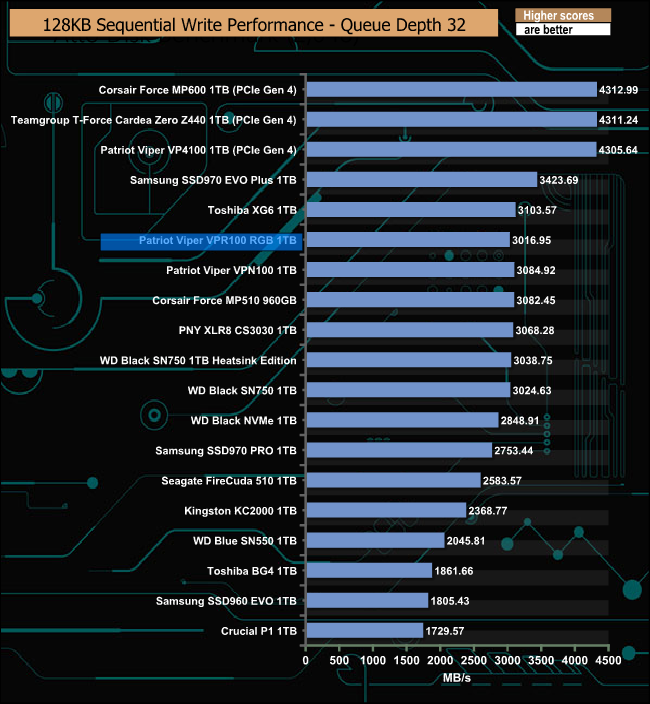
Throughout the tested write queue depths, the VPR100 and VPN100 are pretty evenly matched.
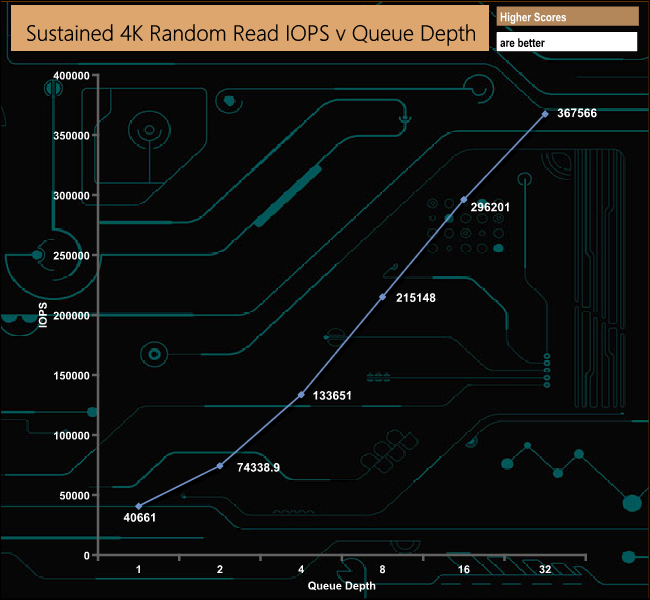
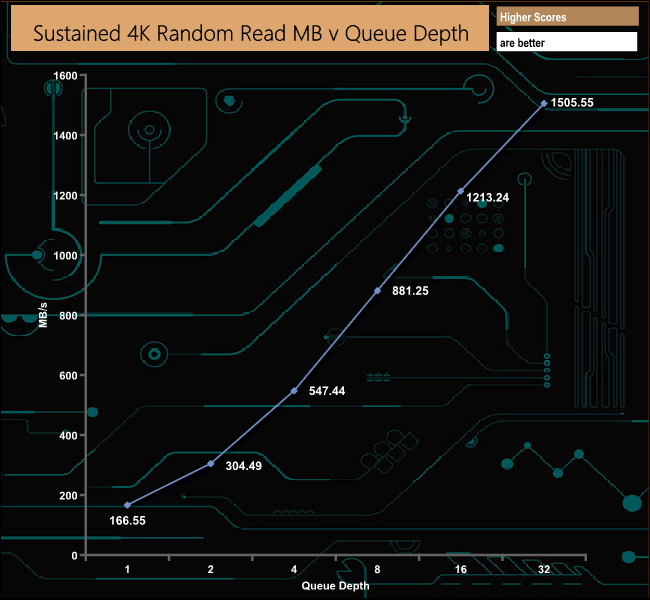
With our 4-threaded 4K random read test, the best IOPS figure we saw from the drive was 367,566 IOPS – way, way short of the maximum quoted figure of 700,000 IOPS. A quick test of the drive with 8-threads saw the read figure reach 551,445 IOPS and the only time we saw over 700,000 IOPS was in CrystalDiskMark 7's Peak Performance profile, when the drive produced a figure of 719,491 IOPS at a QD of 32 using 16 threads.
4K Random Read v QD Performance


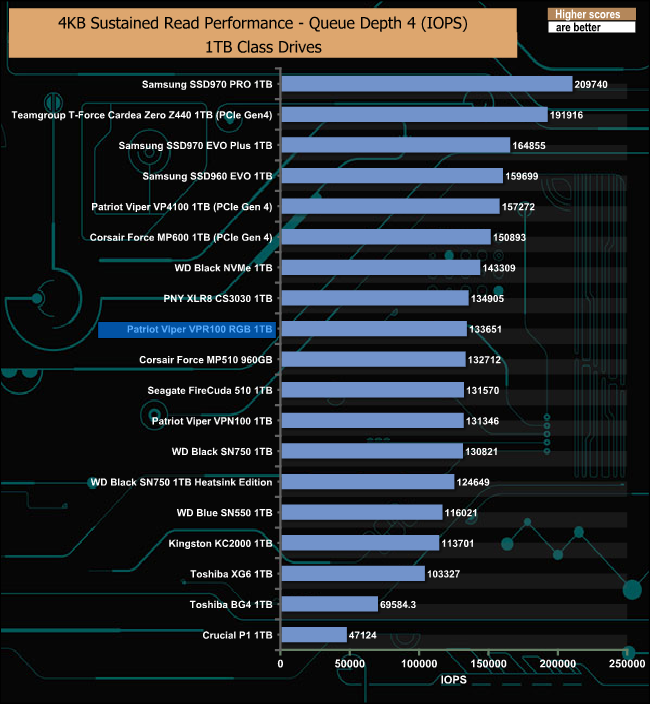

At all the tested queue depths, the VPR100 shows better random read performance than the VPN100. As both drives use the same controller and Toshiba 3D TLC NAND it must be down to tweaks in the later version of the firmware that the Viper VPR100 uses.
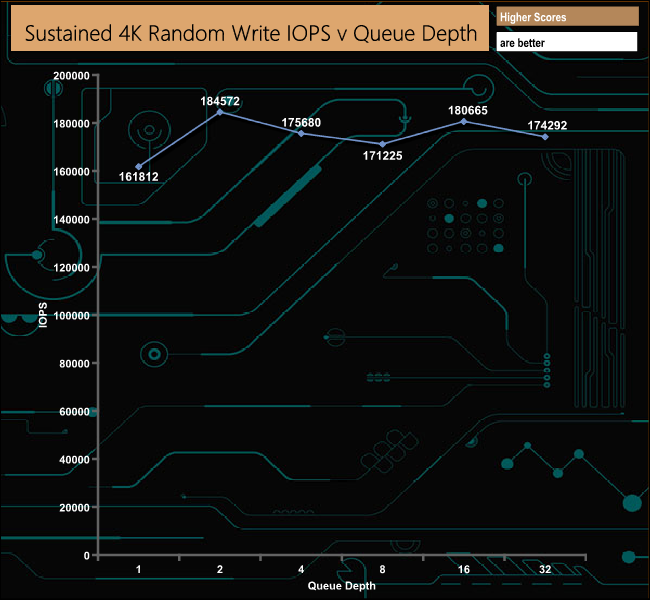
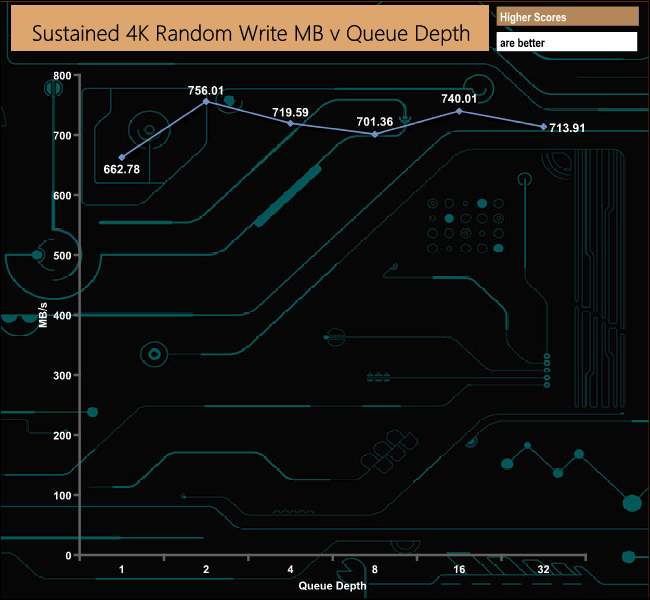
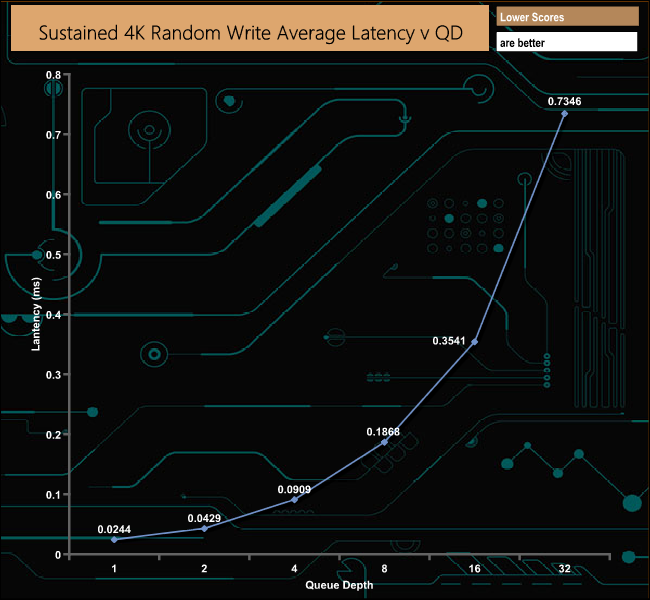
As with the random read performance, we couldn't get close to the maximum write IOPS figure of 650,000 IOPS with our 4 threaded write tests, the fastest we saw was 184,572 IOPS at QD2. The fastest write IOPS figure we saw from the drive during testing was the 622,990 IOPS (QD32 16 threads) result from the CrystalDiskMark 7 Peak Performance profile test, but even this figure is short of the official maximum of 650,000 IOPS.
4K Random Write v QD Performance
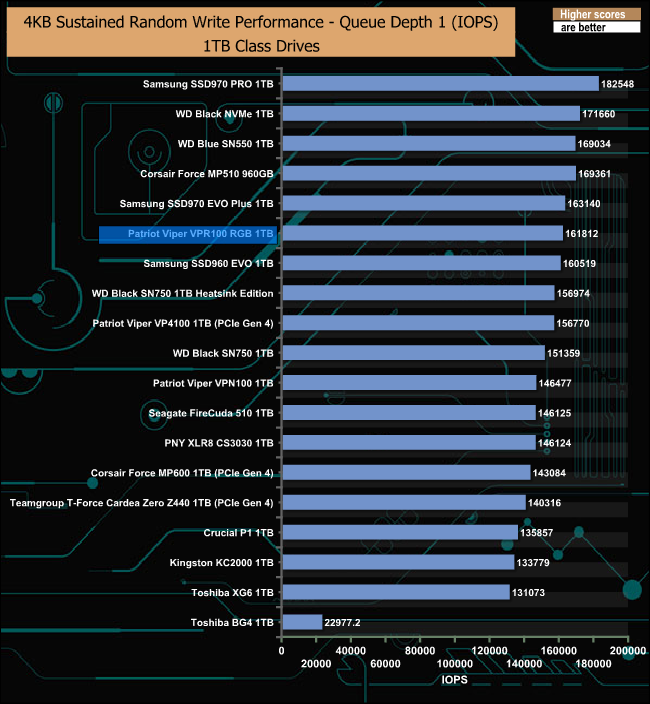
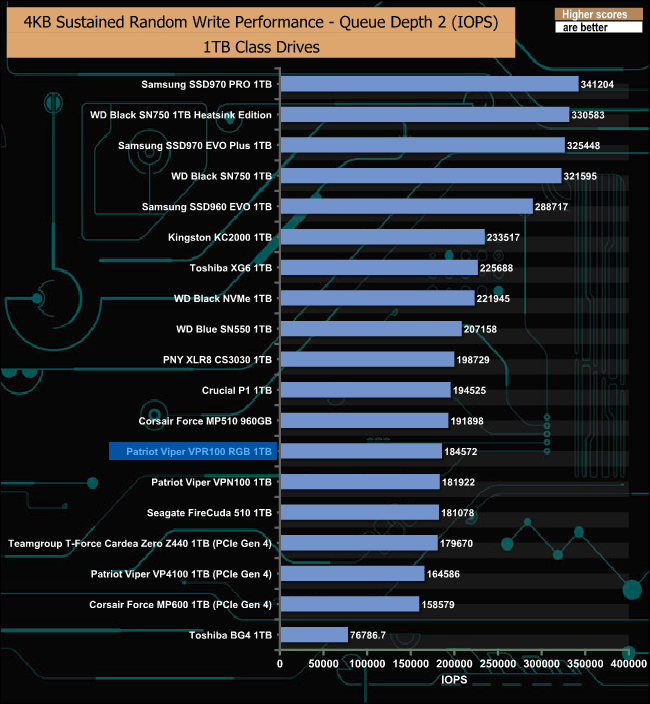
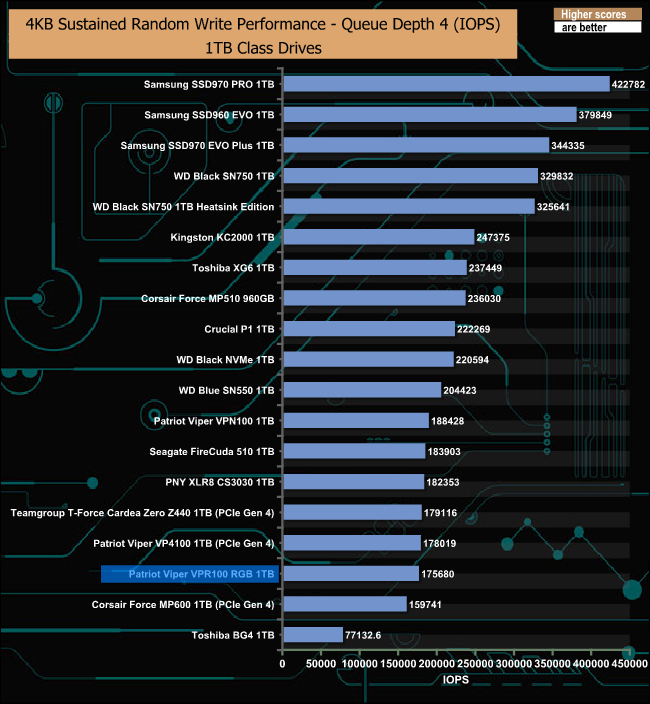
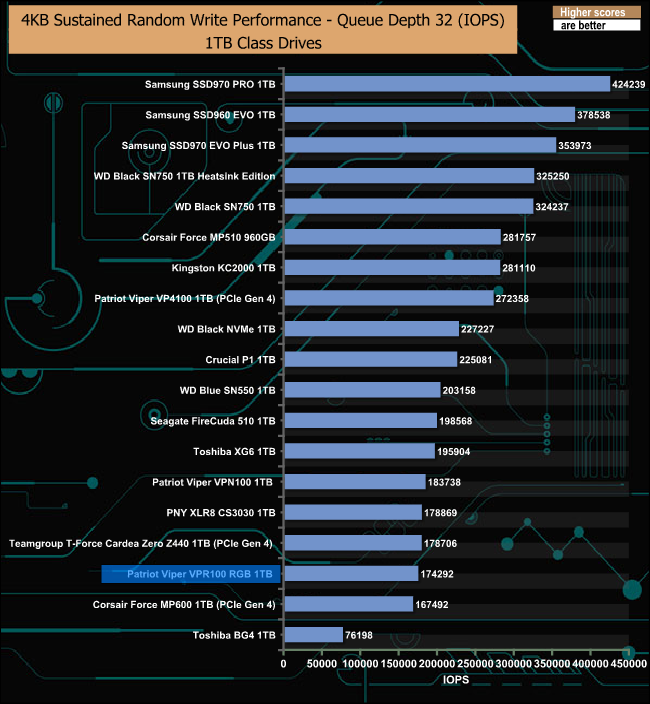
At QDs 1 and 2, the Viper VPR100 holds the advantage over the Viper VPN100 in our random write test, but at QDs 4 and 32 the positions change and it's the VPN100 that holds the advantage.
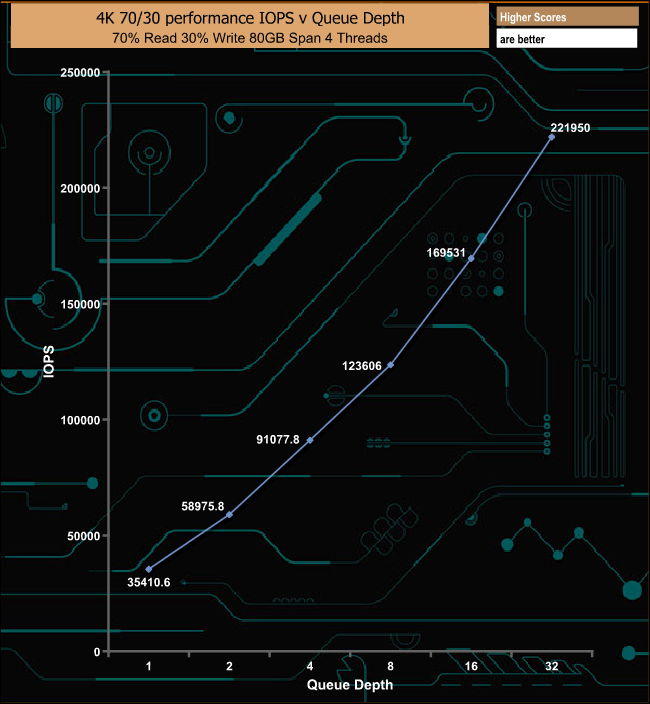
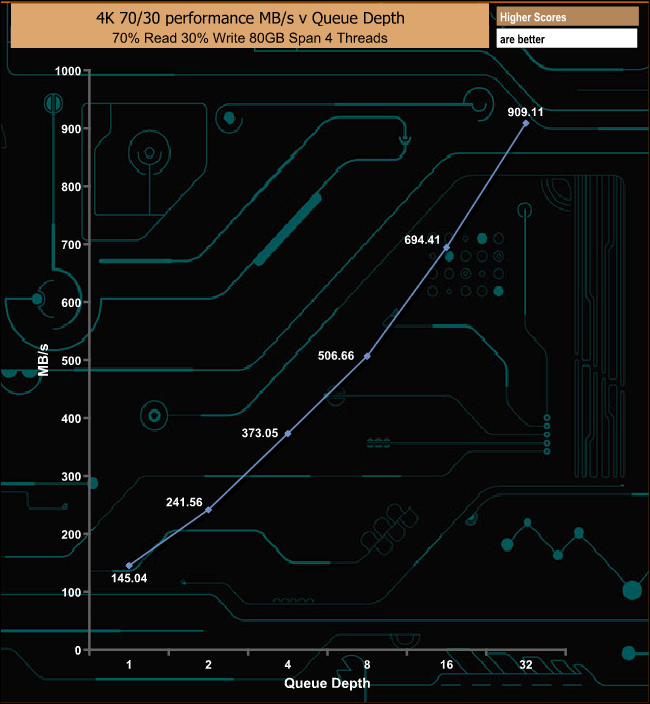
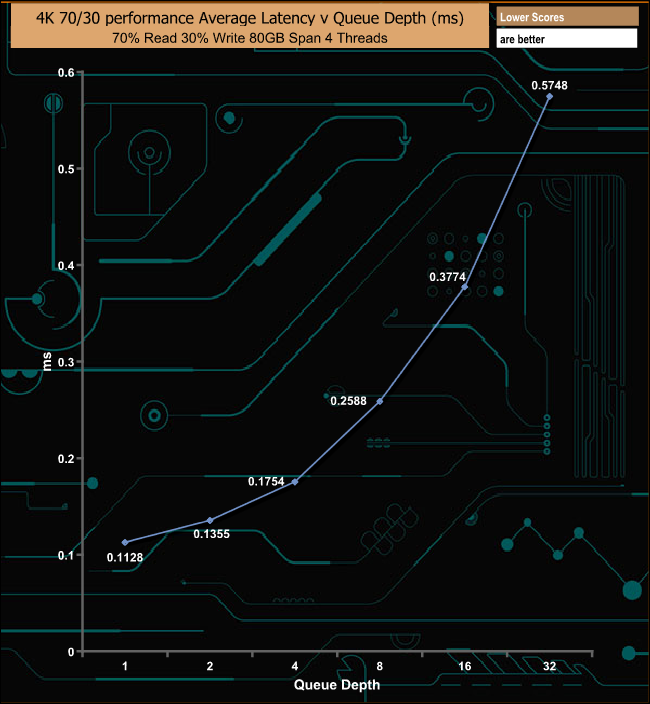
The VPR100 shows strong performance in our 70/30 read/write mixed test with the performance improving regularly as the queue depth deepened.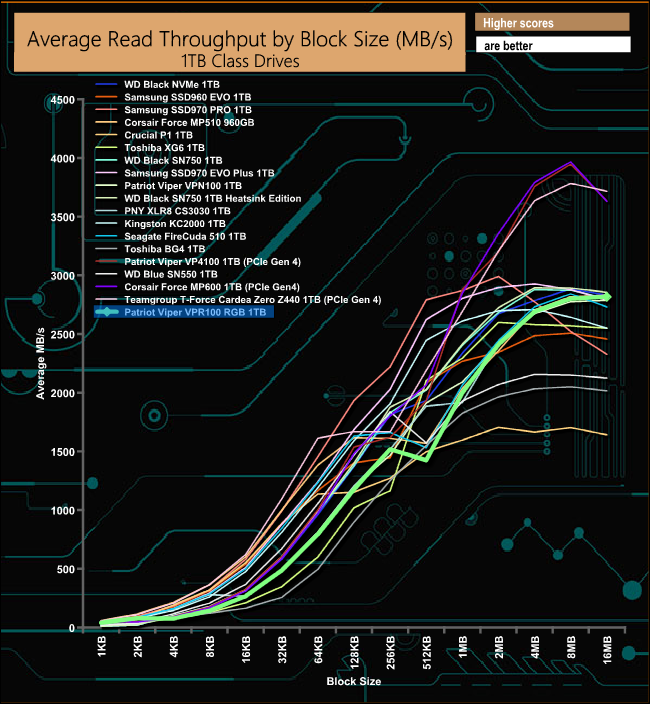
In our read throughput test, the VPR100 peaked at 2,816.65MB/s at the 16MB block mark.
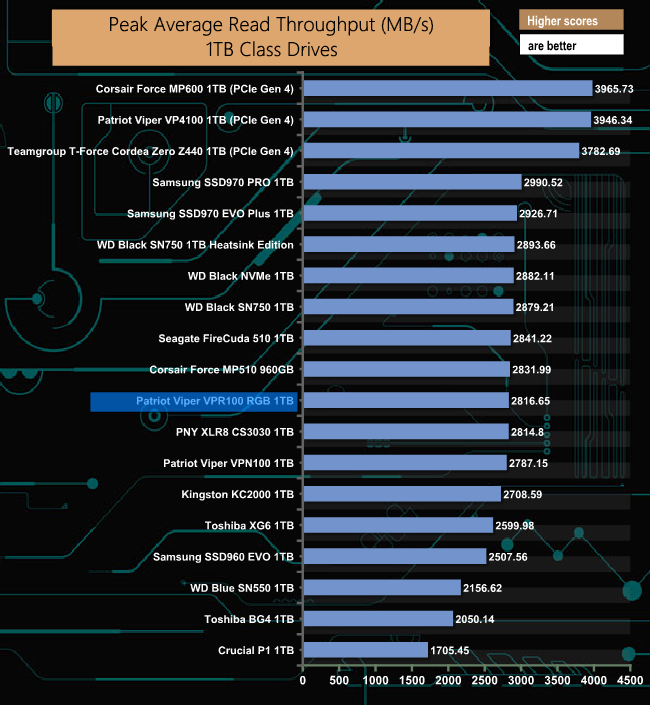
In the read throughput test, the Viper VPR100 is a shade faster than the Viper VPN100.
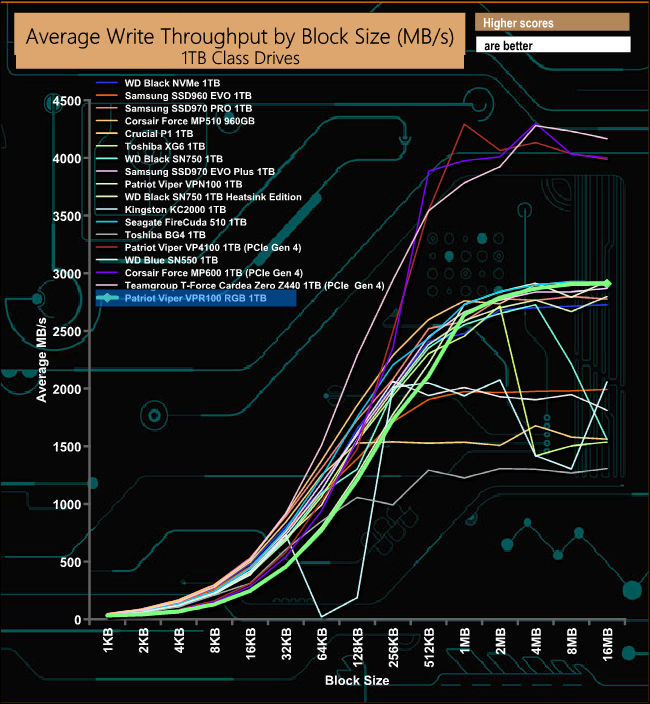
Peak average write throughput came at the 16MB block mark at 2,909.81MB/s.
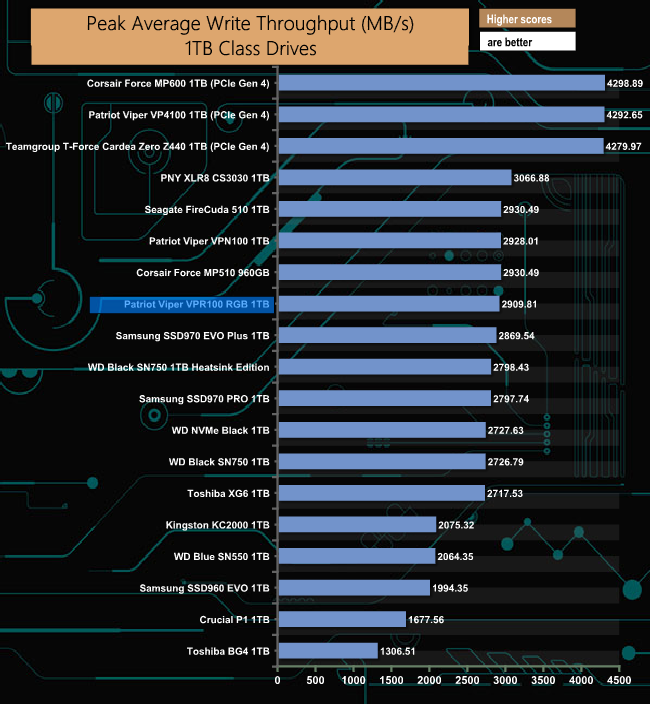 ~
~Unlike the read throughput test, in the write throughput test, it's the Viper VPN100 that holds a tiny advantage over the Viper VPR100.
Futuremark’s PCMark 8 is a very good all round system benchmark but it’s Storage Consistency Test takes it to whole new level when testing SSD drives. It runs through four phases; Preconditioning, Degradation, Steady State, Recovery and finally Clean Up. During the Degradation, Steady State and Recovery phases it runs performance tests using the 10 software programs that form the backbone of PCMark 8; Adobe After Effects, Illustrator, InDesign, Photoshop Heavy and Photoshop Light, Microsoft Excel, PowerPoint, Word, Battlefield 3 and World of Warcraft. With some 18 phases of testing, this test can take many hours to run.
Preconditioning
The drive is written sequentially through up to the reported capacity with random data, write size of 256 × 512 = 131,072 bytes. This is done twice.
Degradation
Run writes of random size between 8 × 512 and 2048 × 512 bytes on random offsets for 10 minutes. It then runs a performance test. These two actions are then repeated 8 times and on each pass the duration of random writes is increased by 5 minutes.
Steady State
Run writes of random size between 8 × 512 and 2048 × 512 bytes on random offsets for final duration achieved in degradation phase. A performance test is then run. These actions are then re-run five times.
Recovery
The drive is idled for 5 minutes. Then a performance test is run. These actions are then repeated five times.
Clean Up
The drive is written through sequentially up to the reported capacity with zero data, write size of 256 × 512 = 131,072 bytes.
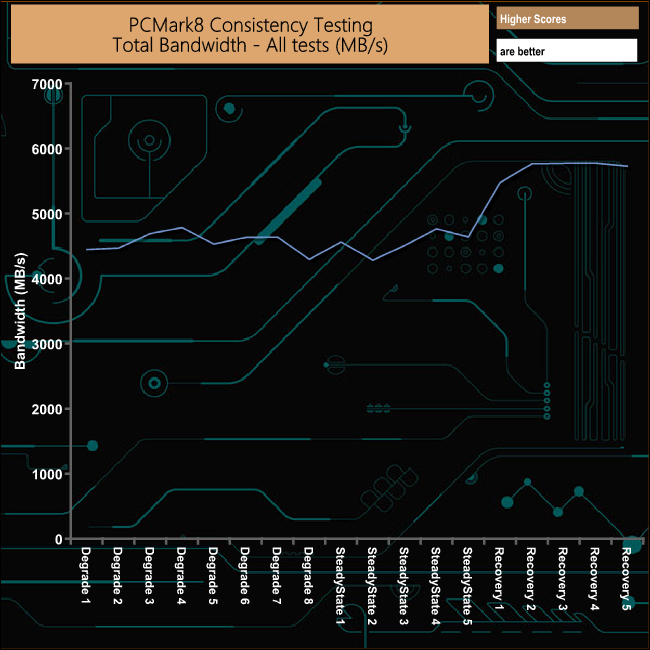
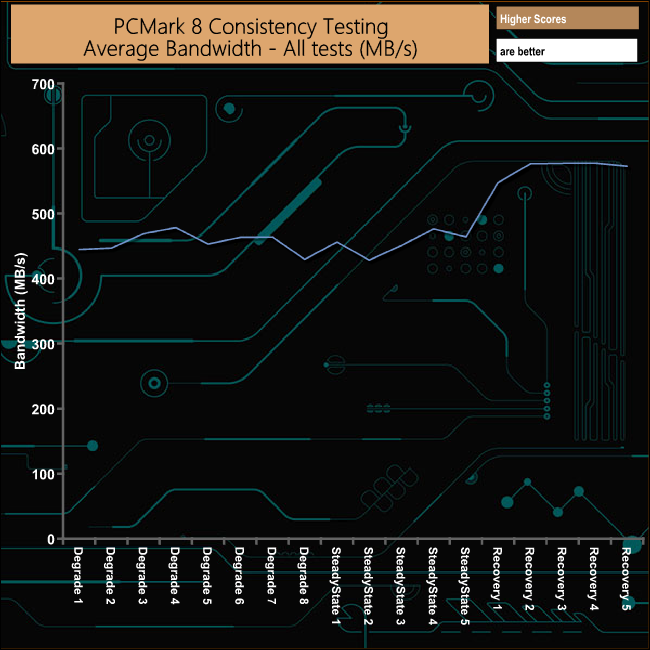
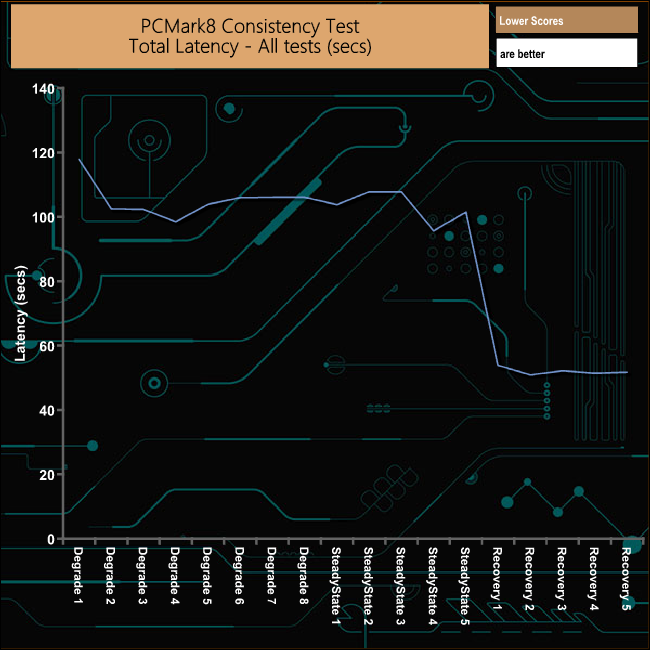
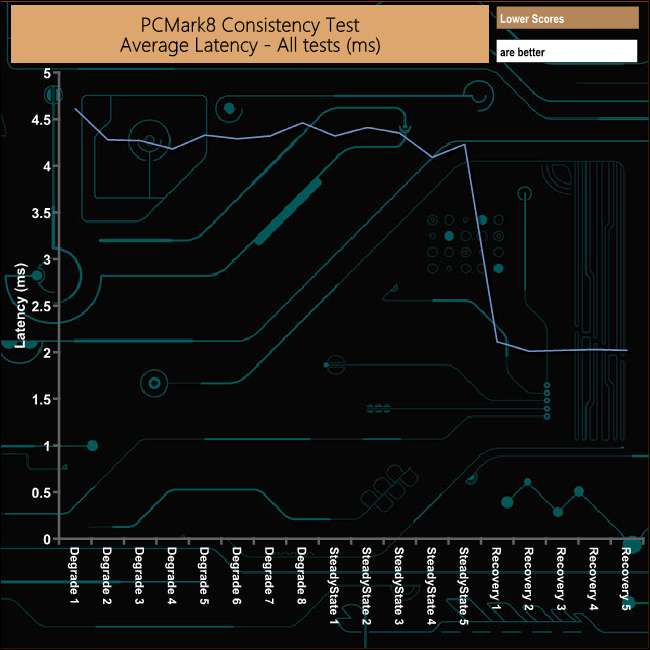
Overall Patriot's Viper VPR100 drive handles the PCMark 8 Consistency test pretty well. There are no alarming dips in bandwidth and the while the performance during the Recovery phase isn't exactly spectacular, it is very consistent through the latter stages of the phase.
PCMark 8’s Consistency test provides a huge amount of performance data, so here we’ve looked a little closer at how the Patriot Viper VPR100 performs in each of the benchmarks test suites.
Adobe Creative Cloud
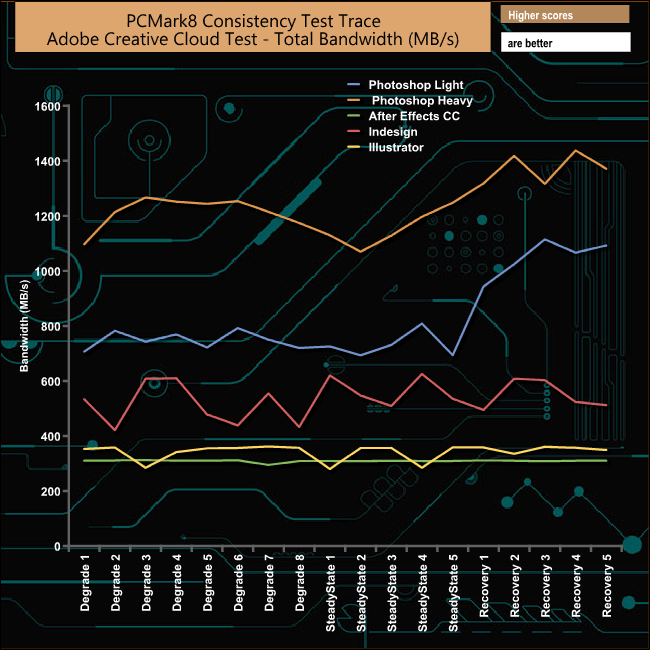
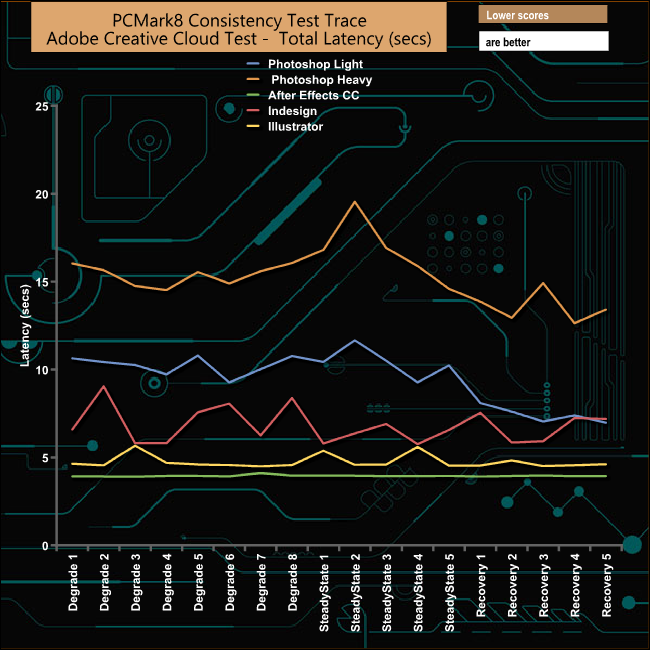
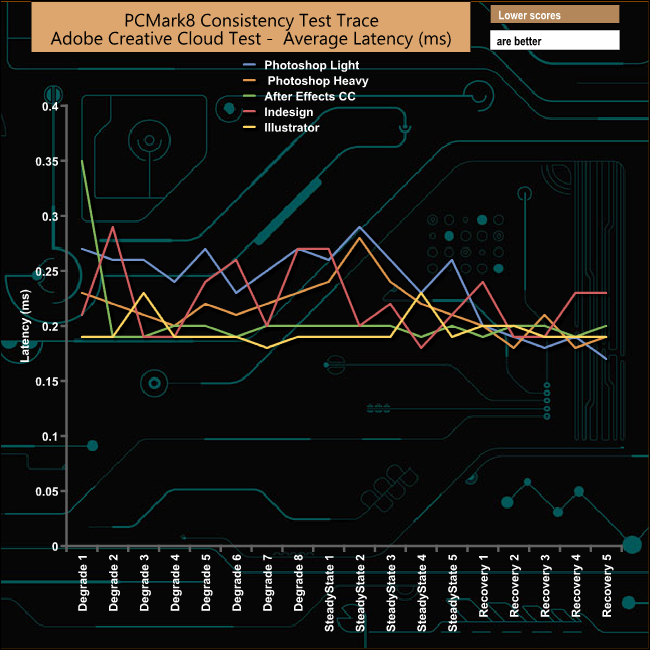
The drive's performance during the Adobe CC test phase does suffer somewhat. Both the Photoshop Light and Heavy tests along with the Indesign trace show pretty large dips in bandwidth, and while the two Photoshop tests show fairly good – if inconsistent – performance during the Recovery phases, the Indesign trace's performance trails off the longer the Recovery phase goes on.
Microsoft Office
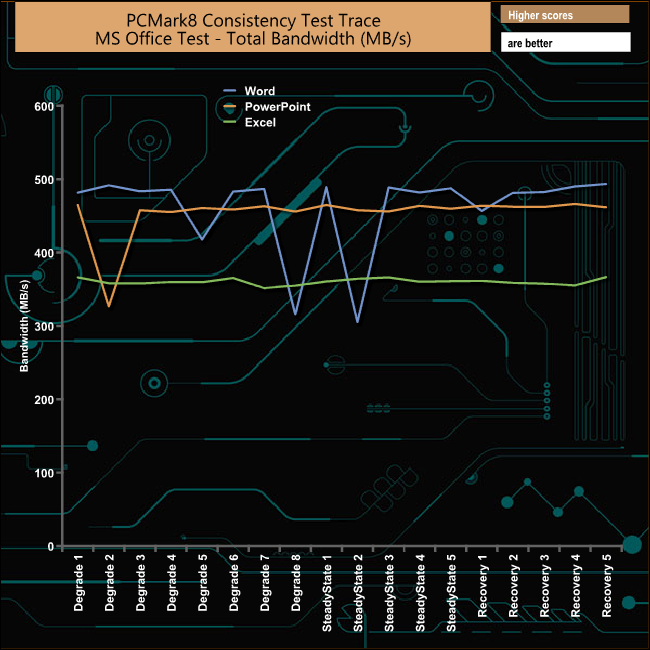

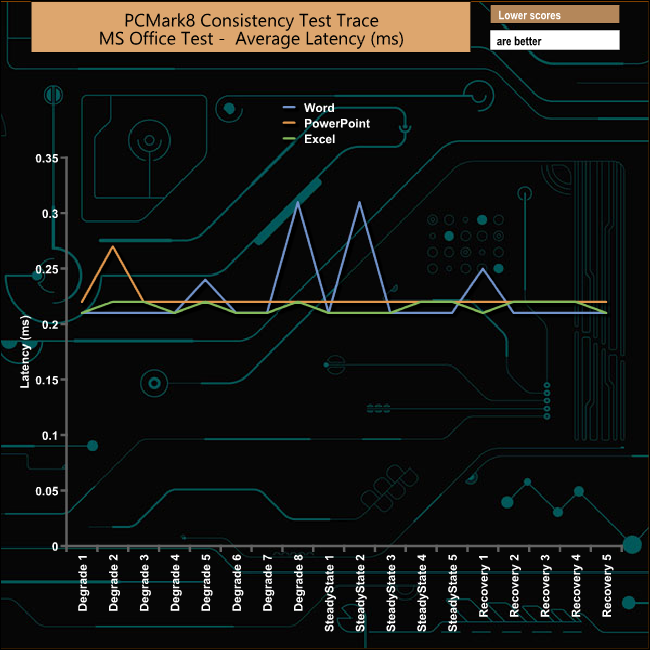
As is quite often the case in the MS Office part of PCMark 8's Consistency Test, it's the Word trace that has problems. At the eighth Degradation phase and the second Steady State stage, there are real drops in bandwidth, along with associated peaks in the latency, although the drive does recover well on both occasions. The PowerPoint trace suffers a similar drop in the second Degradation phase.
Casual Gaming
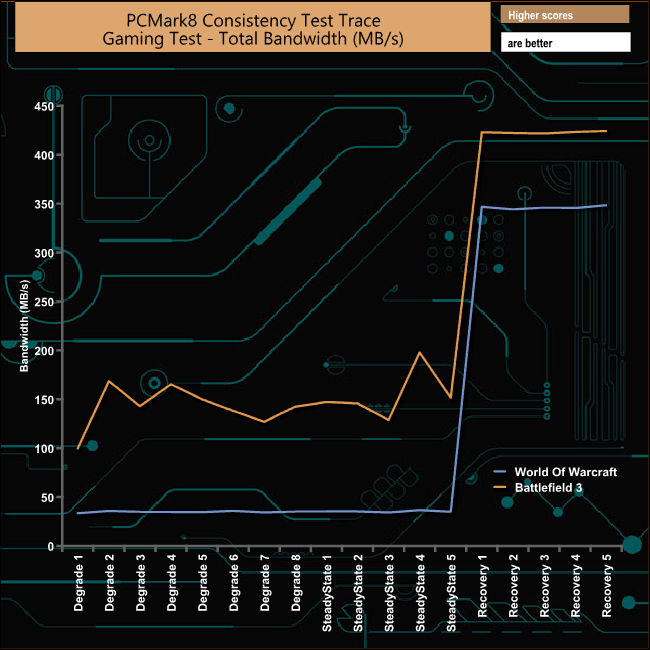
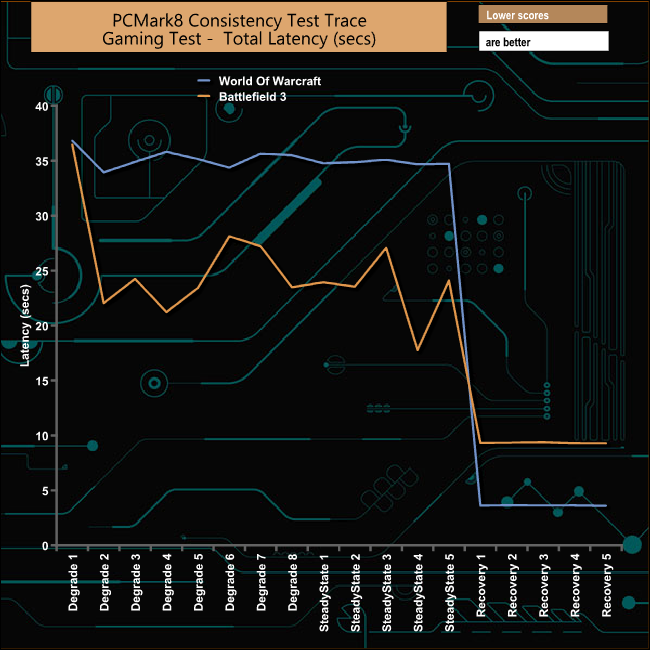
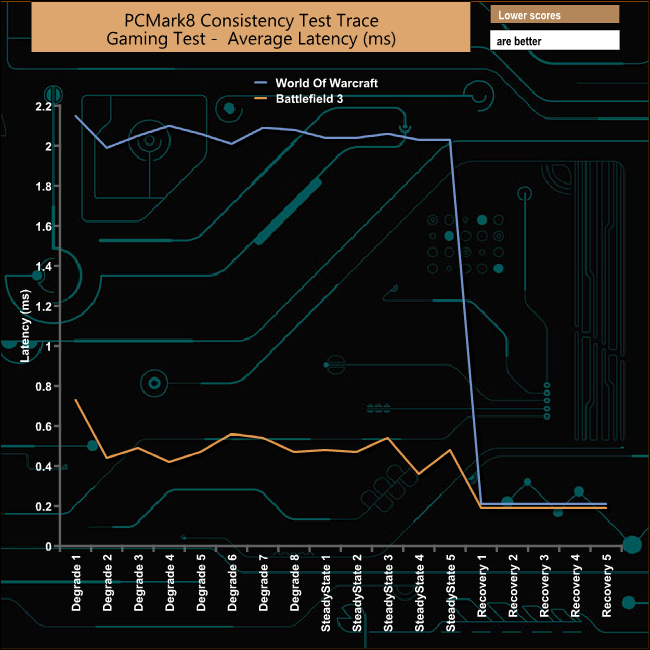
The one thing that stands out in the Casual Gaming tests is the huge leap in performance from the last SteadyState phase to the first Recovery run for both traces. The World Of Warcraft trace hardly misses a beat through the testing phase but it is operating at a much lower bandwidth than the Battlefield 3 trace.
Just like the Consistency test, PCMark 8’s Standard Storage test also saves a large amount of performance data. The default test runs through the test suite of 10 applications three times. Here we show the total bandwidth performance for each of the individual test suites for the third and final benchmark run.
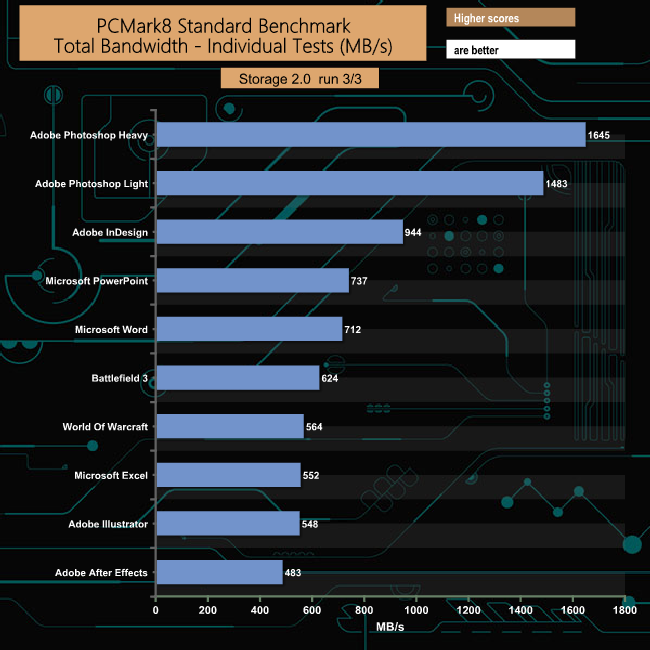
The Patriot Viper VPR100 displayed strong performance for all of the test suites in PCMark 8's Standard Storage test, particularly in the two Photoshop and InDesign tests. The Microsoft Word and PowerPoint results are worth pointing out as well.
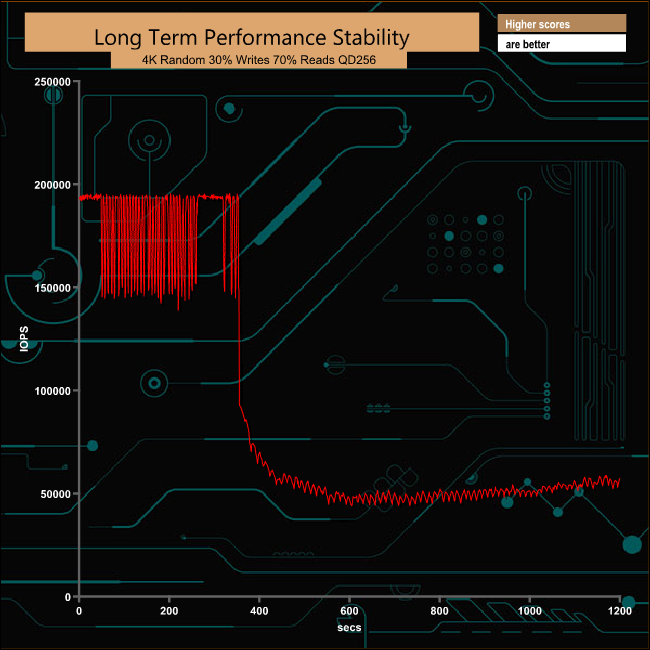
For the long term performance stability test, we set the drive up to run a 20-minute 4K random test with a 30% write, 70% read split, at a Queue Depth of 256 over the entire disk. The Patriot Viper VPR100 RGB averaged 91,291 IOPS for the test with a performance stability of 47%.
To test real life performance of a drive we use a mix of folder/file types and by using the FastCopy utility (which gives a time as well as MB/s result) we record the performance of drive reading from & writing to a 256GB Samsung SSD850 PRO.
We use the following folder/file types:
- 100GB data file.
- 60GB iso image.
- 60GB Steam folder – 29,521 files.
- 50GB File folder – 28,523 files.
- 21GB 8K Movie demos.
- 12GB Movie folder – 24 files (mix of Blu-ray and 4K files).
- 11GB 4K Raw Movie Clips (8 MP4V files).
- 10GB Photo folder – 621 files (mix of png, raw and jpeg images).
- 10GB Audio folder – 1,483 files (mix of mp3 and .flac files).
- 5GB (1.5bn pixel) photo.
- Blu-ray movie.
256GB Samsung SSD850 PRO
![]()
The Patriot Viper VPR100 had no problem dealing with any of our real-life file transfers, averaging well over 500MB/s write performance for the majority of the tests.
OCZ RD400
To get a measure of how much faster PCIe NVMe drives are than standard SATA SSDs we use the same files but transfer to and from a 512GB Toshiba OCZ RD400.
![]()
Adding another NVMe drive to the mix saw those 500MB write figures for the SATA transfers dwarfed by the NVMe drive's performance, with over 1GB/s transfer rates for most of the tests. The 5GB Photo, 4K Movie Clip and 12GB Movie folders topped at over 2.5GB/s.
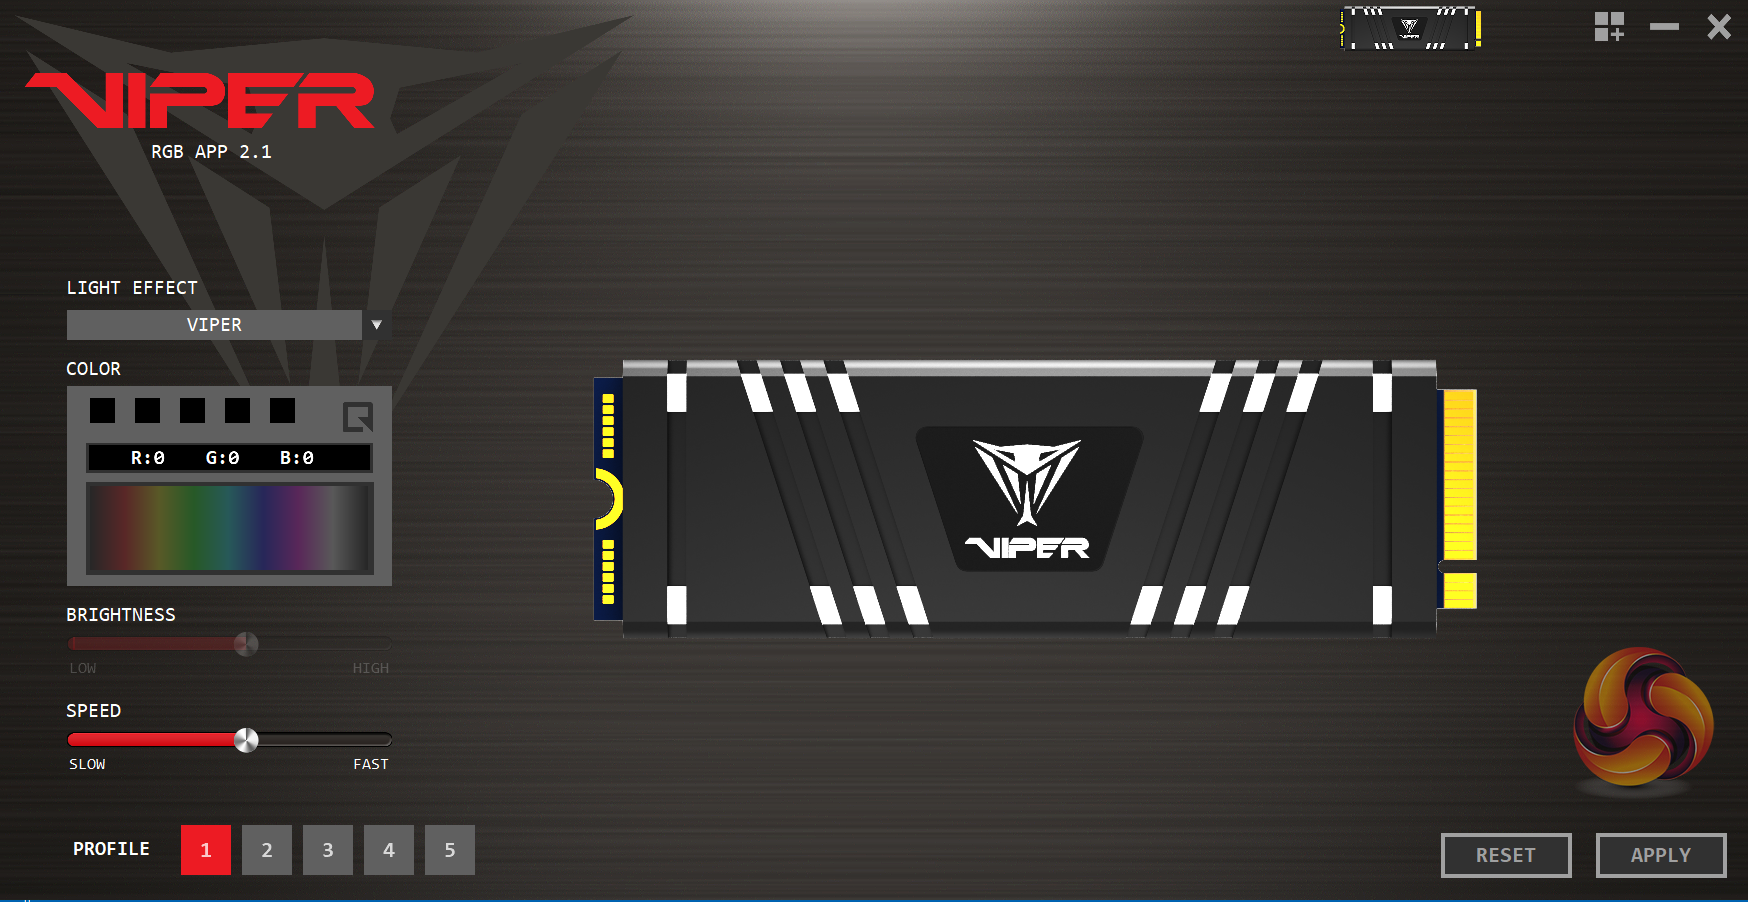
Patriot's Viper RGB APP (v2.1) software controls the VPR100's lightening effects. The control panel may look a bit basic but it does allow a host of options to be changed. There are eight standard effects including a Dark mode that switches the RGB off; the other seven are: Viper (the default option out of the box), Breathing, Heartbeat, Marquee, Raindrop, Aurora and Neon.
It also allows the colour of the five lighting zones to be changed as well as the speed and brightness of the effects. It also can be controlled by the motherboard's RGB software. The VPR100 is compatible with ASRock's Polychrome Sync, ASUS AURA Sync, Gigabyte RGB Fusion and MSI's Mystic Light Sync.
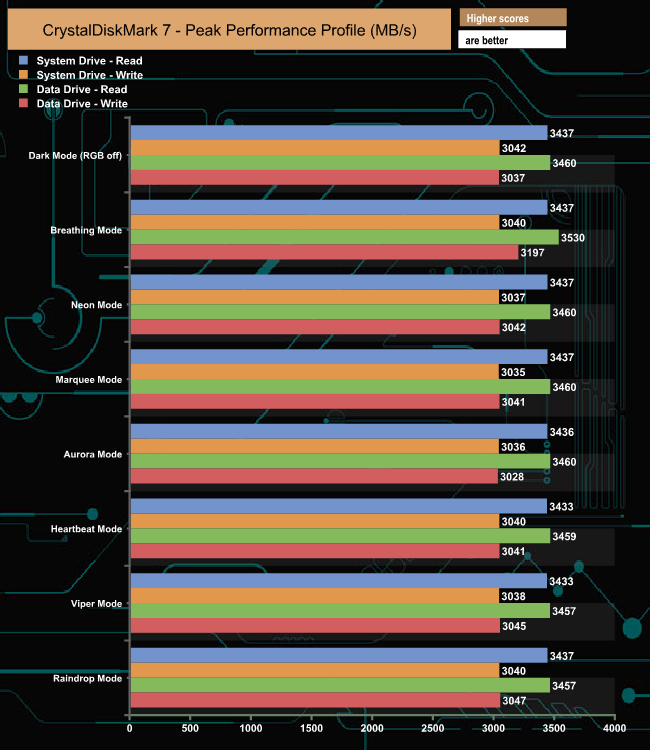
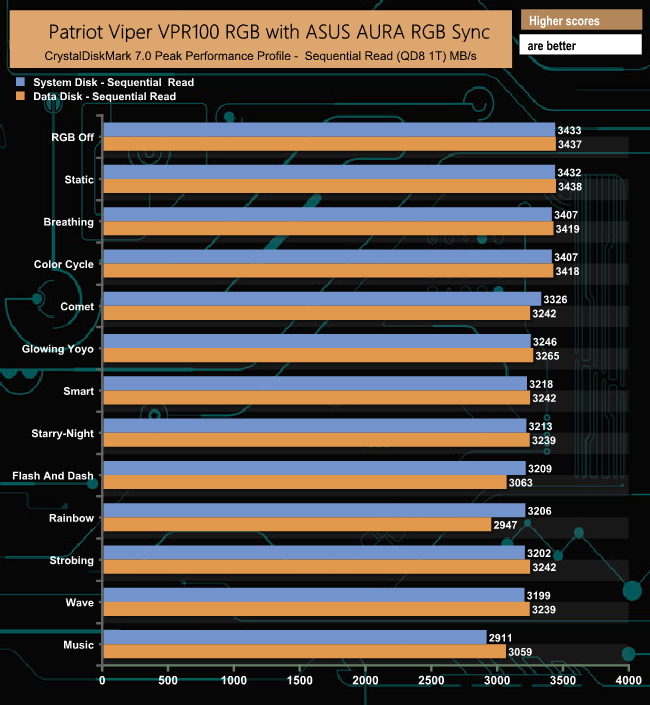
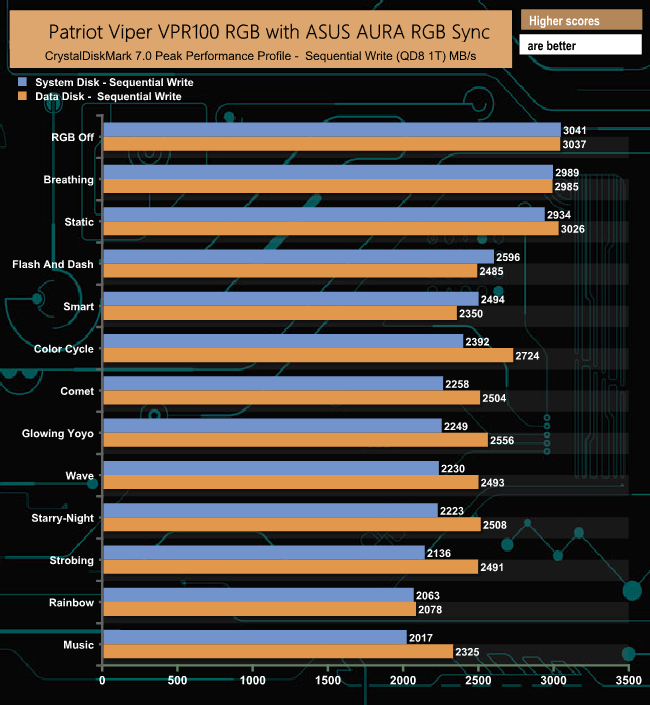
Now back to that “RGB sync may decrease up to 20-30% Read/Write speed” quote in the spec sheet. We tested the drive (both as a Windows 10 system disk and as a secondary data disk) in all eight integrated modes with Crystal Disk Mark 7's Peak Performance test to push the drive hard, and saw hardly any movement in the Sequential read/write figures.
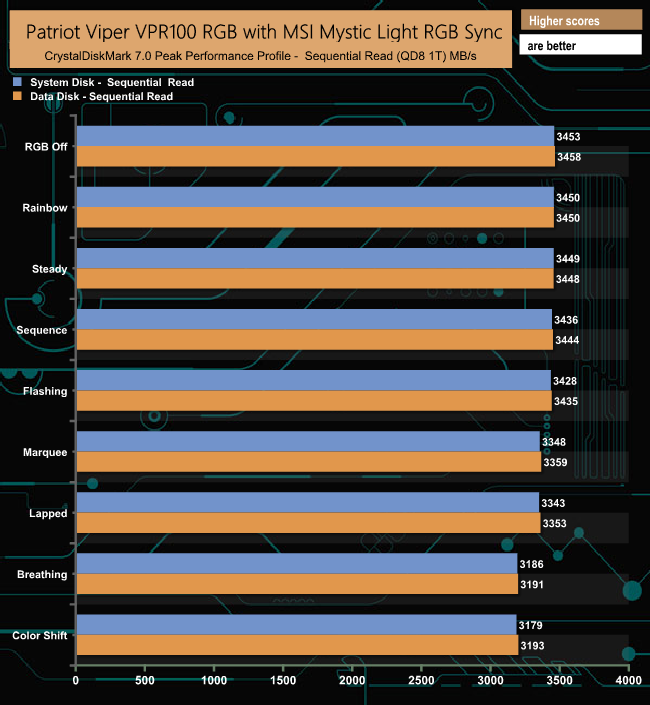
We then tested the drive in the two RGB equipped motherboards we use for testing, the ASUS Prime Z270-A with ASUS AURA RGB and the MSI MPG X570 Gaming Edge Wifi supporting MSI's Mystic Light RGB. Again we tested with Crystal Disk Mark 7's Peak Performance test with the RGB modes kept at default settings and used the average MB/s of five test runs.
ASUS AURA
ASUS AURA Performance Drop %
| Drive Setup | RGB Mode | Read | Write | Drive Setup | RGB Mode | Read | Write | |
| System Disk | Data Disk | |||||||
| Static | 0 | 3 | Static | 0 | 0 | |||
| Breathing | 0 | 1 | Breathing | 0 | 1 | |||
| Color Cycle | 0 | 21 | Color Cycle | 0 | 10 | |||
| Comet | 3 | 26 | Comet | 5 | 17 | |||
| Glowing Yoyo | 5 | 26 | Glowing Yoyo | 5 | 16 | |||
| Smart | 6 | 18 | Smart | 6 | 22 | |||
| Starry-Night | 6 | 27 | Starry-Night | 6 | 17 | |||
| Flash And Dash | 6 | 14 | Flash And Dash | 11 | 18 | |||
| Rainbow | 6 | 32 | Rainbow | 14 | 31 | |||
| Strobing | 7 | 29 | Strobing | 5 | 18 | |||
| Wave | 7 | 26 | Wave | 5 | 18 | |||
| Music | 15 | 33 | Music | 11 | 23 |
MSI Mystic Light
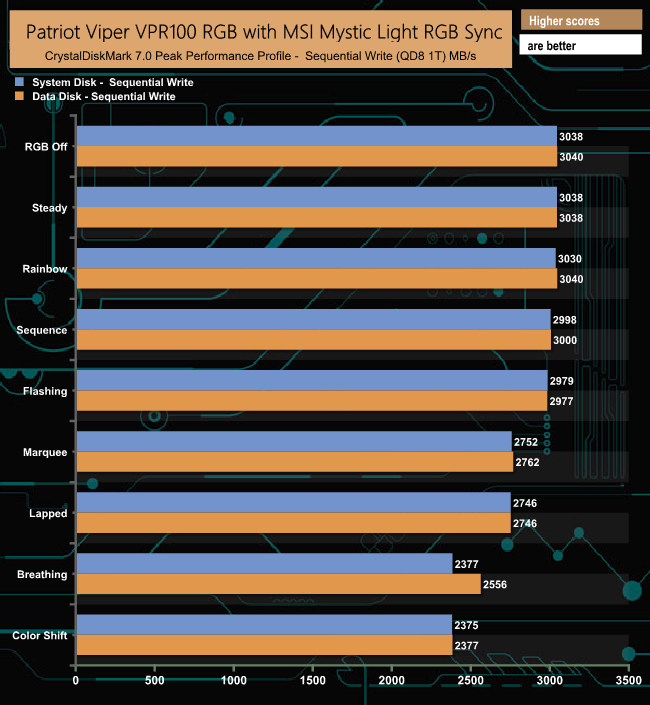
MSI Mystic Light Performance Drop %
| Drive Setup | RGB Mode | Read | Write | Drive Setup | RGB Mode | Read | Write | |
| System Disk | Data Disk | |||||||
| Rainbow | 0 | 0 | Rainbow | 0 | 0 | |||
| Steady | 0 | 0 | Steady | 0 | 0 | |||
| Sequence | 0 | 1 | Sequence | 0 | 1 | |||
| Flashing | 0 | 2 | Flashing | 0 | 2 | |||
| Marquee | 3 | 9 | Marquee | 3 | 9 | |||
| Lapped | 3 | 9 | Lapped | 3 | 9 | |||
| Breathing | 7 | 22 | Breathing | 7 | 16 | |||
| Color Shift | 8 | 22 | Color Shift | 7 | 22 |
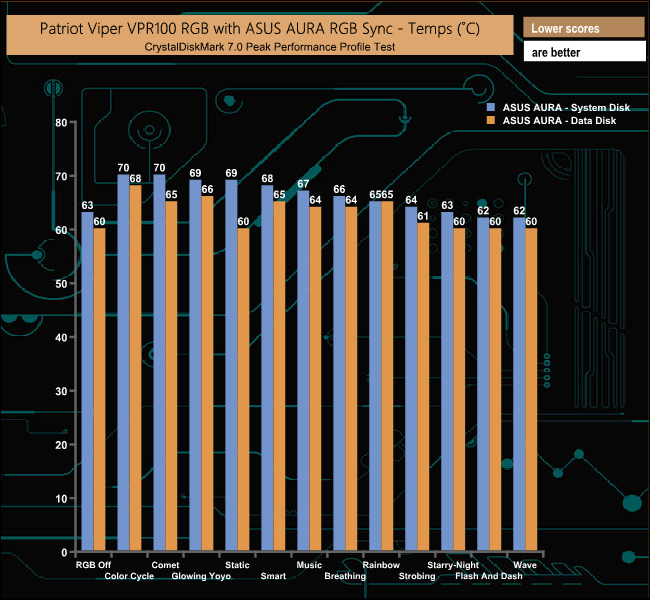
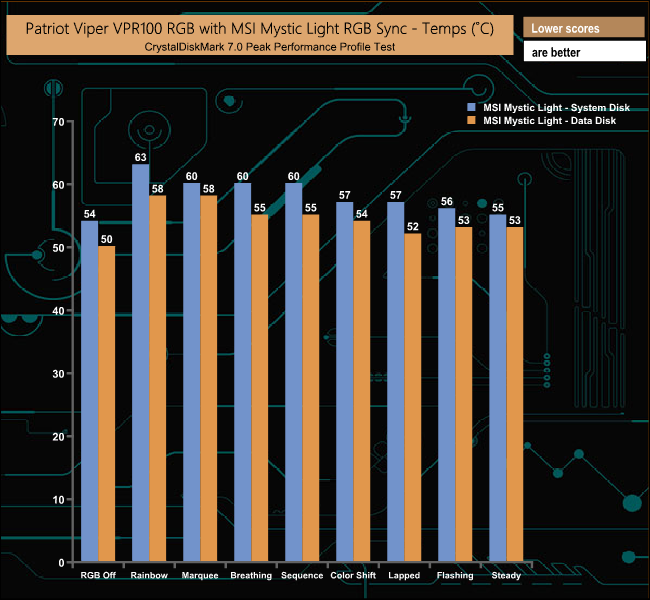
Looking at the temperature readings for the drive during these RGB test runs, the drive does get a little toasty, but not enough to start throttling back to cause the performance issues we saw. In any case, some of the largest drops are where the drive is running slightly cooler than other RGB modes.
Although the ASUS and MSI boards are using different chipsets, with the RGB turned off on the VPR100 there's not much difference in Sequential performance between them.
The problem appears to be that by controlling some of these RGB effects and being pushed hard, particularly when in write mode, is overwhelming the Phison PS5012-E12 controller to such an extent, that the performance is being compromised. The VPR100 seems to have more problems dealing with the RGB options in the ASUS AURA RGB than the MSI Mystic Light choices, but that's not to say that it doesn't suffer a significant drop in performance in a couple of the Mystic Light modes.
In the world of M.2 drives, Patriot's Viper VPR100 RGB is a bit of a rarity, in that it is one of a very few drives that have RGB lightning – and even rarer still the RGB effects are controlled by RGB APP Sync software. In fact, the VPR100 is the world's first M.2 drive using it. Patriot's Viper RGB APP software has eight standard effects including a Dark mode that switches the RGB off. The software also allows the colour of the five lighting zones in the heatsink to be changed as well as the speed and brightness of the effects.
The Viper VPR100 uses the same Phison PS5012-E12 controller and Toshiba 3D TLC NAND combination as the standard non-RGB Viper VPN100. Although the RGB-equipped heatsink cooling the VPR100 RGB drive looks impressively large, it's still 3.5mm lower than the lump that keeps the Viper VPN100 cool, but the RGB heatsink is 3mm wider.
Patriot quotes Sequential performance figures for the 1TB model as up to 3,300MB/s for reads and up to 2,900MB/s – looking at the spec sheet, these are the figures from ATTO testing. Also listed in the specs are the Sequential performance figures for the drive when tested with CrystalDiskMark; 3,900MB/s for reads and the same 2,900MB/s for writes. When tested with ATTO 4, we couldn't quite get to those maximum ATTO scores, the review drive producing figures of 3,180MB/s for reads and 2,830MB/s for writes.
Random performance is quoted as up to 700,000 IOPS for reads and up to 650,000 IOPS writes. We couldn’t match those figures with our standard 4-threaded tests, where the best read score we got was 367,566 IOPS and 184,572 IOPS for writes. The only time we saw figures approaching the official figures was when the drive was tested with the Peak Performance profile in CrystalDiskMark 7. The drive produced a read figure of 719,491 IOPS with writes at 622,990 IOPS, both figures at a QD of 32 using 16 threads.
Now to a rather important little nugget contained in the specification sheet. To quote Patriot, “RGB sync may decrease up to 20-30% Read/Write speed” which sounds a little concerning, to say the least. We tested the drive as a system drive (Windows 10) and as a secondary drive, using all eight standard RGB modes in the Viper RGB software with Crystal Disk Mark 7's Peak Performance test to push the drive and saw hardly any movement in the Sequential read/write figures.
However, when we then pushed the drive with CrystalDiskMark and used the RGB sync software of our two test rig motherboards; ASUS AURA and MSI's Mystic Light, then we saw some pretty dramatic drops in performance as per the note in the specification sheet.
The first thing that comes to mind after seeing these drops in performance is that maybe the drive is getting too hot and throttling back – but although the drive does get very warm on occasions, some of the bigger drops occur when the drive is actually running cooler than others.
It appears that the Phison PS5012-E12 controller has real problems when the drive is being pushed hard and using certain RGB modes at the same time. With some RGB modes, Sequential Read performance is affected but by far the biggest performance drops occurred during our Sequential write tests.
Patriot quotes a TBW endurance figure of 1600TB for the VPR100, which although impressive is less than the VPN100 which gets a rating of 1665TB.
The VPR100 1TB is available from Amazon UK for £179.99 HERE.
Pros
- Overall performance.
- Endurance rating.
- RGB.
Cons
- 4K performance didn't match official maximums in some tests.
- RGB sync has the potential to affect read/write performance.
KitGuru says: Patriot's Viper VPR100 combines good performance with very good endurance, but just bear in mind that certain RGB sync options may cost you a chunk of read/write performance.