
CrystalDiskMark is a useful benchmark to measure theoretical performance levels of hard drives and SSD’s. We are using v6.0 and v8.0.
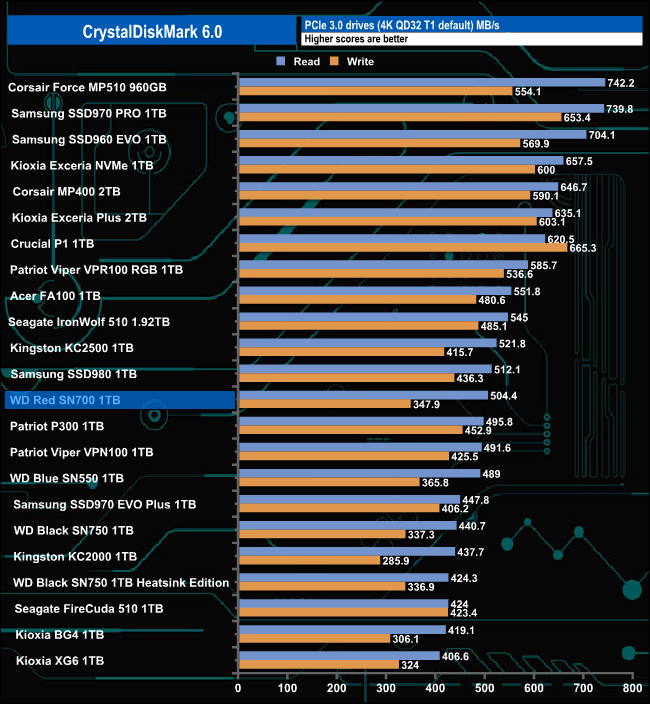
The WD Red SN700 sits in a mid-table position in our results chart for CrystalDiskMark's QD32 1 Thread test with a read result of 504.4MB/s and a write figure of 347.9MB/s. Looking at the two benchmark result screens we can see that the in-house WD controller isn't bothered about what type of data it is being asked to handle.
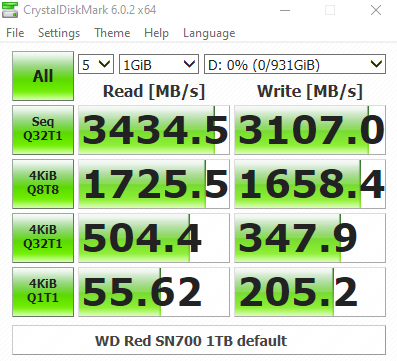
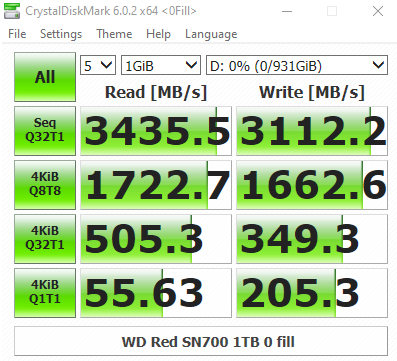
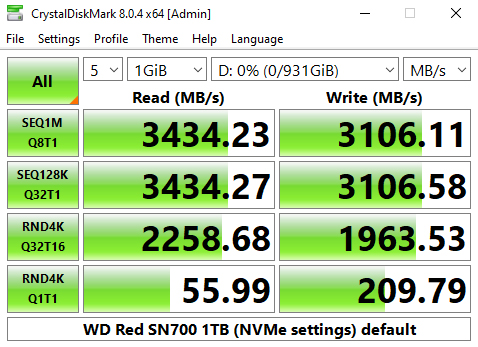
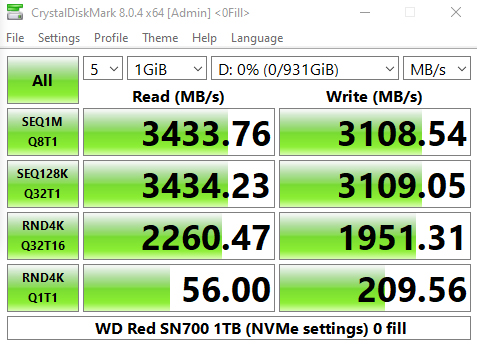
Looking at the CrystalDiskMark results screens we could confirm the official Sequential figures of 3,430MB/s for reads and 3,000MB/s for writes with a best-tested read score of 3,435MB/s with writes at 3,112MB/s.
CrystalDiskMark 8
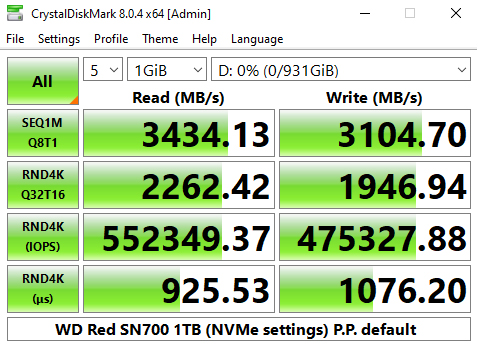
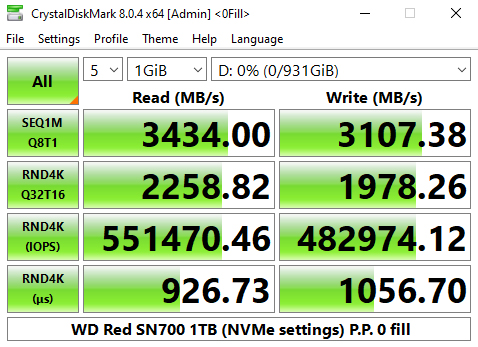
CrystalDiskMark 8 – Peak Performance Profile
CrystalDiskMark 8 – Real World Profile
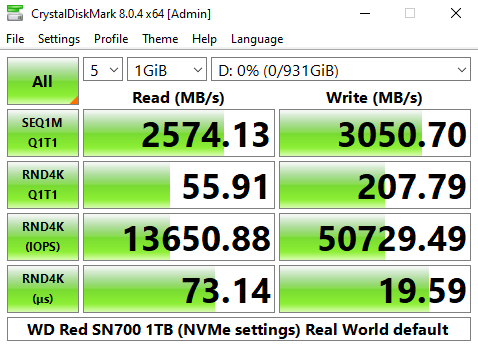
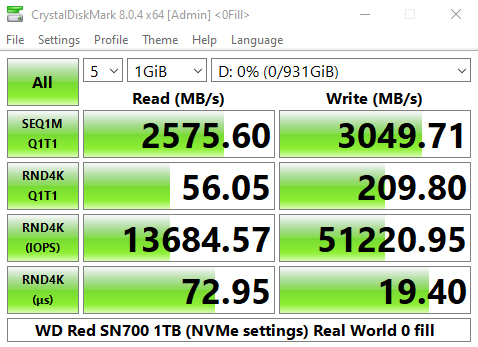
CrystalDiskMark 8 comes with a couple of interesting ready-made testing profiles as well as a dedicated NVMe setting. The best tested Sequential figure for reads, 3,434.23MB/s once again confirms the official rating, as does the best write result of 3,108.54MB/s.
The best tested random 4K read figure in CDM8 for the drive of 552,349 IOPS confirms the official maximum of 515,000 IOPS. The peak write result of 482,974 IOPS is short of the official maximum write rating of 560,000 IOPS.