

We've been waiting quite a while to find out what Samsung had in mind to replace the hugely popular SSD 960 series, after all, it was launched back in 2016 – which seems like an eternity given how fast the NVMe market has been moving. Well, the wait is over as the new drives are here, and today we assess the 2TB 970 EVO.
The new SSD 970 series uses the latest Samsung 64-layer TLC V-NAND rather than the 48-layer used by the previous generation SSD960 series. Along with the new NAND, the new drives get a new controller called Phoenix, which replaces the Polaris controller of the SSD960. Samsung has kept details of the new controller pretty close to its chest but what is known is that it uses five cores (one of which is dedicated to communication duties between the controller and the host system) and has 8 NAND channels. With the launch of the SSD970 series Samsung has also introduced the 3.0 version of their NVMe driver.
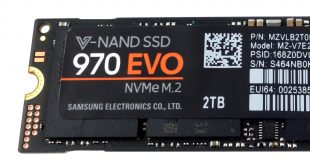
The 970 EVO comes in a range of four capacities; 250GB, 500GB, 1TB and the flagship 2TB drive which Samsung kindly supplied for review. All the drives are built on a single sided M.2 format, and to enable the 2TB drive to be single sided it uses the 512Gb die version of the 64-layer NAND, while the rest of the range uses 256Gb die NAND.
Official performance figures for the 970 EVO are pretty impressive. Sequential read/write figures for the 2TB are drive are up 3,500MB/s and 2,500MB/s respectively. Incidentally the 1TB drive has the same write figure, while the 500GB drive is quoted as up to 2,300MB/s and 250GB entry model is 1,500MB/s. All three have the same 3,400MB/s read rating.
Random read/write performance, at a queue depth of 1 with a single thread, is up to 15,000 IOPS and 50,000 IOPS across the range. However, up the number of threads to 4 with a QD of 32 and the drives separate out. The 2TB and 1TB drives are rated at up to 500,000 IOPS reads, but with writes at up to 480,000 IOPS for the 2TB drive and 450,000 IOPS for the 1TB drive. The 500GB drive has the same write rating as the 1TB drive but with a 370,000 IOPS read figure. The 250GB drive has read/write figures of 200,000 IOPS and 350,000 IOPS respectively.
With the new NAND, Samsung has upped the warranty length for the drives, rising from the 3 years of the previous drives to 5 years with the 2TB drive having an endurance TBW rating of 1,200TB.
Physical Specifications:
- Usable Capacities: 2TB
- NAND Components: Samsung 64-layer 512Gb TLC V-NAND
- NAND Controller: Samsung Phoenix
- Cache: 2GB LPDDR4
- Interface: PCIe Gen 3.0 x4, NVMe 1.3
- Form Factor: M.2 2280
- Dimensions: 80.15 x 22.15 x 2.38mm
- Drive Weight: 8g
Firmware Version: 1B2QEXE7
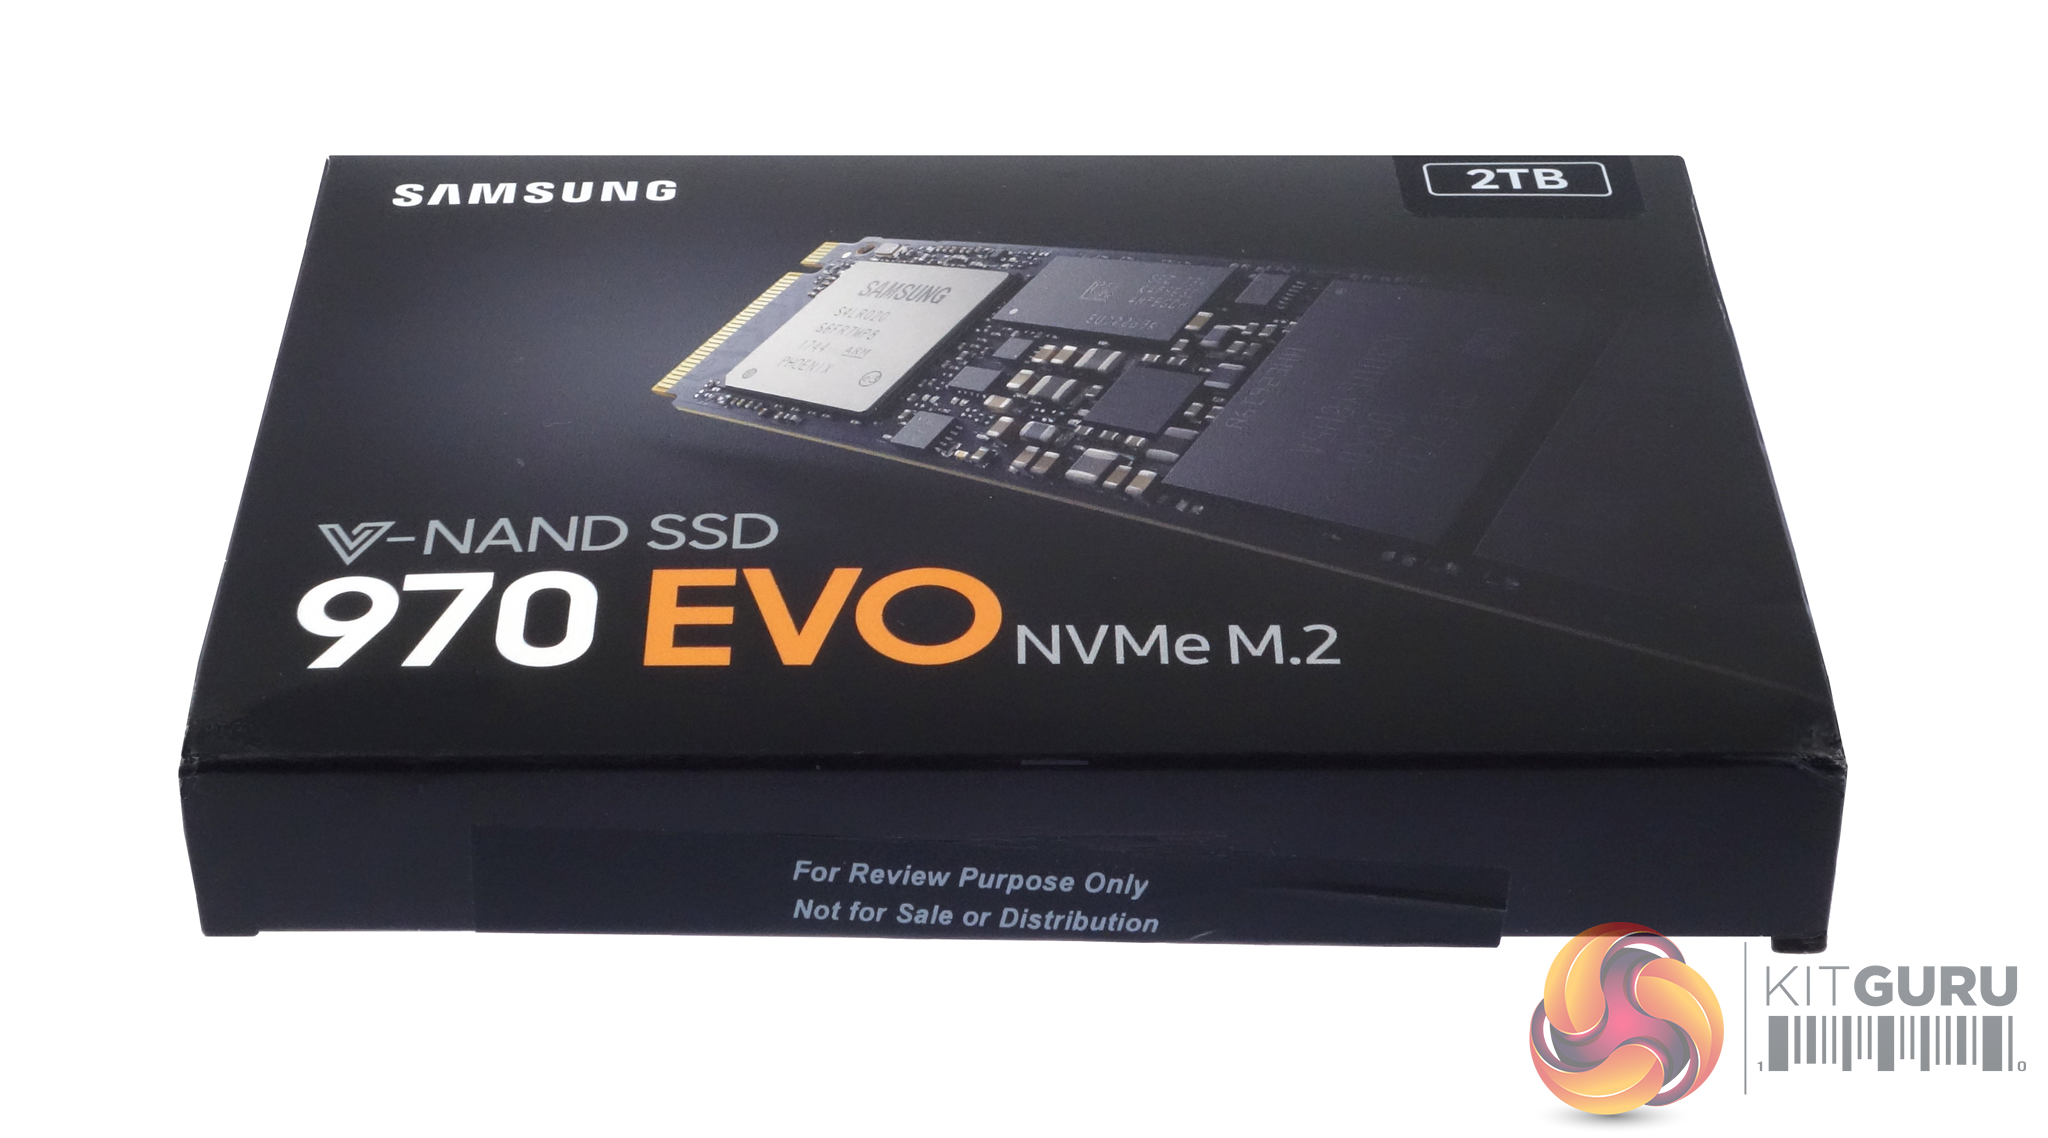
Samsung's 970 EVO comes in a compact black box with a large image of the drive on the front. On the top right hand side of the box we find a sticker displaying the drives capacity.
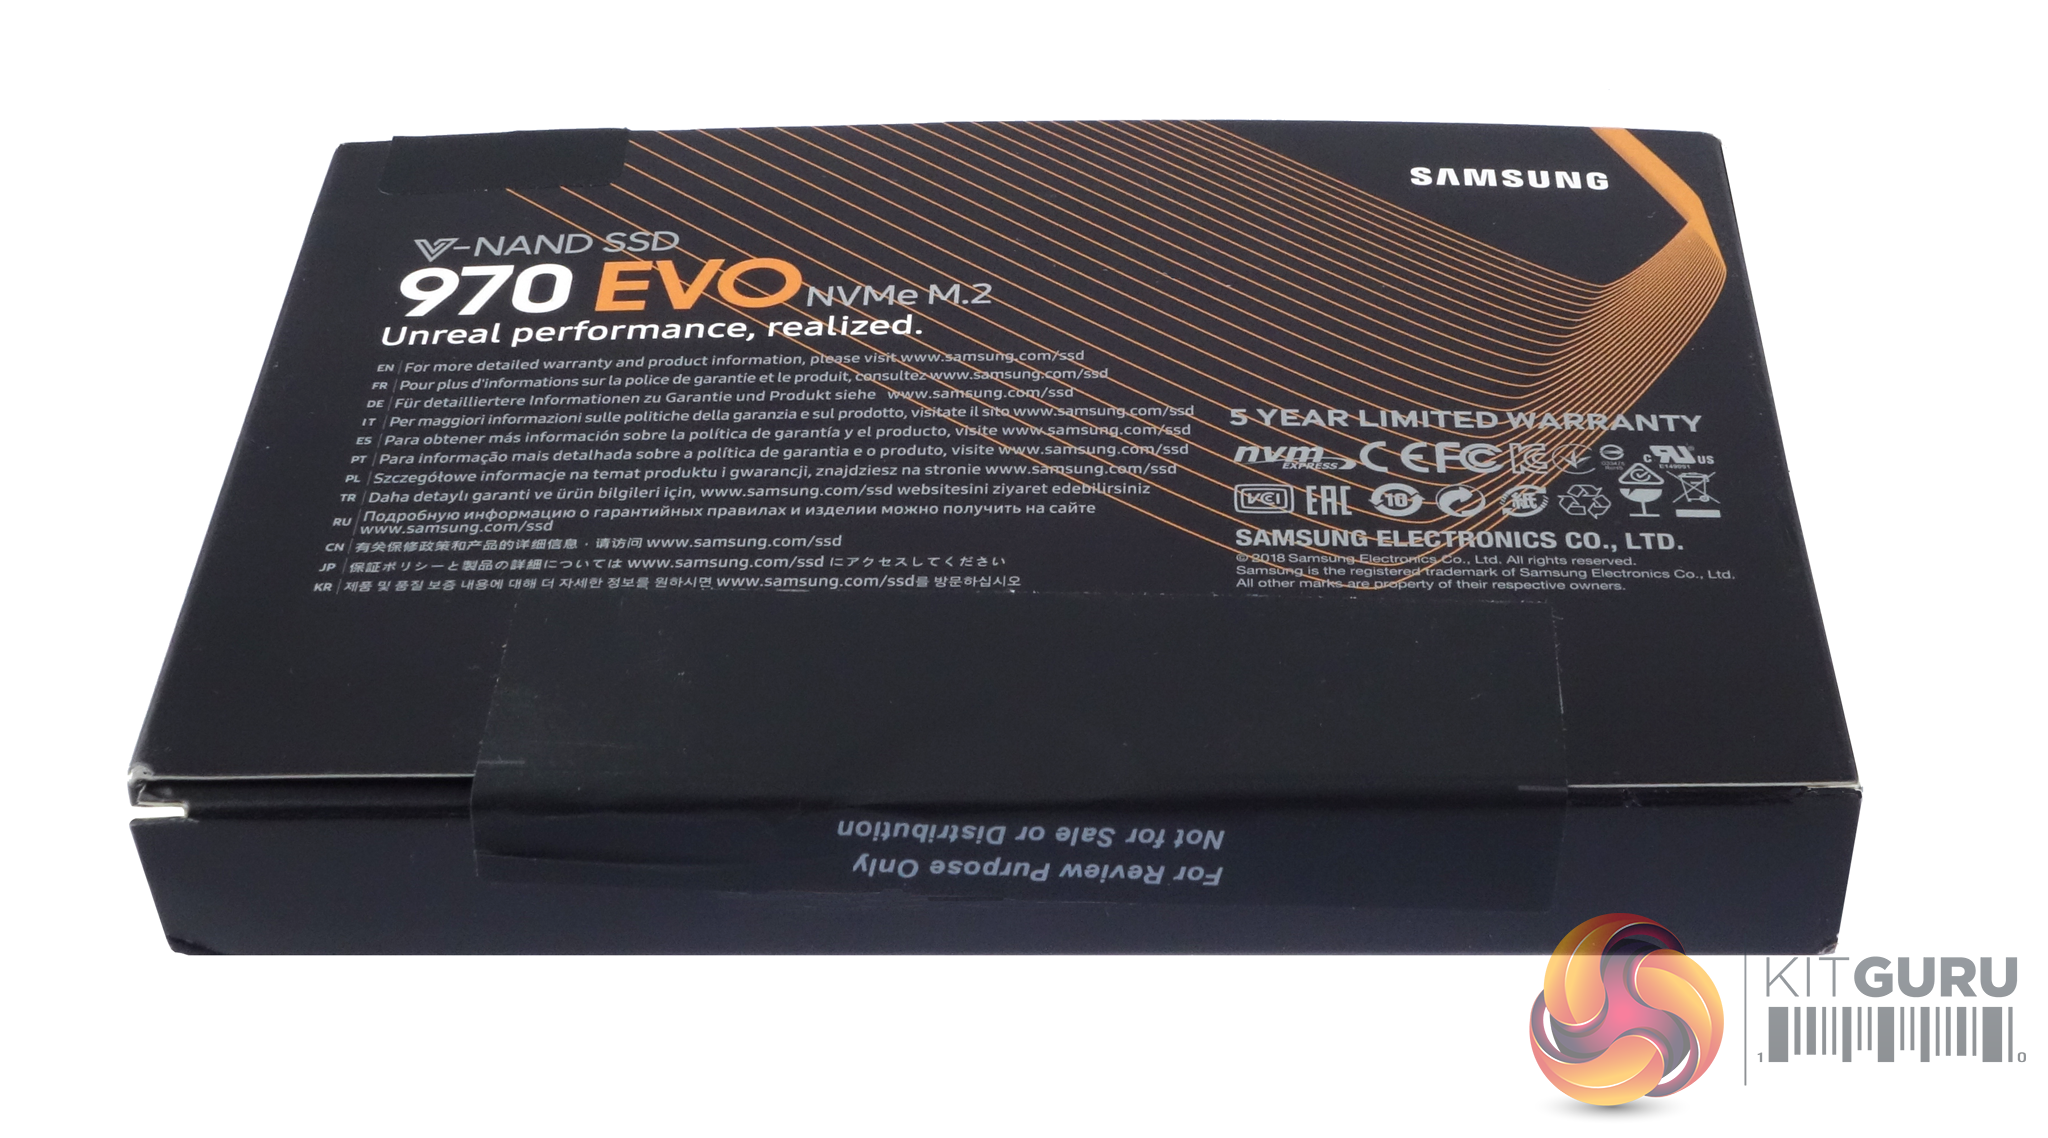
The rear of the box has a multilingual information panel giving the web address for more detailed warranty information. To the right of this is a reminder that the drive has a 5 year limited warranty.
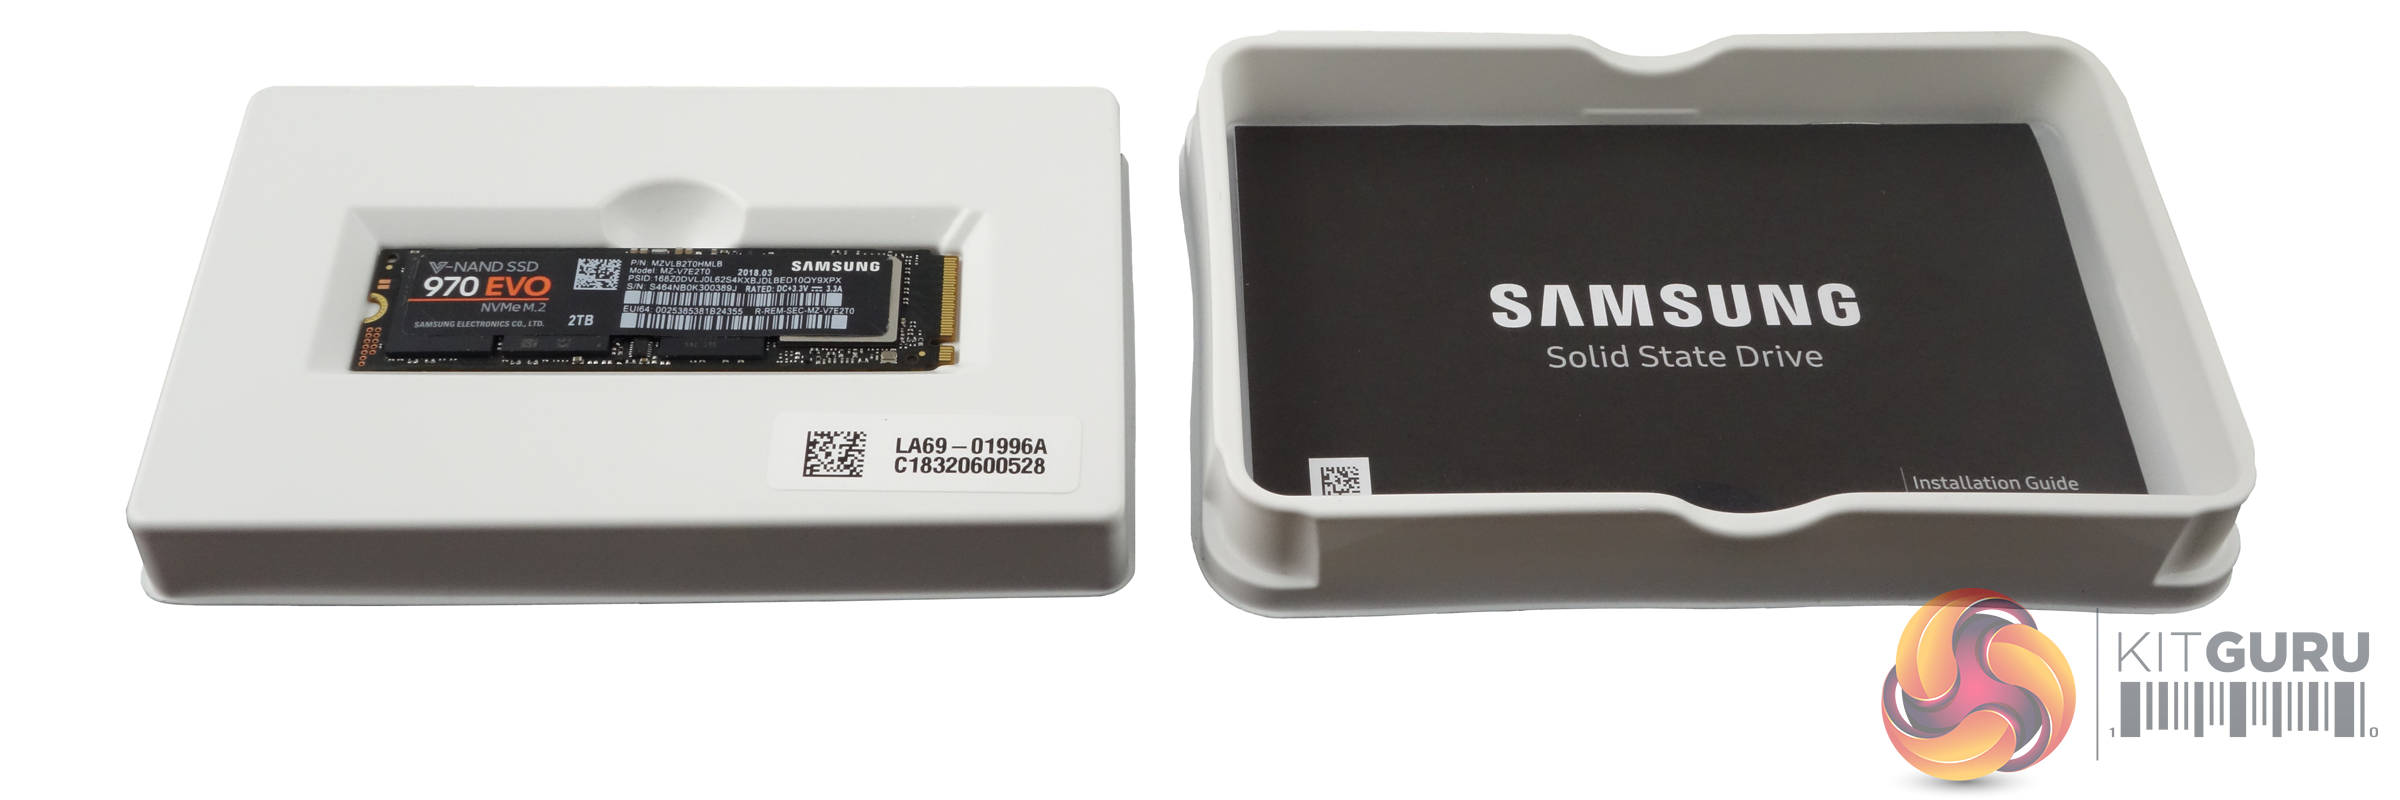
The drive itself comes in a plastic shell for extra protection. This outer shell fits into another piece of plastic which is home to the installation/warranty guide.
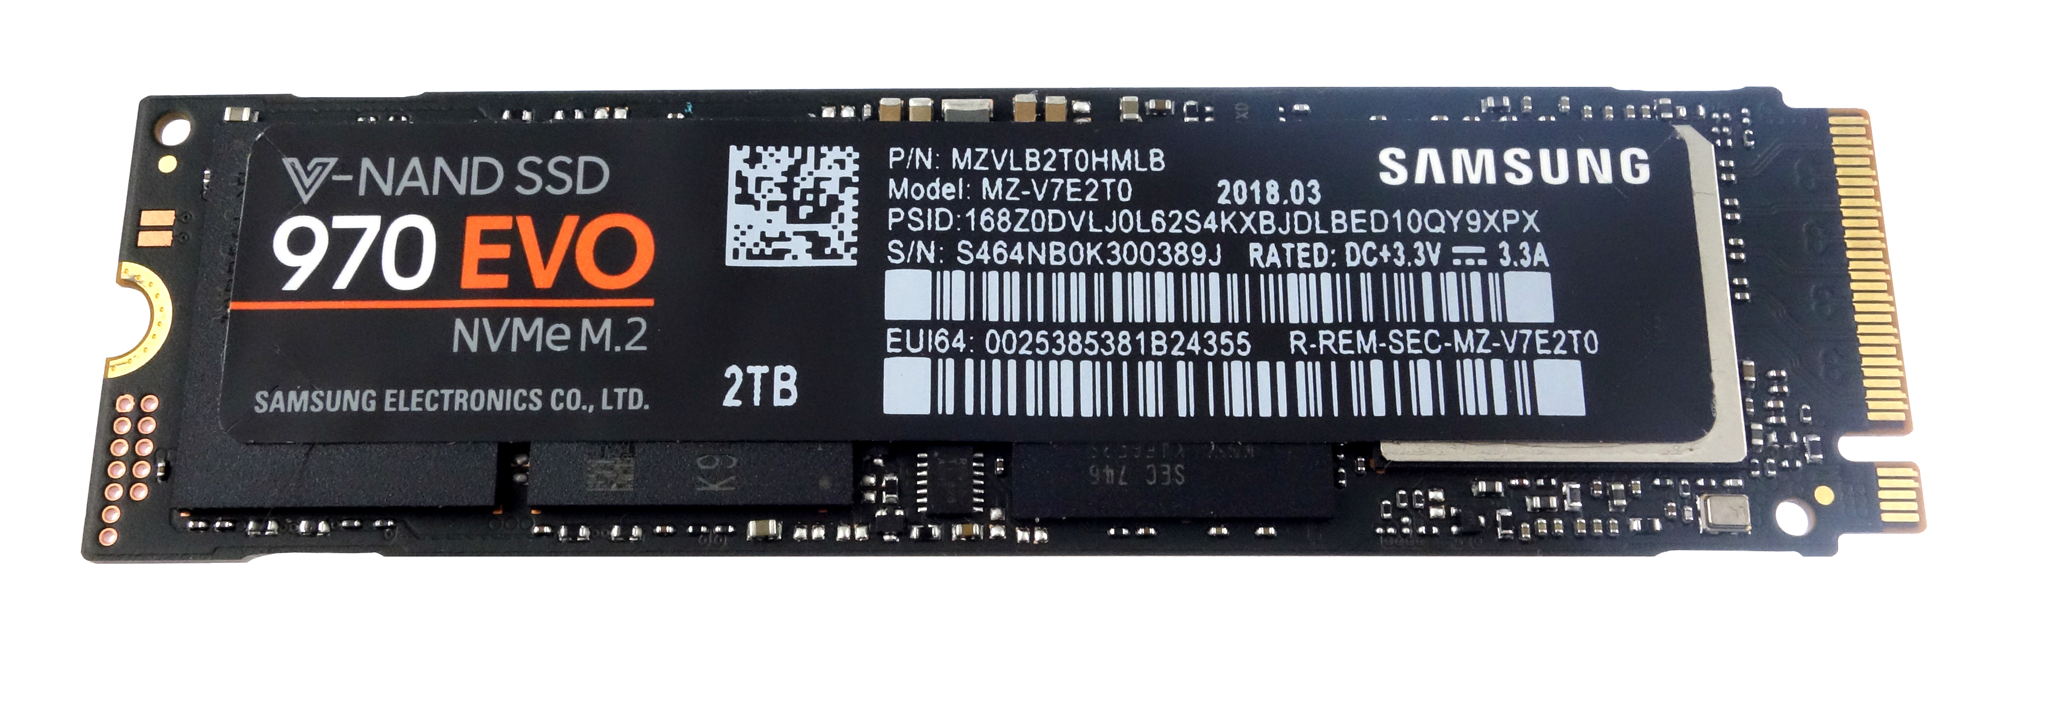
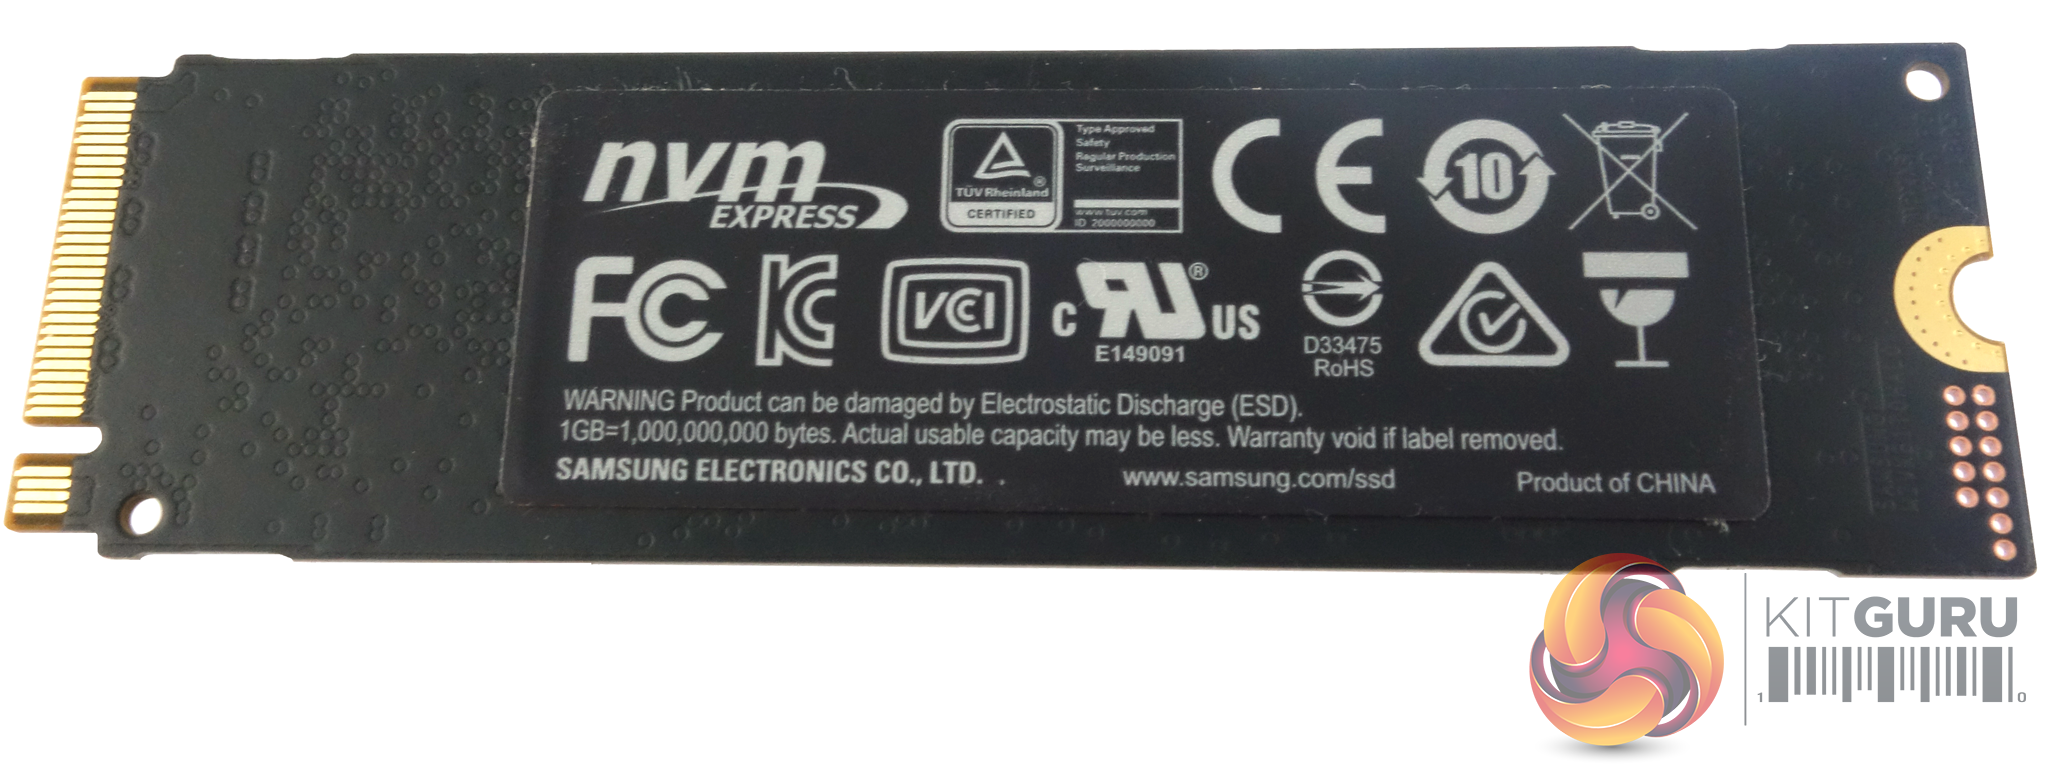
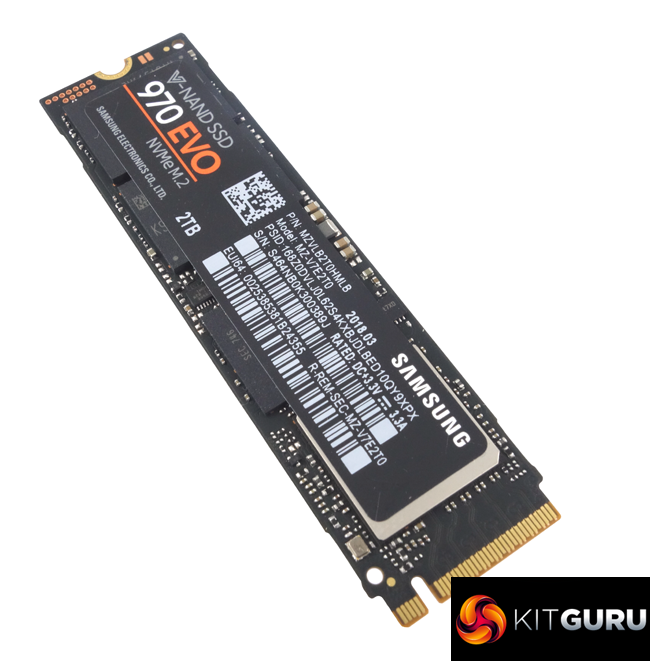
The 970 EVO is built on a single sided M.2 2280 format PCB. The sticker on the rear of the drive has a built in copper layer to aid heat dissipation.
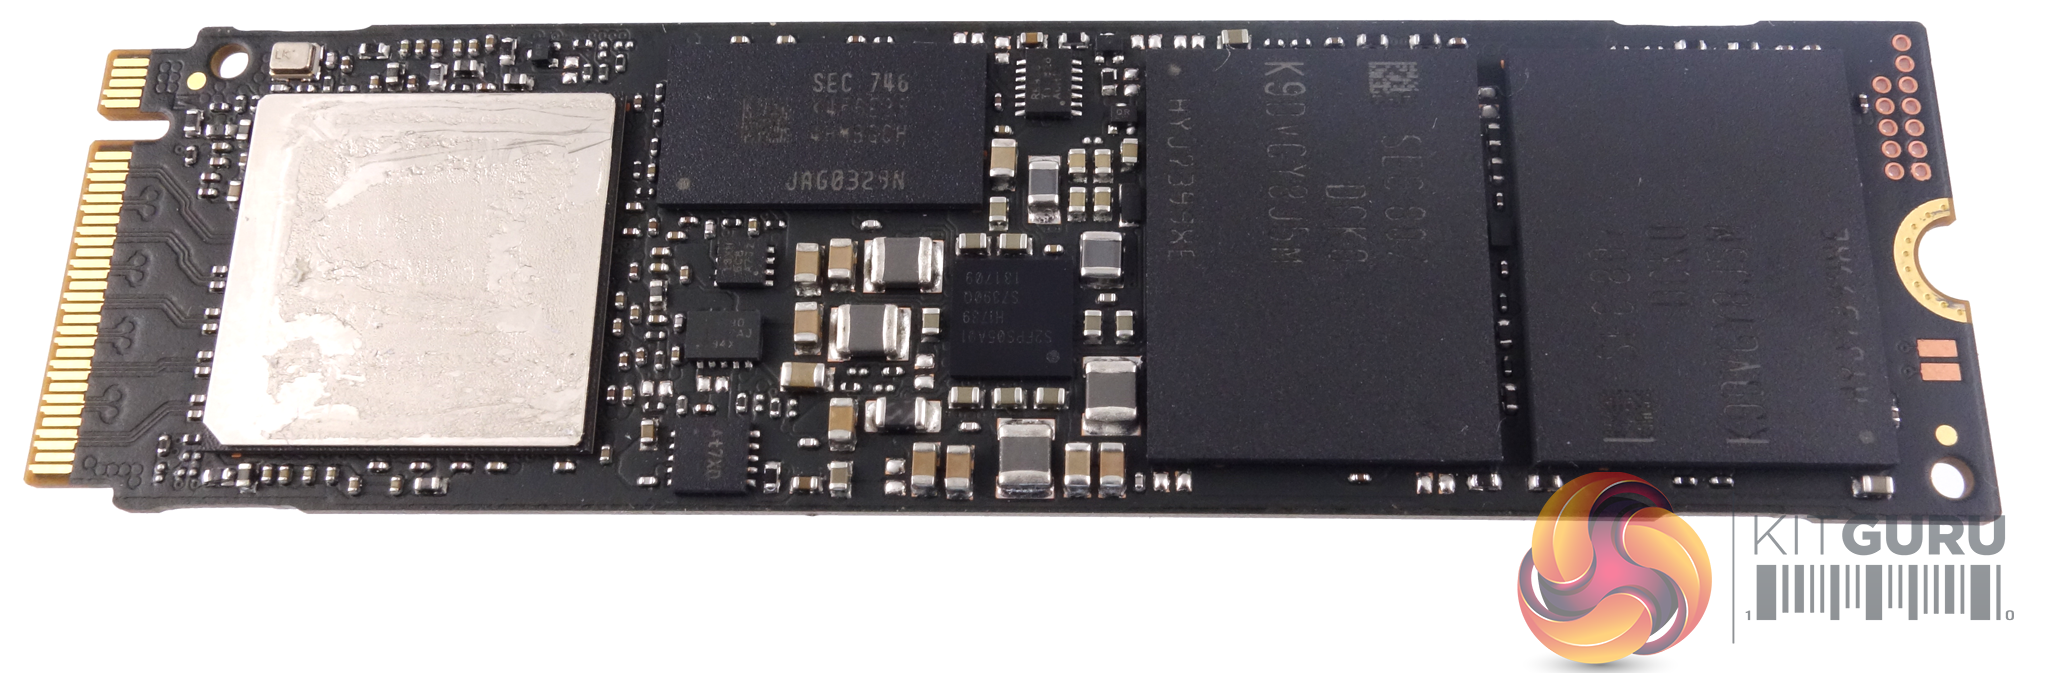
At one end of the PCB sits the Phoenix controller, while sitting at the other end of the PCB are two 64-layer 512GB V-NAND TLC NAND packages. In between the NAND and the controller there is a 2GB LPDDR4 DRAM IC to take care of caching duties.
Note: if you cannot see the above gallery, you may need to disable your ad blocker as they can interfere with our display code.
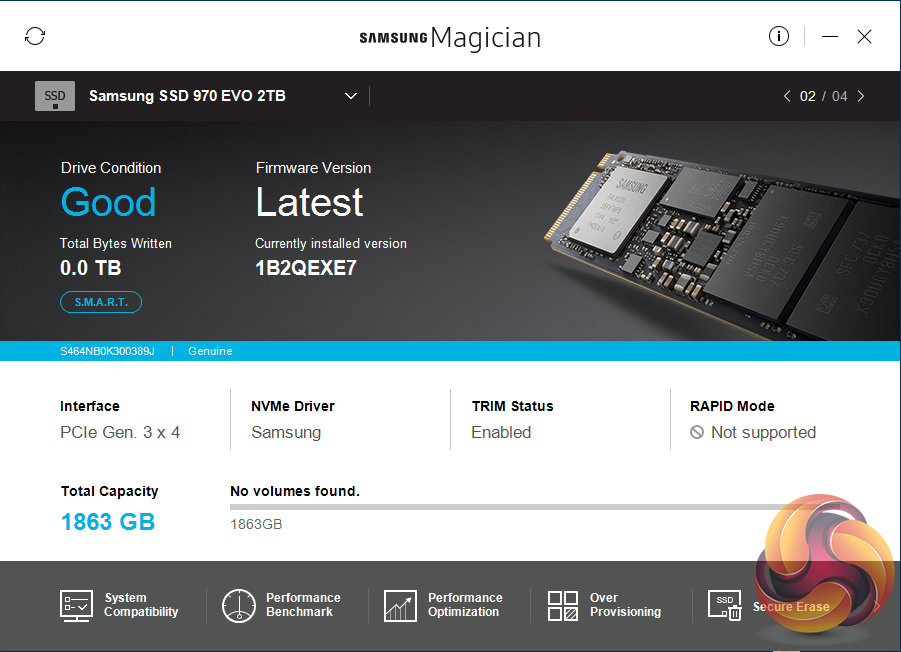
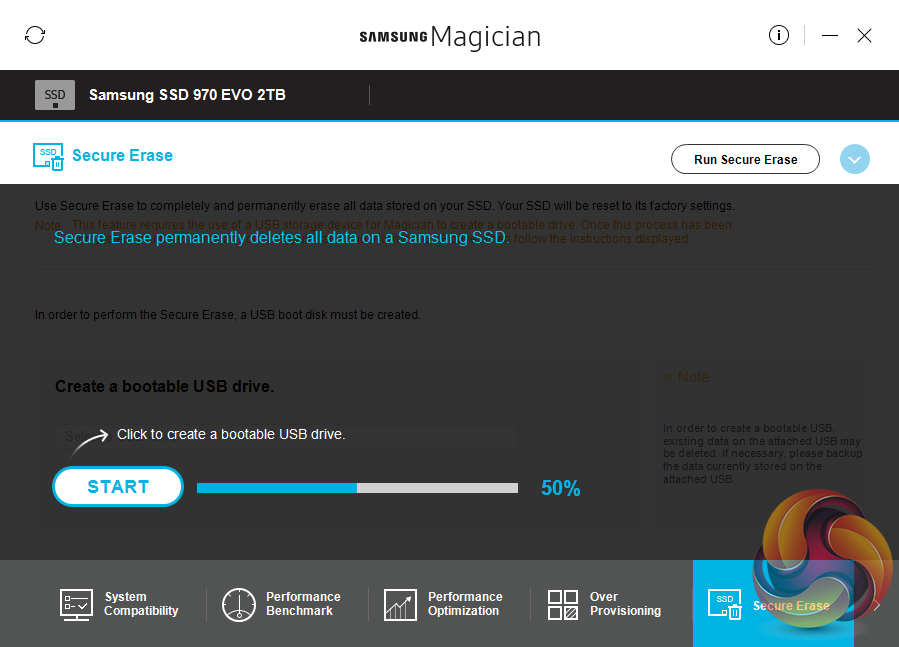
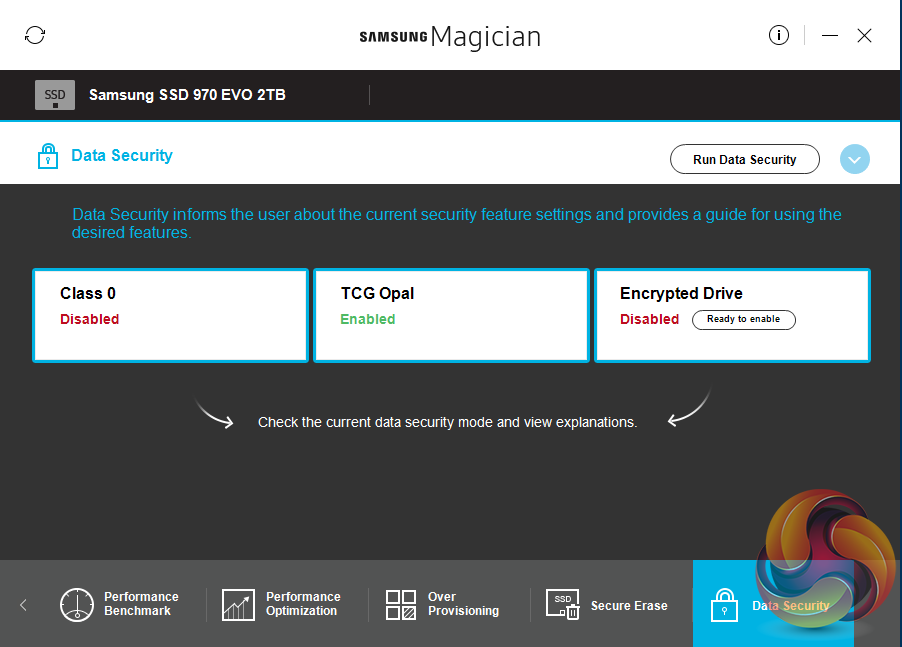
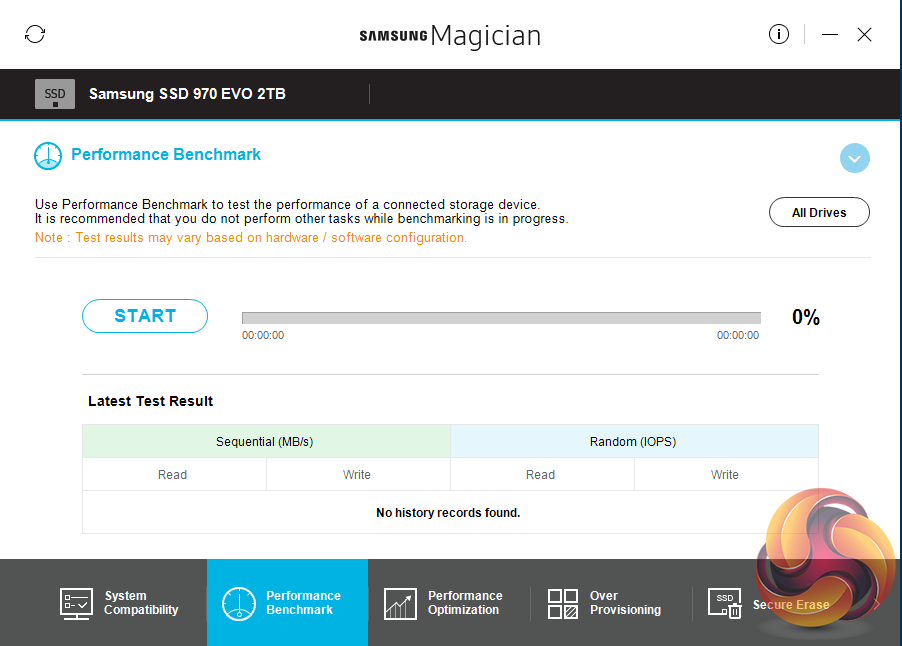
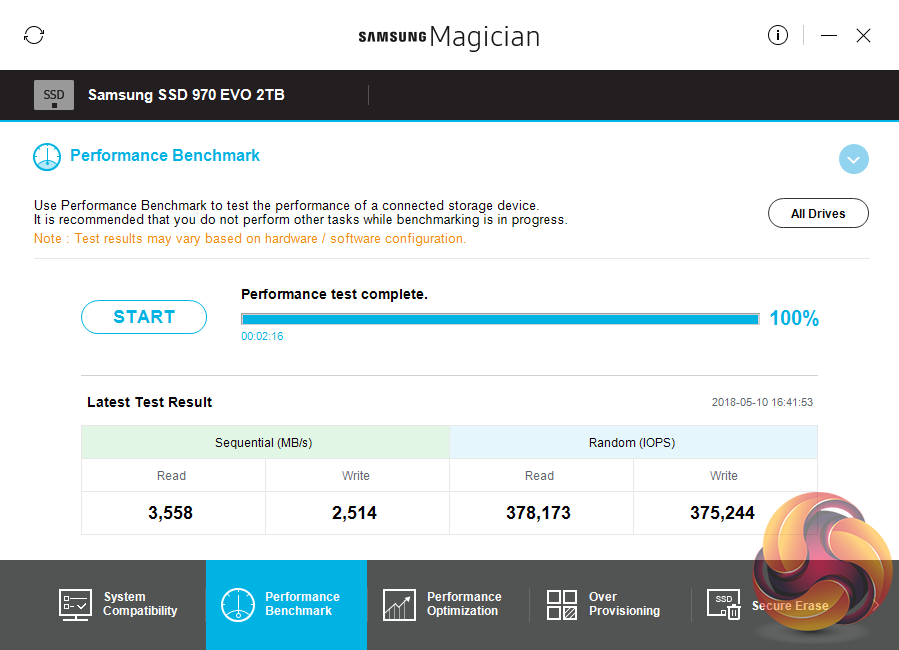
Samsung's SSD management utility goes by the name of Magician and is downloaded from Samsung's website. The latest v5.2 version brings support for the SSD 970 series. The latest version sees a number of improvements over the v5.1, including an alarm function for firmware or Magician updates, a USB boot solution for NVMe devices for using Secure Erase, updated performance benchmark and a text drag and copy function for the system compatibility page.
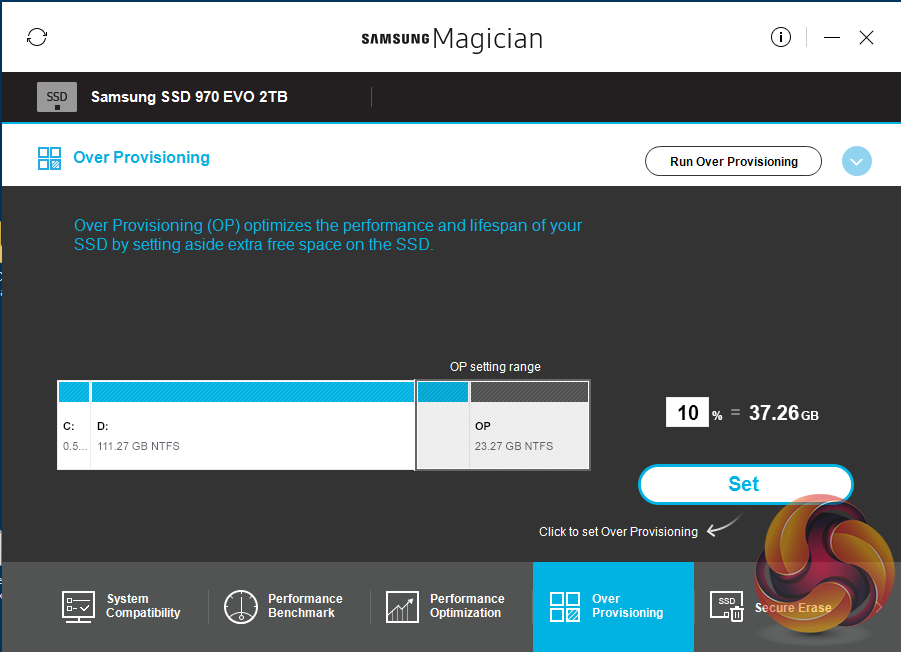
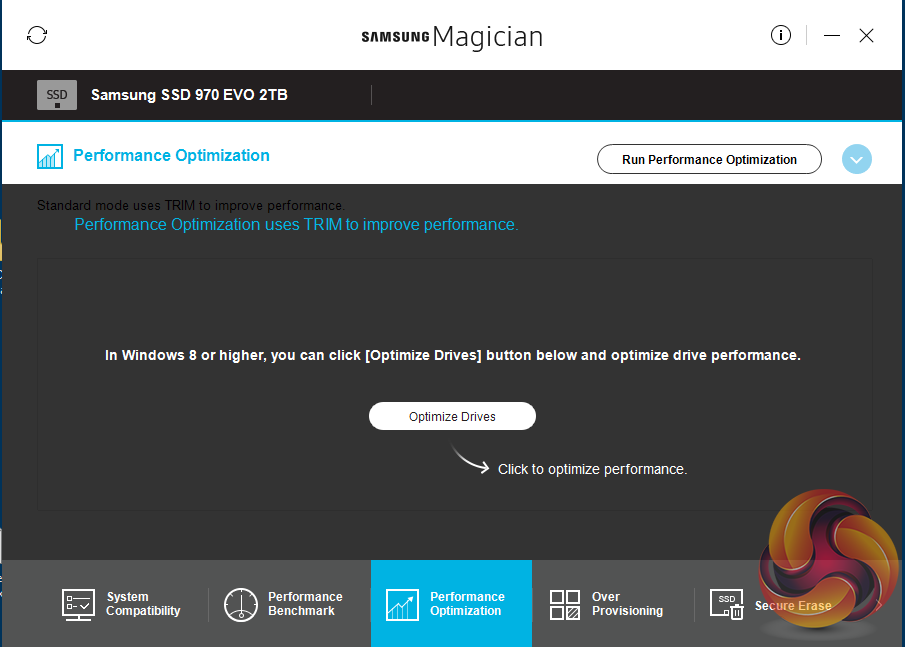
Magician allows you to do most maintenance jobs you may need to do with a SSD; updating firmware, optimise performance, adjust the Over Provisioning, enable data security (the drive supports AES 256-bit full disk encryption, TCG/Opal V2.0, and Encrypted Drive -IEEE1667 (MS eDrive ) ) and securely erase the drive. Magician also features a built in benchmark tool.
The one thing missing from Magician is any form of integrated data migration tool but you can download a separate data migration tool from Samsung's website.
For testing, the drives are all wiped and reset to factory settings by HDDerase V4. We try to use free or easily available programs and some real world testing so you can compare our findings against your own system. This is a good way to measure potential upgrade benefits.
Main system:
Intel Core i7-7700K with 16GB of DDR4-3200 RAM, Sapphire R9 390 Nitro and an Asus Prime Z270-A motherboard.
Other drives:
- Corsair Force MP500 480GB
- Intel SSD760p 512GB
- Kingston A1000 480GB
- Plextor M9Pe(Y) 512GB
- Plextor M8PeG 512GB
- PNY CS2030 240GB
- Samsung SSD960 PRO 2TB
- Samsung SSD960 EVO 1TB
- Toshiba OCZ RD400 512GB
- Western Digital Black NVMe 1TB
- Western Digital Black PCIe 512GB
Software:
- Atto Disk Benchmark.
- CrystalMark 6.0.
- AS SSD.
- IOMeter.
- Futuremark PC Mark 8
All our results were achieved by running each test five times with every configuration, to ensure no anomalous results are presented. TRIM is confirmed as running by typing ‘fsutil behavior query disabledeletenotify' into the command line. A response of ‘isabledeletenotify =0' confirms TRIM is active.
CrystalDiskMark is a useful benchmark to measure theoretical performance levels of hard drives and SSD’s. We are using V6.0.
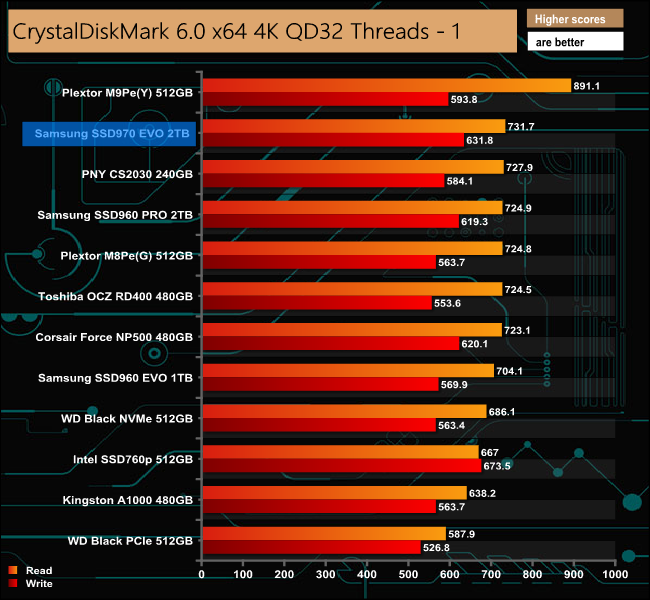
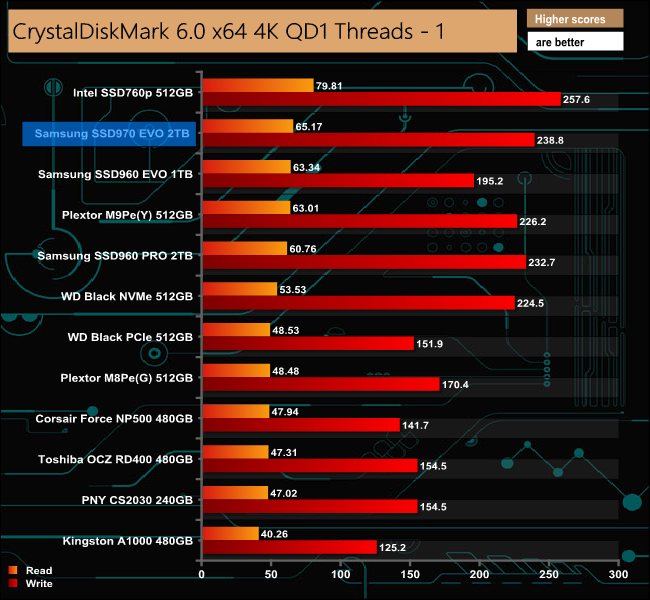
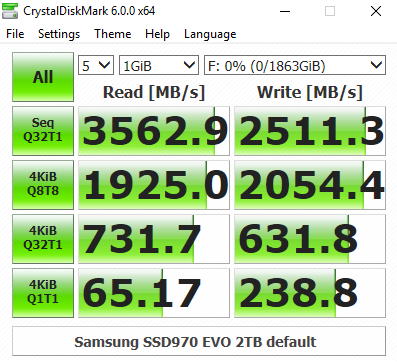
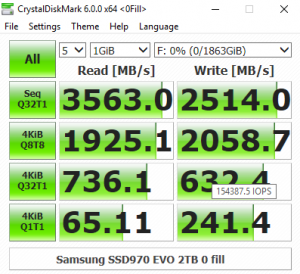
Samsung's SSD 970 EVO is a strong performer in the CrystalDiskMark benchmark, especially when it comes to 4K writes – both at shallow and deeper queue depths. Comparing the two benchmark result screens (default config vs 0 fill) it appears that the new Phoenix controller isn't too fussed about what type of data it's asked to deal with.
The ATTO Disk Benchmark performance measurement tool is compatible with Microsoft Windows. Measure your storage systems performance with various transfer sizes and test lengths for reads and writes. Several options are available to customise your performance measurement including queue depth, overlapped I/O and even a comparison mode with the option to run continuously.
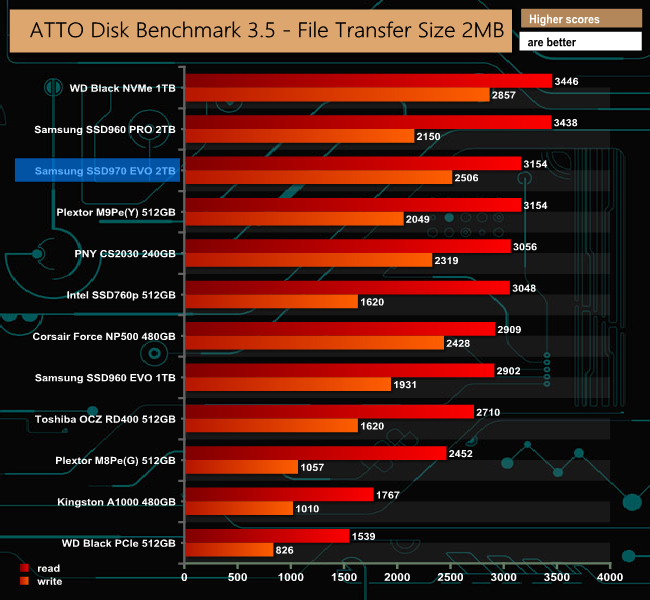
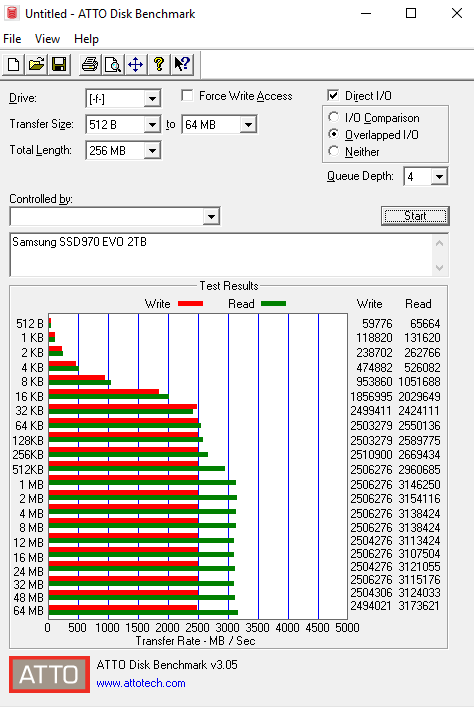
Samsung's official sequential read/write figures for the 2TB SSD are up to 3,500MB/s and 2,500MB/s respectively. When tested with the ATTO benchmark our review drive came up a little short of the maximum read figure at 3,154MB/s, while the write figure was right on the money with 2,506MB/s.
AS SSD is a great free tool designed just for benching Solid State Drives. It performs an array of sequential read and write tests, as well as random read and write tests with sequential access times over a portion of the drive. AS SSD includes a sub suite of benchmarks with various file pattern algorithms but this is difficult in trying to judge accurate performance figures.
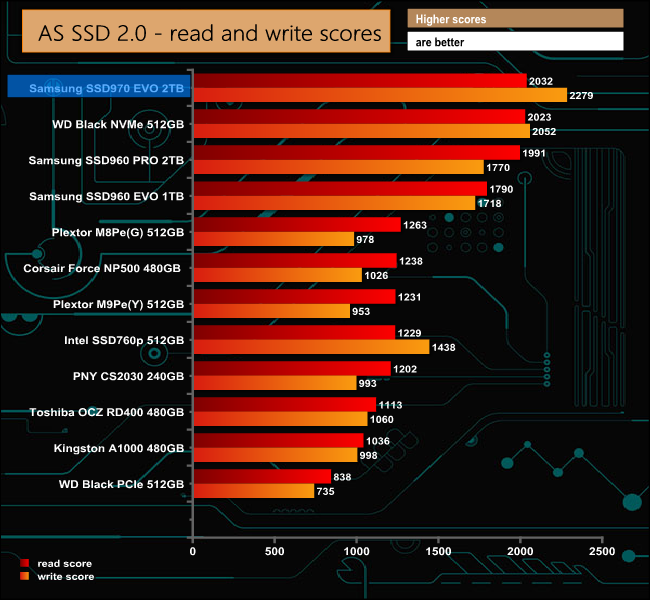
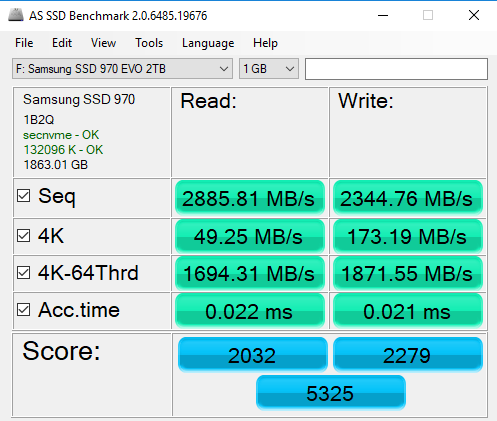
With the AS SSD benchmark, the 970 EVO read score of 2032 just pips WD's Black NVMe drive. However the write score of 2279 is very impressive and the fastest we have seen for a consumer drive to date by quite some way.
IOMeter is another open source synthetic benchmarking tool which is able to simulate the various loads placed on hard drive and solid state drive technology.
We test with 128KB Sequential read and write tests as well as random read and write 4K tests, as shown below. There are many ways to measure the IOPS performance of a Solid State Drive, so our results will sometimes differ from manufacturer’s quoted ratings. We do test all drives in exactly the same way, so the results are directly comparable.
The test setups we use are listed below. Each is run five times.
128KB Sequential Read / Write.
Transfer Request Size: 128KB Span: 8GB Thread(s): 1 Outstanding I/O: 1-32 Test Run: 20 minutes per test
4K Sustained Random Read / Write.
Transfer Request Size: 4KB Span: 80GB Thread(s): 4 Outstanding I/O: 1-32 Test Run: 20 minutes per test
4K Random 70/30 mix Read/Write.
Transfer Request Size: 4KB Span: 80GB Reads: 70% Writes: 30% Thread(s): 4 Outstanding I/O: 2 – 32 Test Run: 20 minutes
128KB Sequential Read / Write.
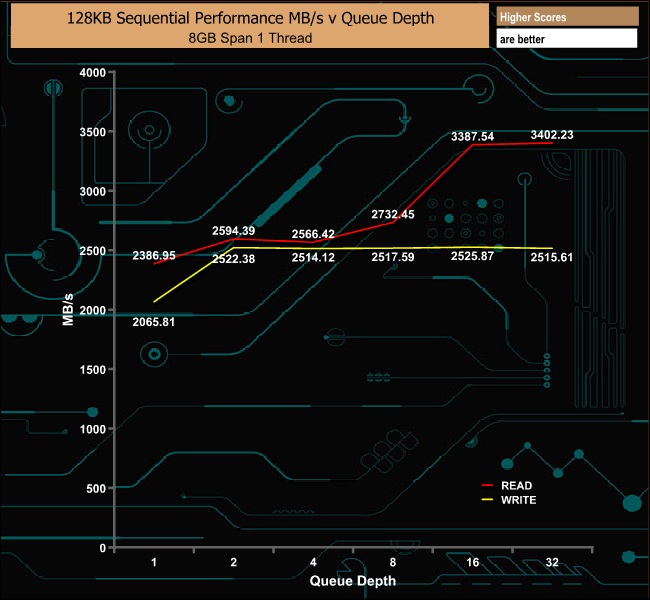
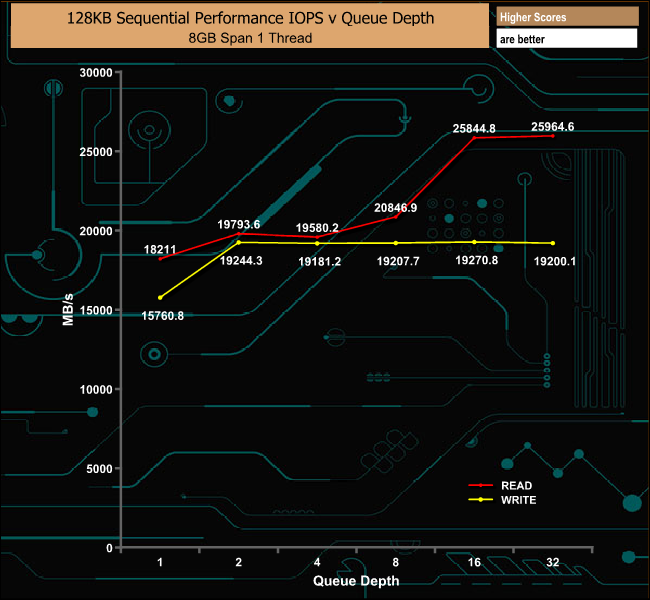
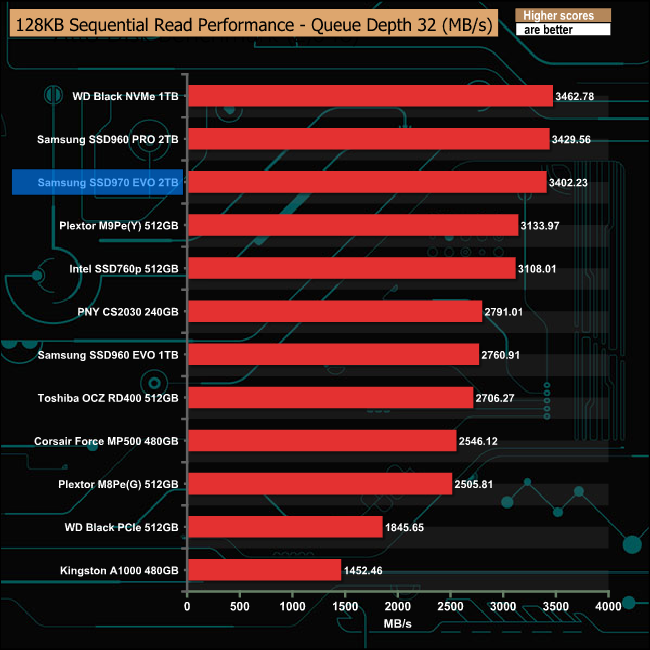
As with the ATTO benchmark, our 128KB Sequential test saw a read result a little shy of the official 3,500MB/s figure – at 3,402MB/s – but our write figure of 2,515MB/s confirms Samsung's official 2,500MB/s figure.
Most desktop operations happen in the 1 – 4 queue depth range, so we've broken out the test results to see how the drive performs at these queue depths in comparison with other drives, as well as a queue depth of 32 – although in the desktop environment you'll seldom if ever see a queue depth that high.
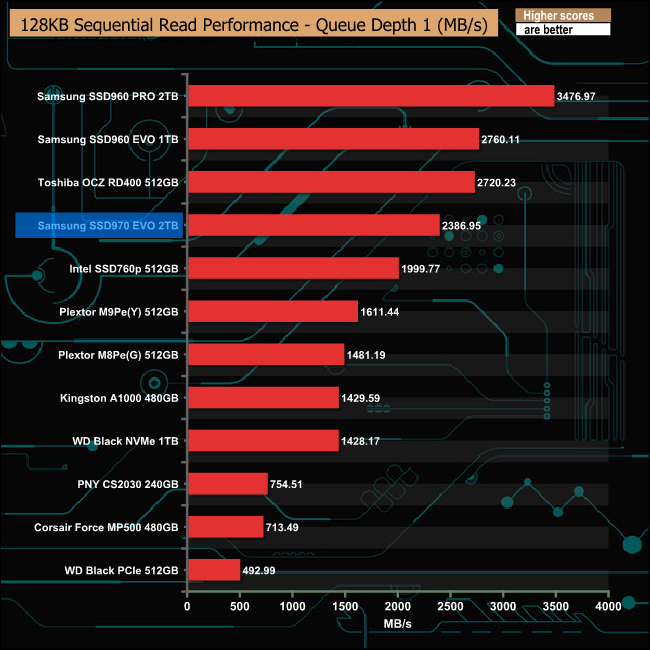
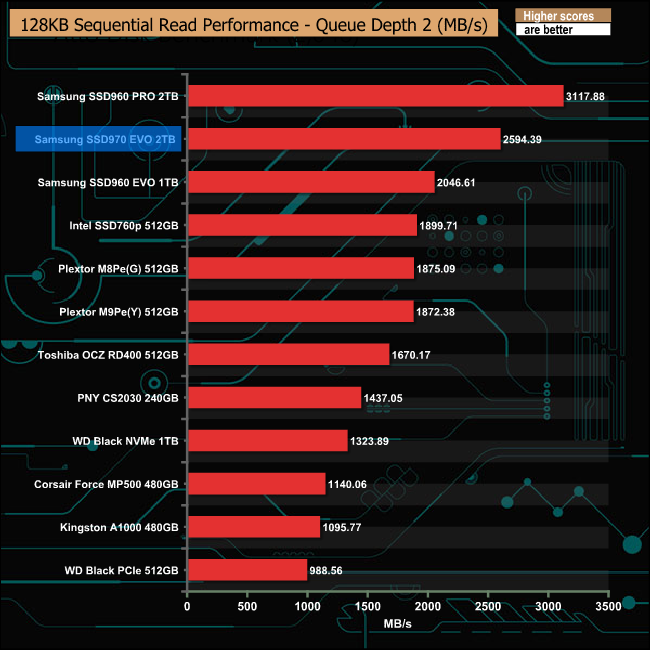
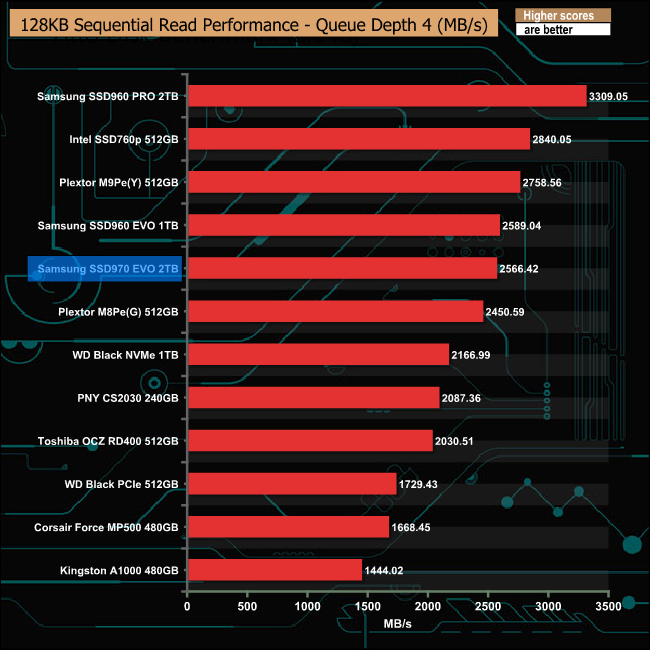
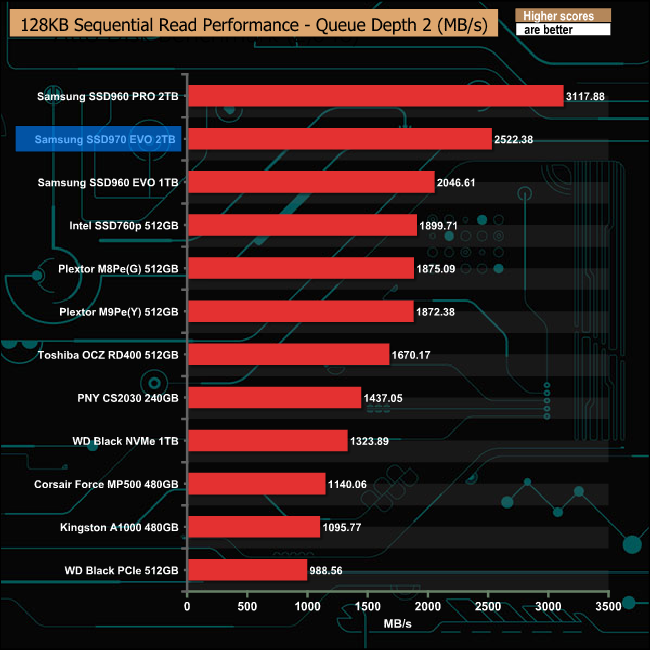
At low queue depths the 970 EVO's best sequential read performance comes at a queue depth of 2, with a figure of 2,594MB/s.
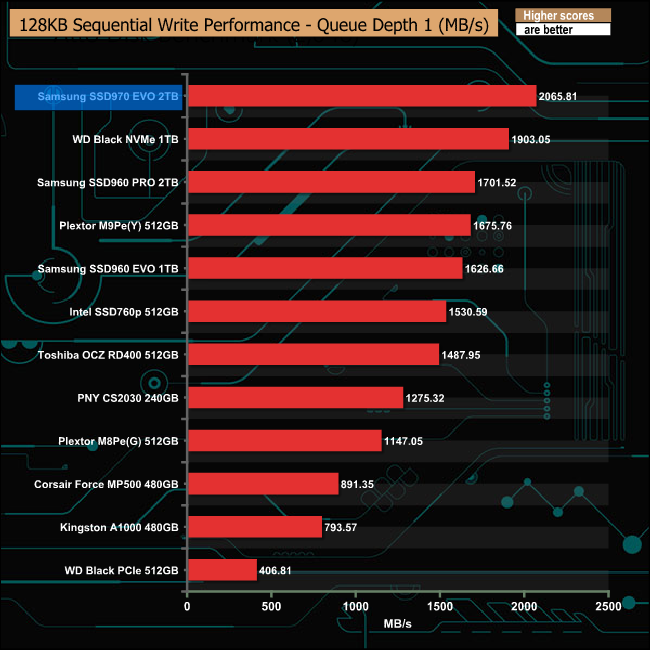
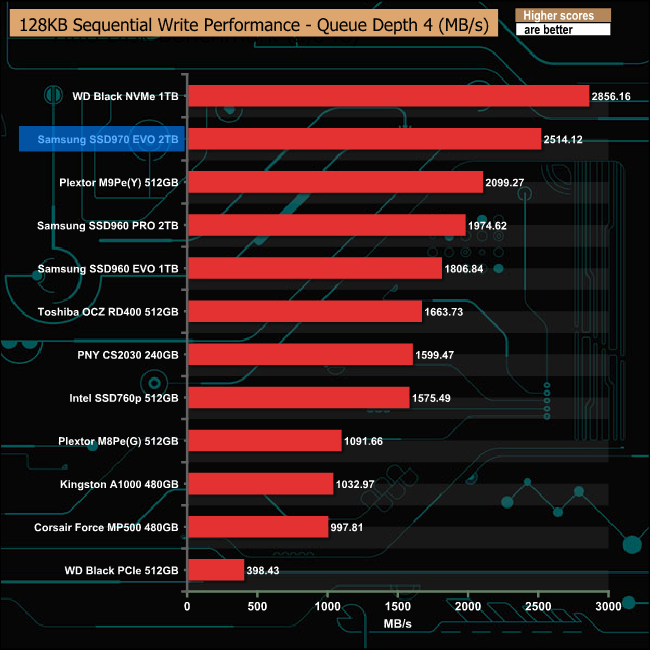
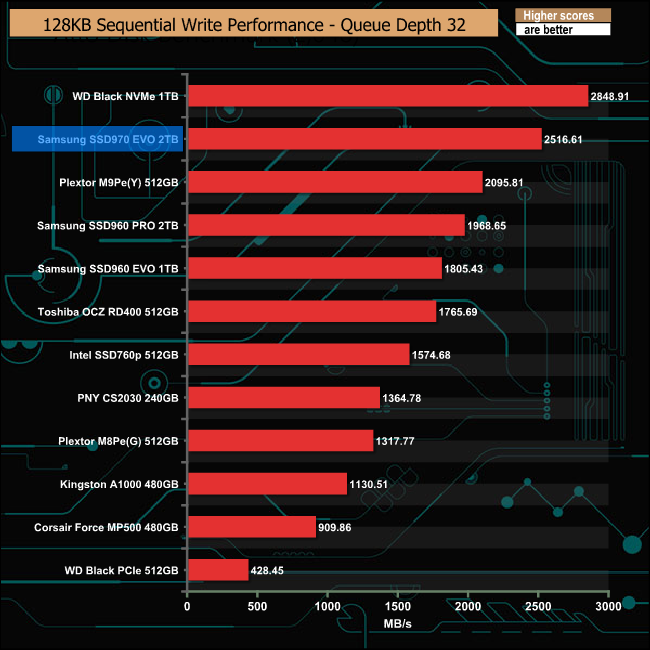
When it comes to sequential writes, the 970 EVO's performance is much more consistent through the lower queue depths than it is when reading.
4K Sustained Random Read.
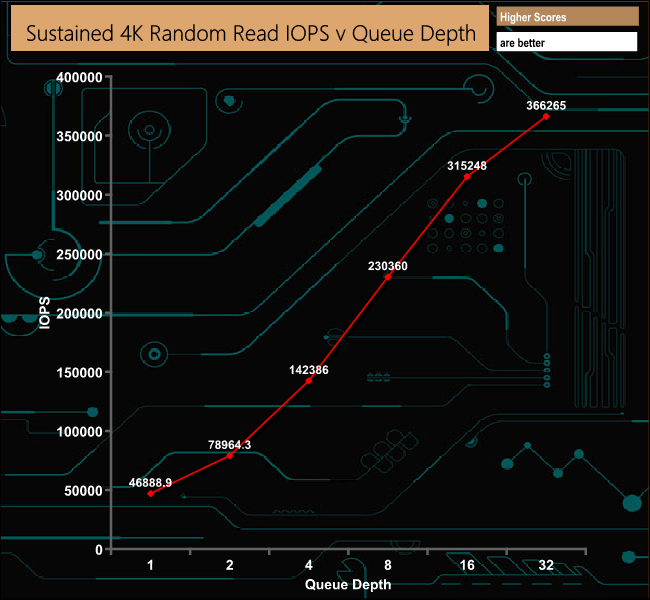
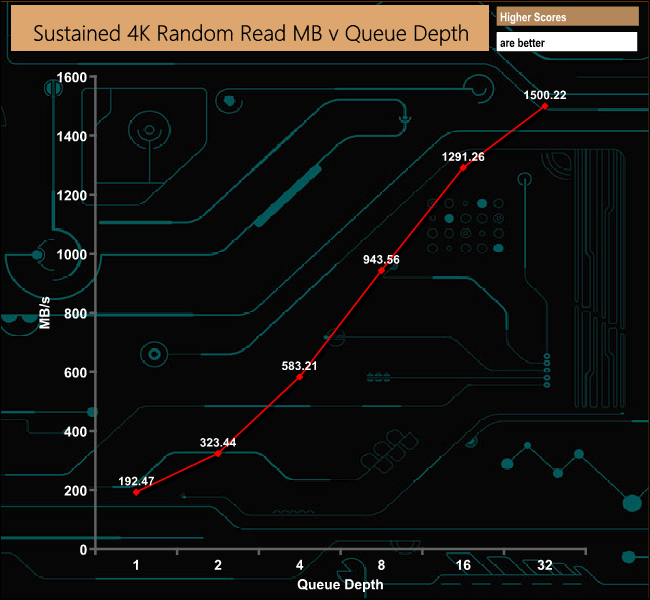
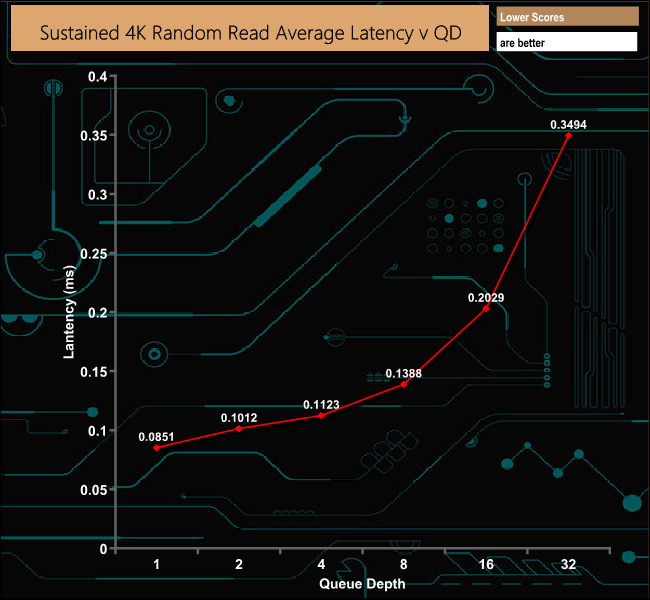
In our 4K random read test the drive fell well short of the maximum official figure of 500,000 IOPS at a QD of 32. However the 366,265 IOPS that the drive produced is the fastest we have seen from a consumer NVMe drive so far.
Most desktop operations happen in the 1 – 4 queue depth range, so we've broken out the test results to see how the drive performs at these queue depths in comparison with other drives, as well as a queue depth of 32 – although in the desktop environment you'll seldom if ever see a queue depth that high.
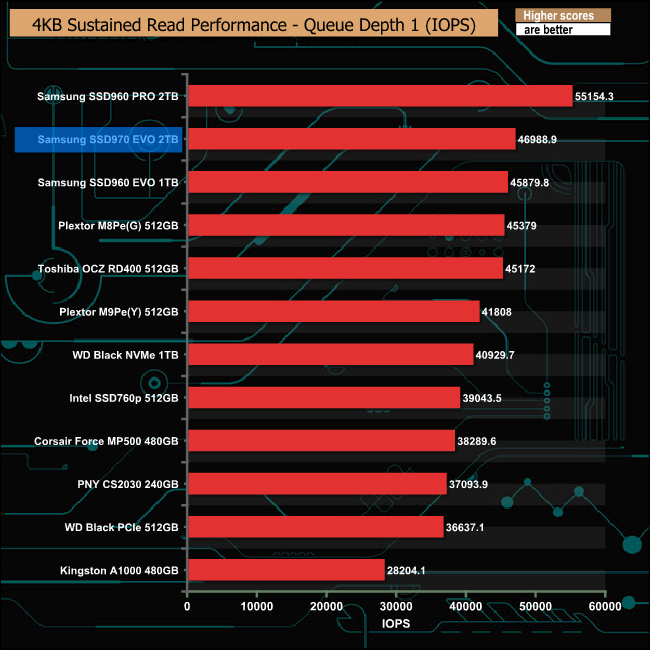
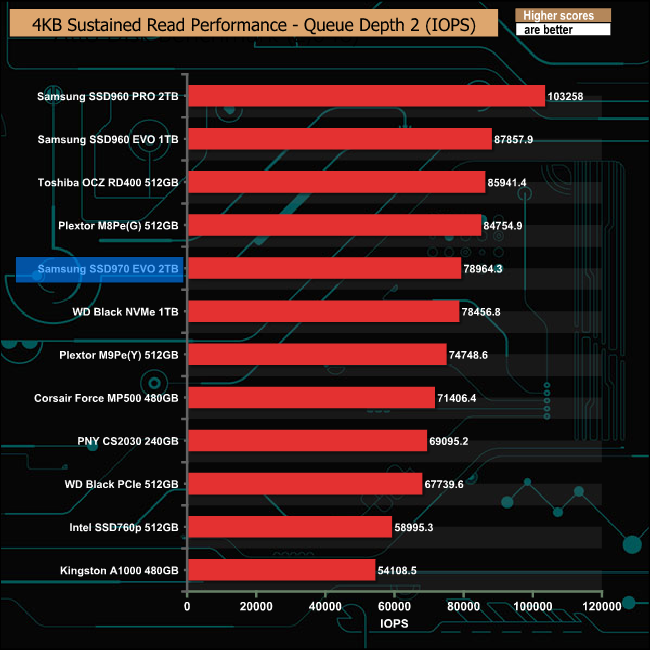
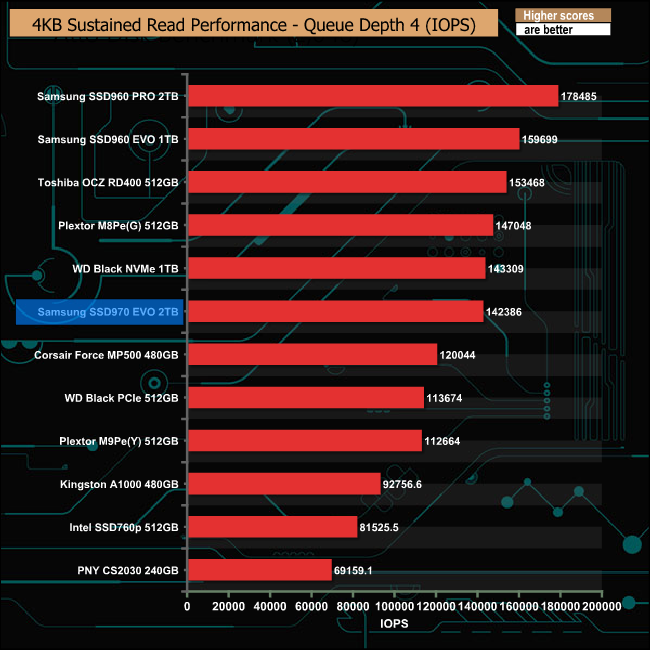
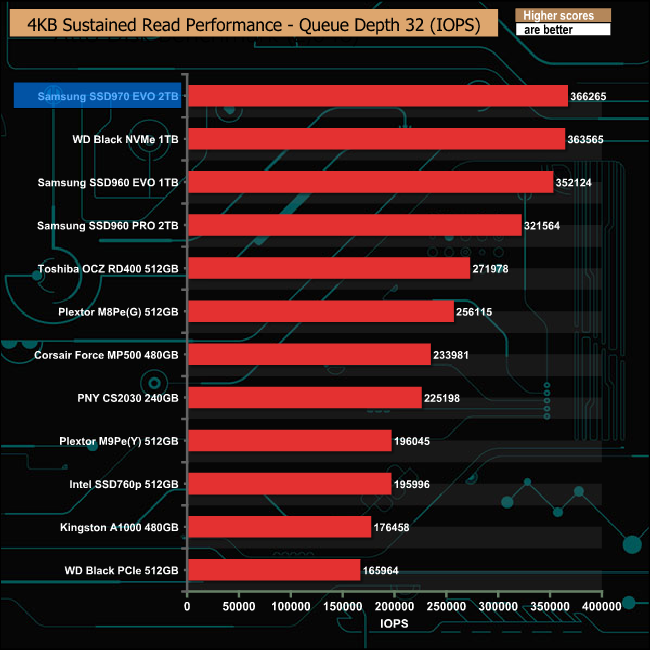
In comparison to other drives we have tested, at lower queue depths the 970 EVO's best read performance comes at the queue depth 1 mark, after which it drops behind a number of other drives. However, when it comes the drive's performance at a queue depth of 32, it is the fastest consumer drive we've tested to date.
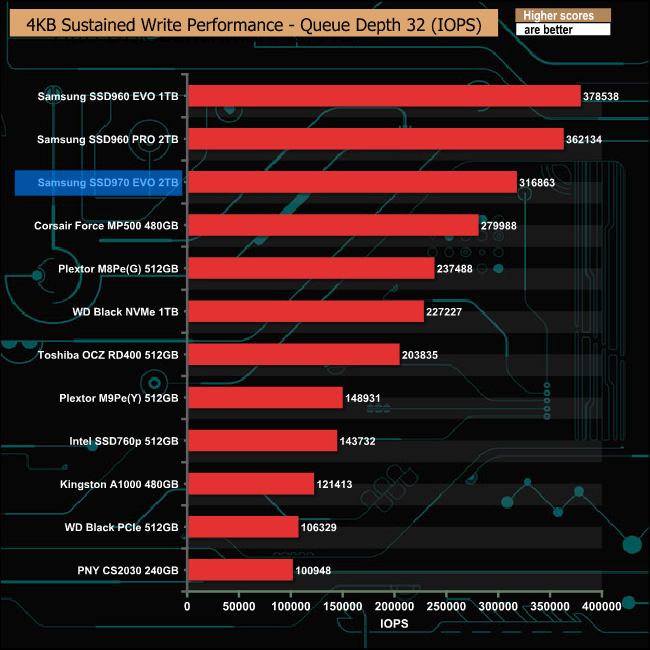
4K Sustained Random Write.
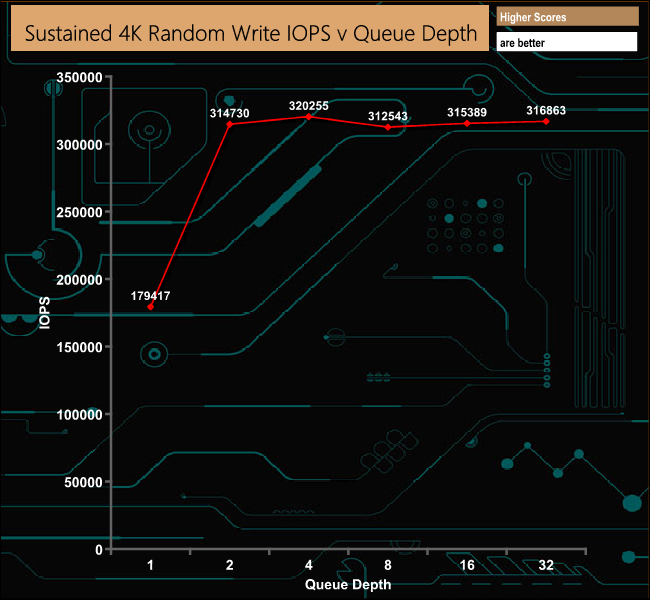
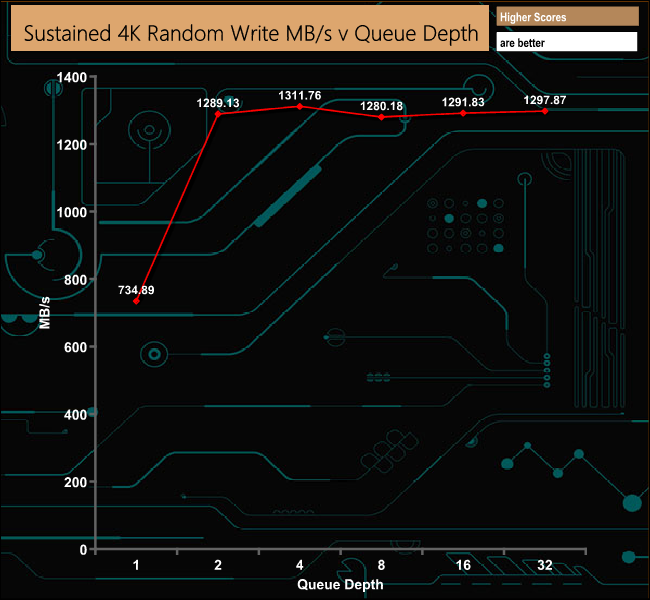
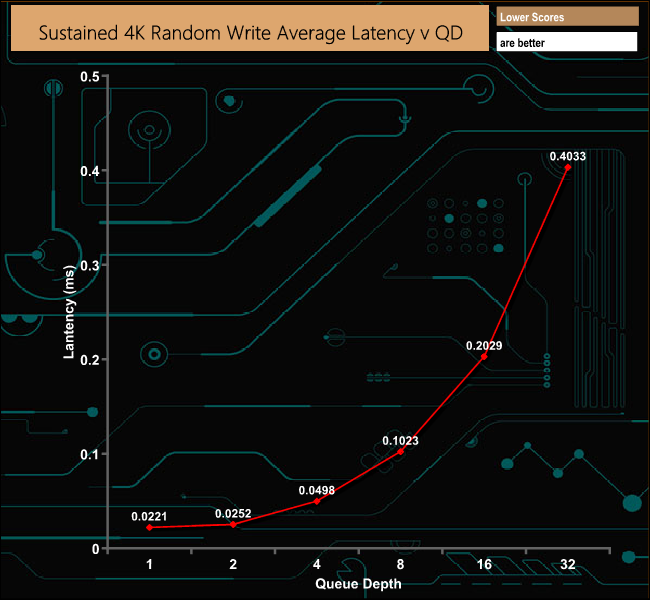
As with our 4K random read test, the fastest random write figure fell well short of the official 480,000 IOPS – at 316,863 IOPS – however this still makes the 970 EVO the third fastest drive we've seen to date for 4K random write performance.
Most desktop operations happen in the 1 – 4 queue depth range, so we've broken out the test results to see how the drive performs at these queue depths in comparison with other drives, as well as a queue depth of 32 – although in the desktop environment you'll seldom if ever see a queue depth that high.
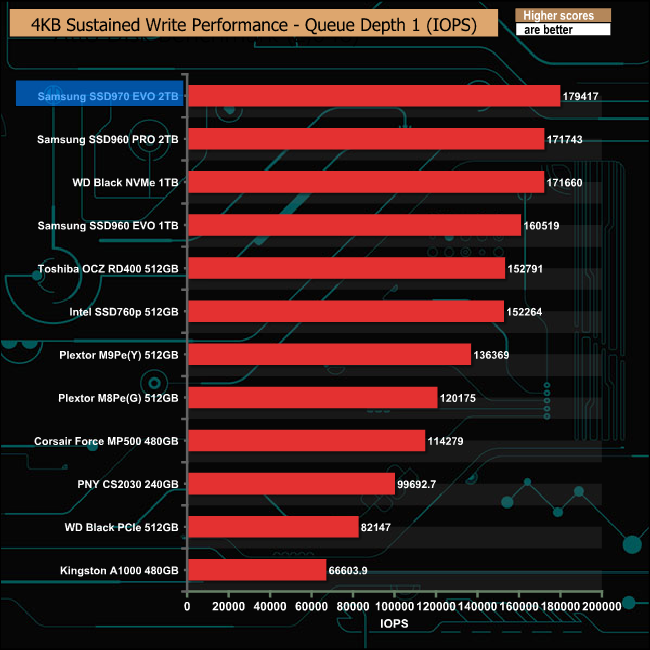
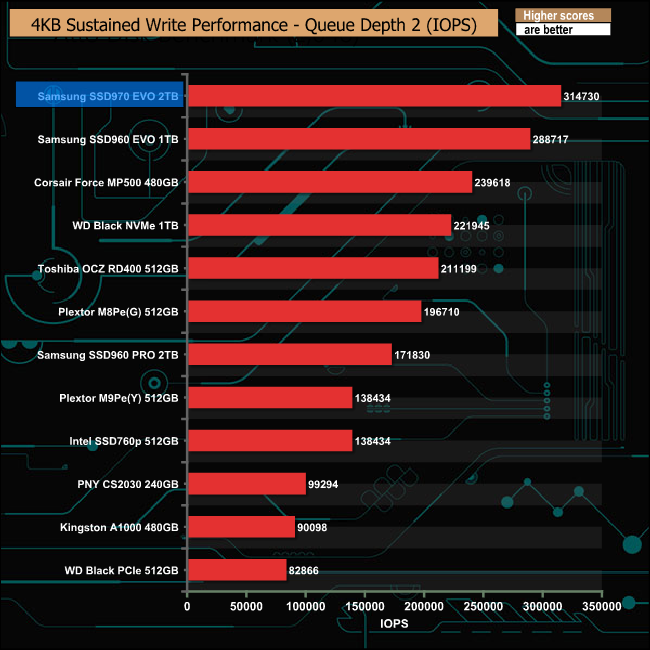

At a queue depths 1 and 2, the 970 EVO is the fastest consumer drive we've seen producing 179.417 IOPS and 314,730 IOPS respectively.
4K Random 70/30 Mix Read/Write.
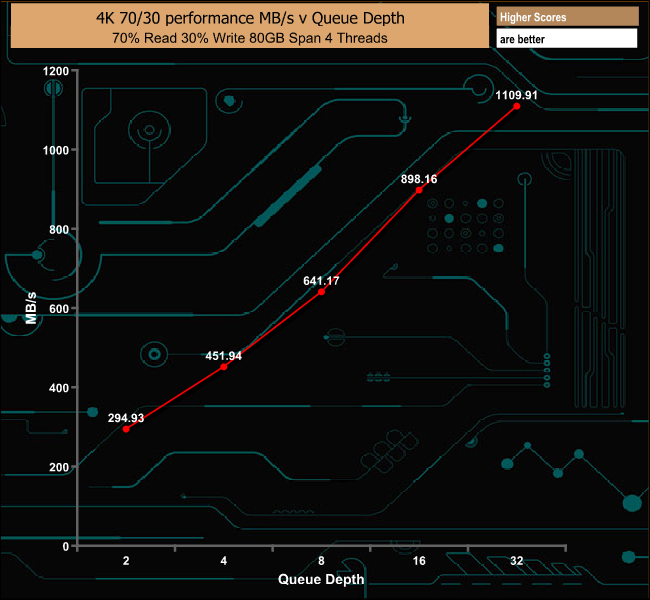
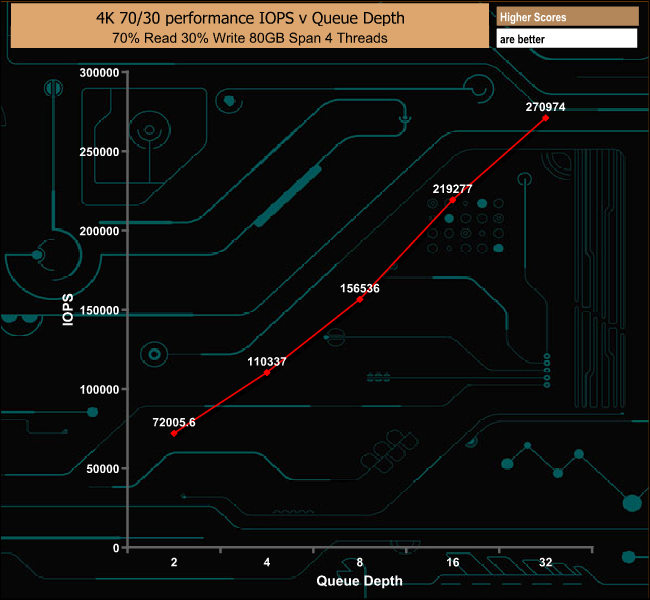
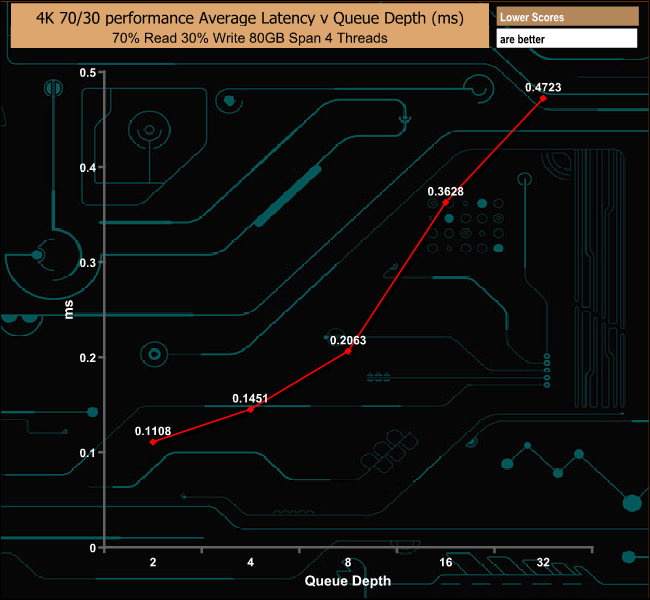
In our mixed read/write test the drive's performance increased smoothly as the queue depth deepened.
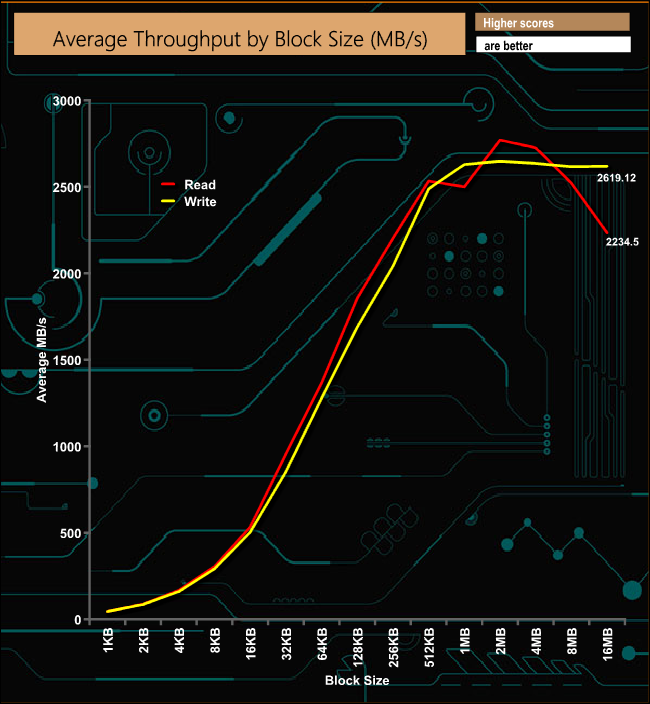
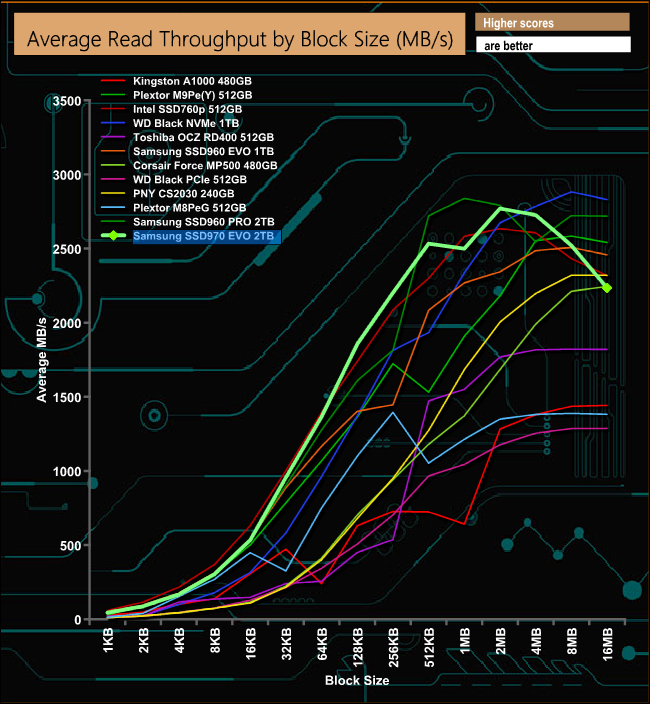
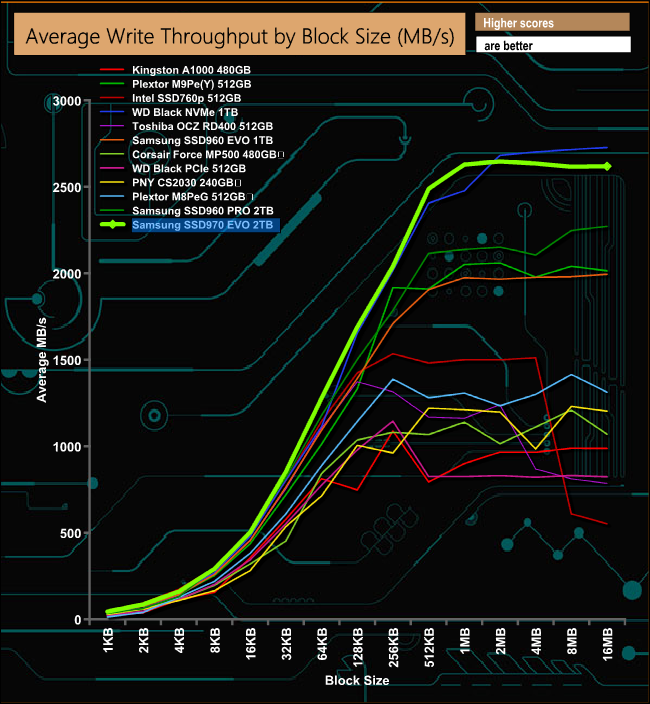
When it comes to our throughput test the 970 EVO produces a much smoother performance curve when writing. Writes peak at 2646.72MB/s (2MB block size) before ending the test at 2619.12MB/s. Reads peak at 2770.20MB/s (2MB block size) before falling back quite some way to 2234.50MB/s at the end of the test run.
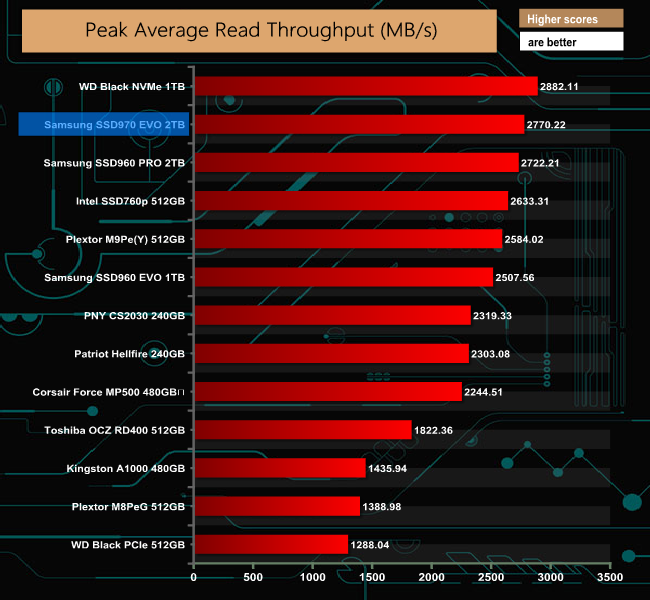
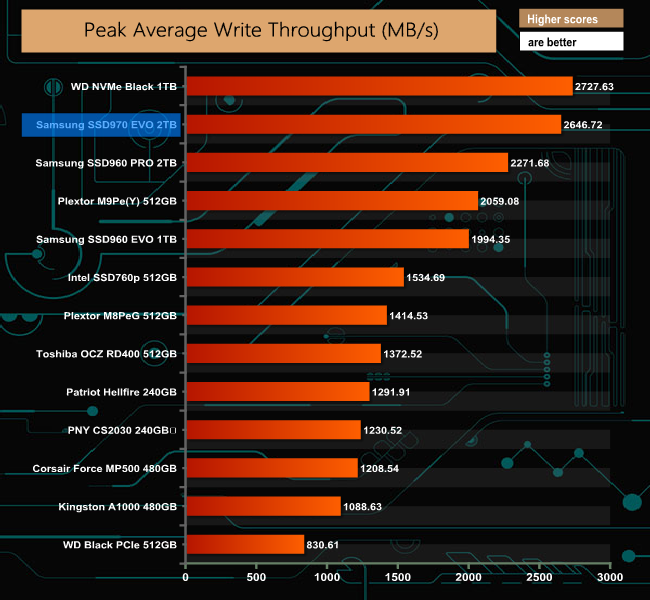
In our throughput tests, the Samsung 970 EVO is the second fastest drive we have tested to date, sitting just below WD's Black NVMe drive.
Futuremark’s PCMark 8 is a very good all round system benchmark but it’s Storage Consistency Test takes it to whole new level when testing SSD drives. It runs through four phases; Preconditioning, Degradation, Steady State, Recovery and finally Clean Up. During the Degradation, Steady State and Recovery phases it runs performance tests using the 10 software programs that form the backbone of PCMark 8; Adobe After Effects, Illustrator, InDesign, Photoshop Heavy and Photoshop Light, Microsoft Excel, PowerPoint, Word, Battlefield 3 and World of Warcraft. With some 18 phases of testing, this test can take many hours to run.
Preconditioning
The drive is written sequentially through up to the reported capacity with random data, write size of 256 × 512 = 131,072 bytes. This is done twice.
Degradation
Run writes of random size between 8 × 512 and 2048 × 512 bytes on random offsets for 10 minutes. It then runs a performance test. These two actions are then repeated 8 times and on each pass the duration of random writes is increased by 5 minutes.
Steady State
Run writes of random size between 8 × 512 and 2048 × 512 bytes on random offsets for final duration achieved in degradation phase. A performance test is then run. These actions are then re-run five times.
Recovery
The drive is idled for 5 minutes. Then a performance test is run. These actions are then repeated five times.
Clean Up
The drive is written through sequentially up to the reported capacity with zero data, write size of 256 × 512 = 131,072 bytes.
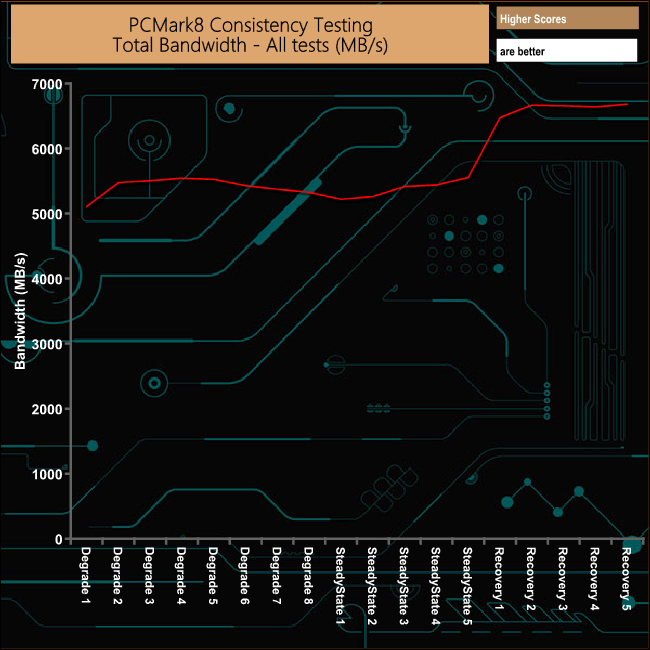

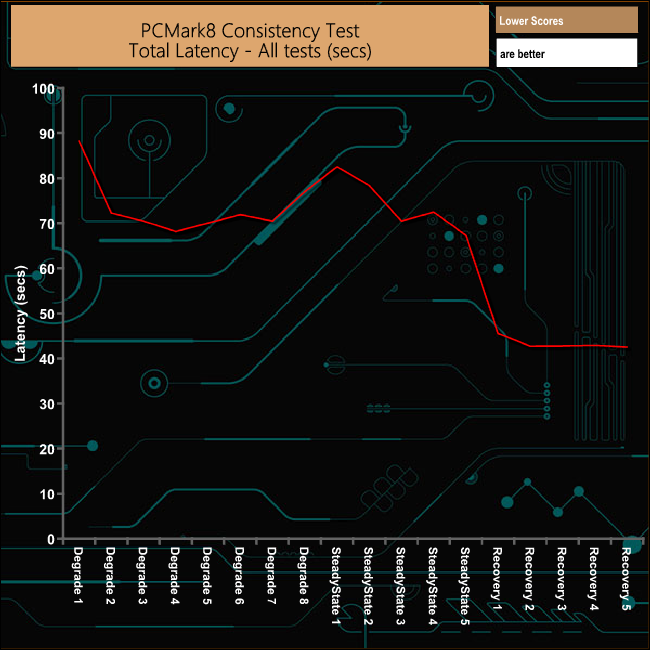
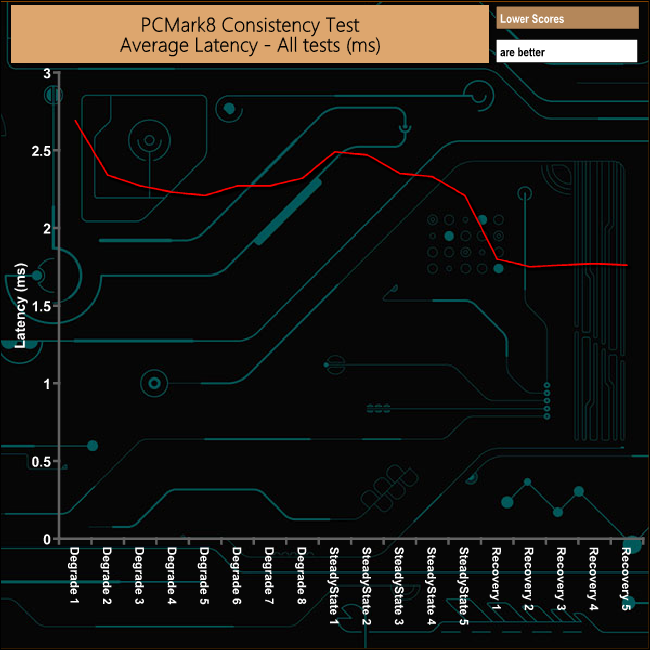
Overall the 970 EVO performs well in the rigorous PCMark 8 Consistency test, with a gradual dip in performance during the Degradation phases but it recovers very well from the ordeal.
PCMark 8’s Consistency test provides a huge amount of performance data, so here we’ve looked a little closer at how the Samsung 970 EVO 2TB drive performs in each of the benchmarks test suites.
Adobe Creative Cloud
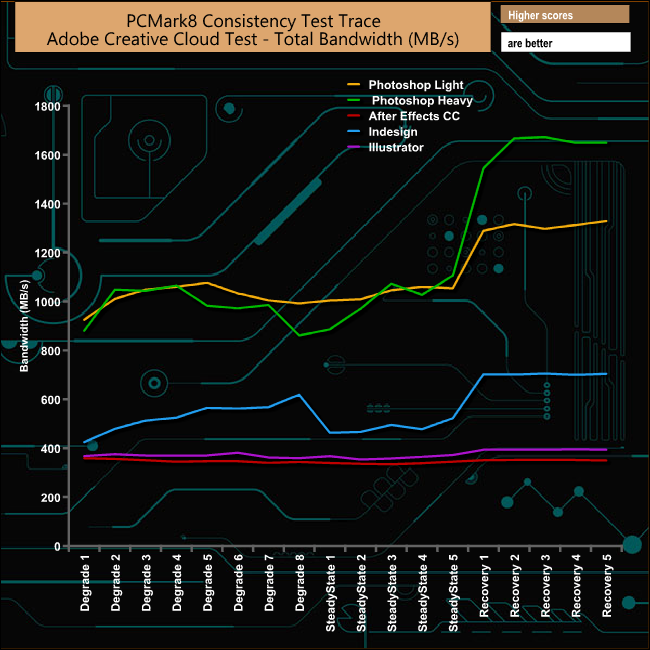
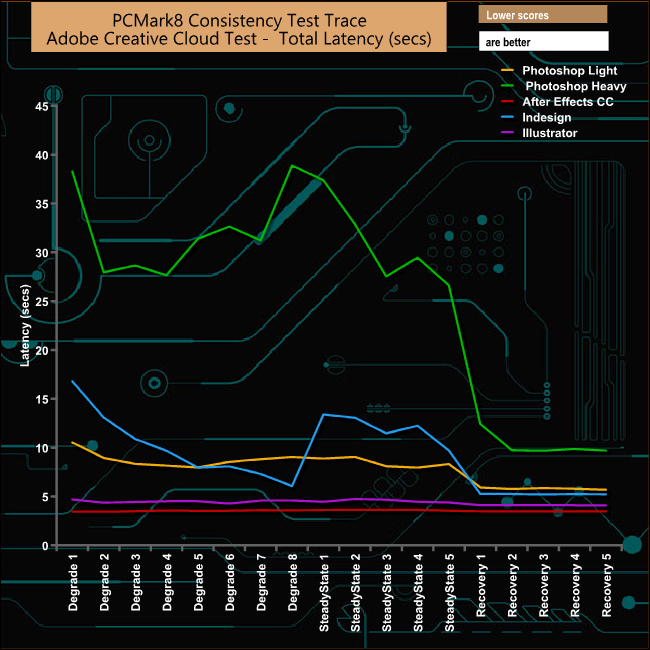
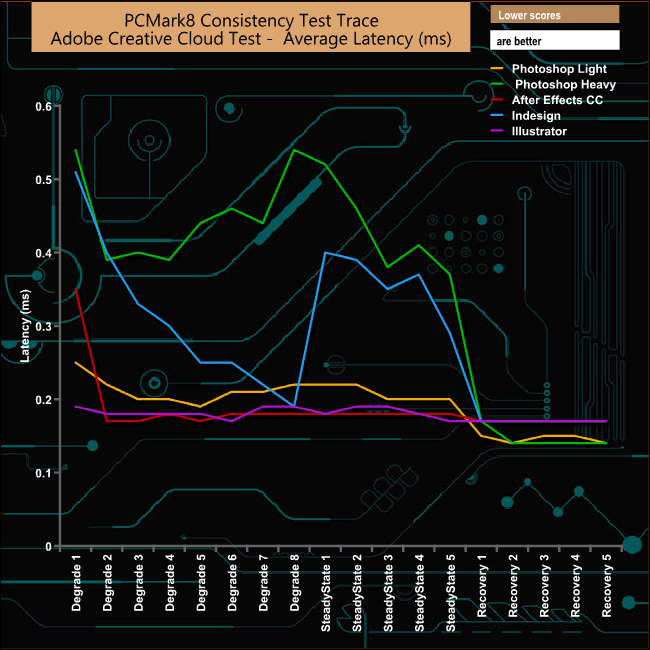
As usual the Adobe Photoshop Heavy test trace stresses the drive the most, but it does recover well during this particular test run. Somewhat unusual is the drop in performance during the Steady State phases of the Indesign test, but once again the performance picks up in the recovery phases.
Microsoft Office
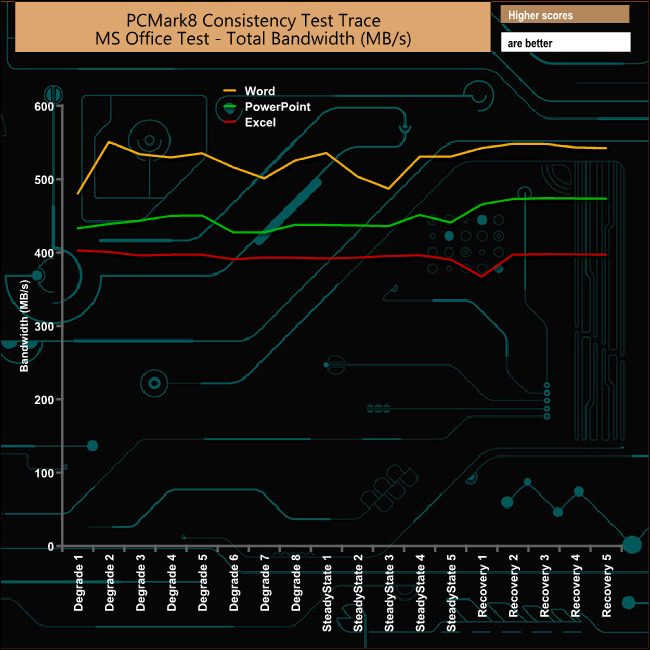
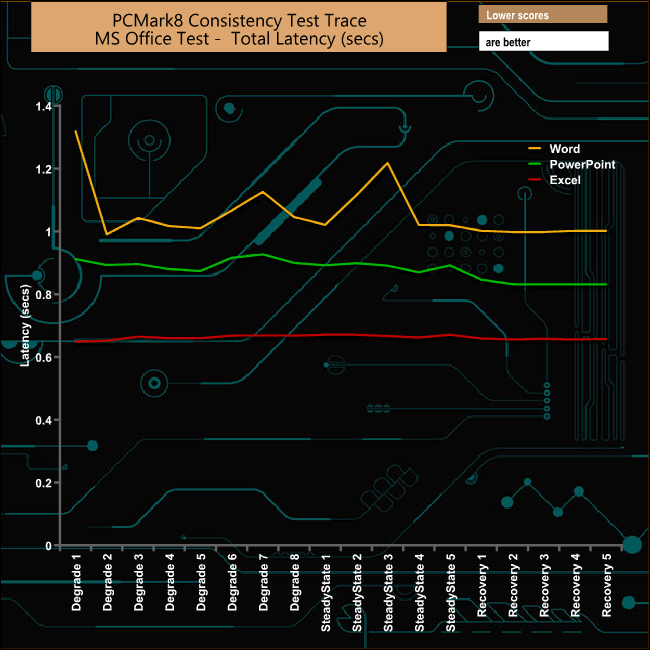
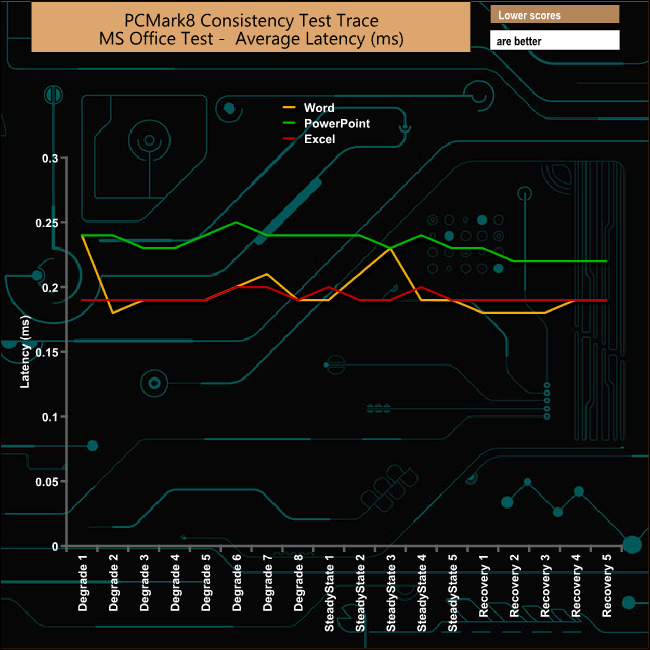
In the Microsoft Office tests it's the Word trace that suffers most during the test run, with the bandwidth dropping noticeably between the first and fourth Steady State phases – from 535MB/s down to 478MB/s. All three traces show a very gradual improvement during the recovery phases.
Casual Gaming
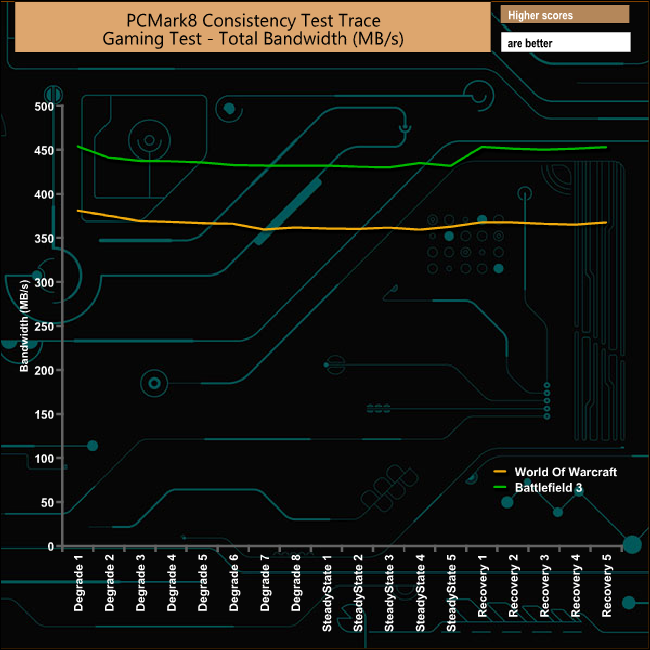
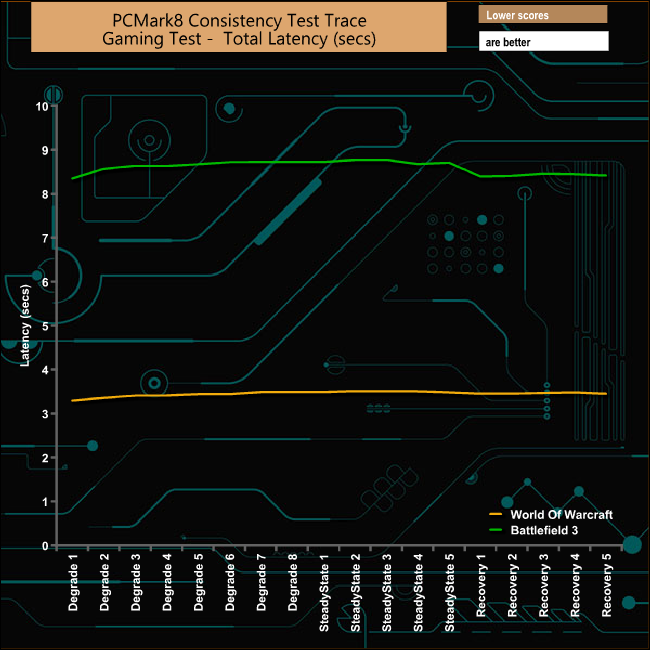
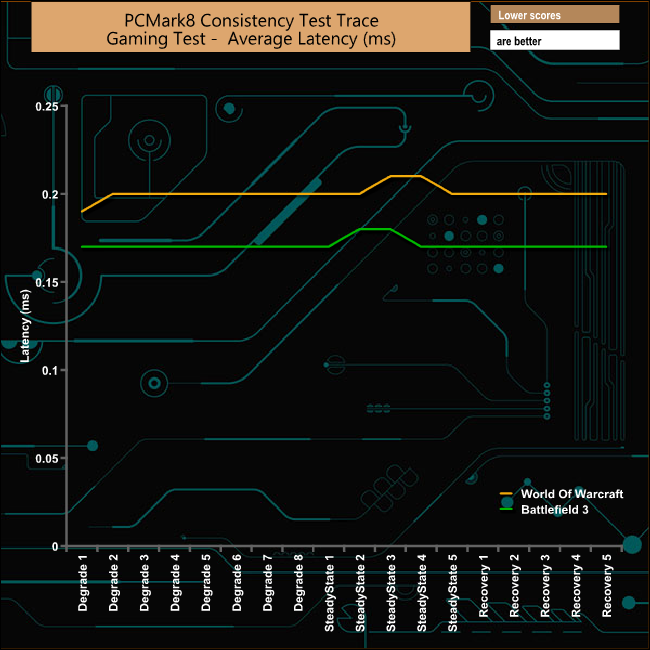
During both casual gaming tests, the drive shows pretty good consistency throughout the test phases.
Just like the Consistency test, PCMark 8’s standard Storage test also saves a large amount of performance data. The default test runs through the test suite of 10 applications three times. Here we show the total bandwidth performance for each of the individual test suites for the third and final benchmark run.
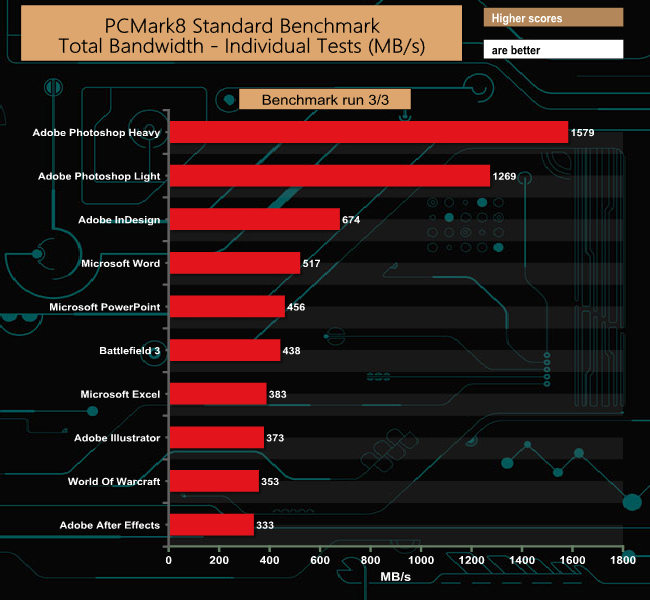
The 970 EVO performs very well in the Standard PCMark 8 Storage test, with excellent bandwidth figures for both of the Adobe Photoshop tests in particular.
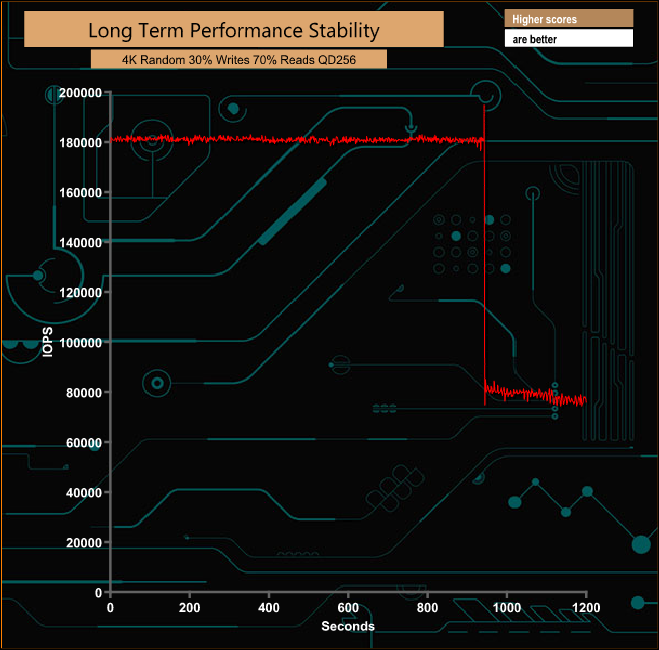
For the long term performance stability test, we set the drive up to run a 20-minute 4K random test with a 30% write, 70% read split, at a queue depth of 256 over the entire disk. The 2TB Samsung 970 EVO averaged 159,114 IOPS for the test with a performance stability of 87% which, for a consumer drive, is excellent – getting near to enterprise-class ratings.
To test real life performance of a drive we use a mix of folder/file types and by using the FastCopy utility (which gives a time as well as MB/s result) we record the performance of drive reading from & writing to a 256GB Samsung 850 PRO.
For NVMe drives we've also added a new test to try and show the true potential of the PCIe interface by reading and writing the same real life data to and from a Toshiba/OCZ RD400 drive.
100GB data file.
60GB iso image.
60GB Steam folder – 29,521 files.
50GB File folder – 28,523 files.
12GB Movie folder – 24 files (mix of Blu-ray and 4K files).
10GB Photo folder – 621 files (mix of .png, raw and .jpeg images).
10GB Audio folder – 1,483 files (mix of mp3 and .flac files).
5GB (1.5bn pixel) photo.
Samsung 850 PRO
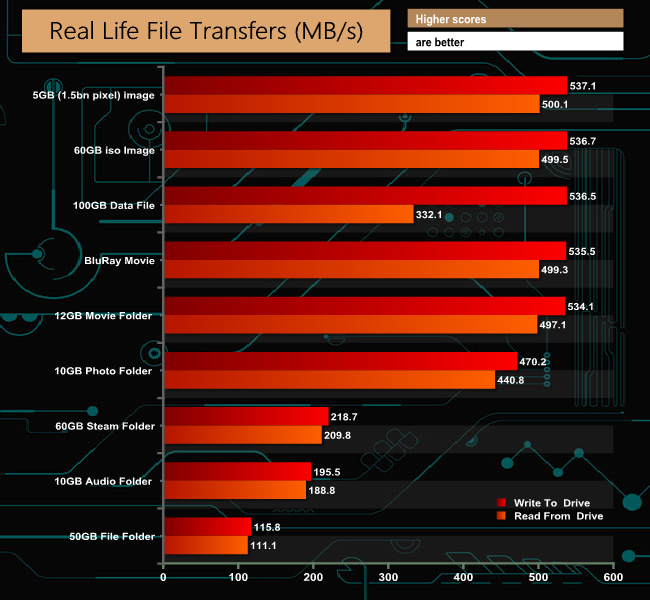
The drive handles large file sizes a lot more effectively than smaller ones, as can be seen by the 500MB/s+ figures for the tests made up of larger files (ISO image, Blu Ray movie etc).
OZC RD400
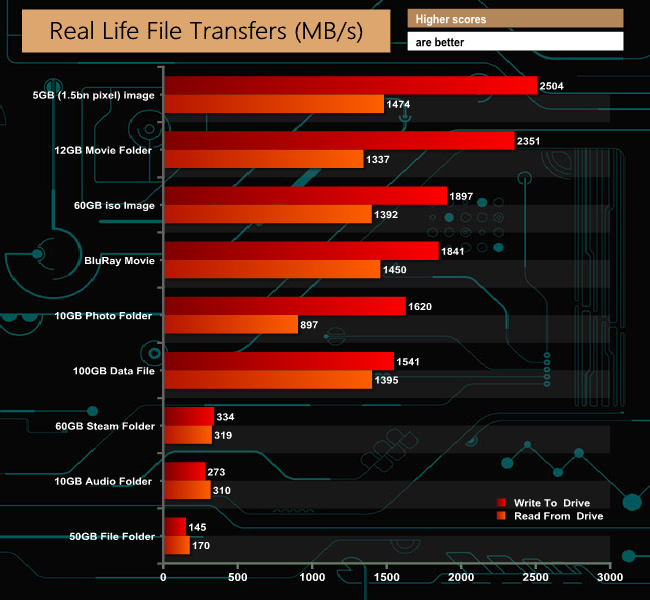
Switching to transferring files and folders to another NVMe disk saw a huge rise in the transfer rate, but once again it really became apparent when the drive is dealing with large file sizes.
To give a better idea of just how much faster going from NVMe to NVMe drive is, than to and from a standard SATA SSD, the 1000GB data file took 3m 10s to transfer from the SATA SSD to the SSD970 EVO and 5m 8s to go the other way. When the same file was written to the NVMe drive from the 970 EVO it took a mere 1m 13s and just 1m 6s to write to the 970 EVO.In the time frame between the SSD 960 and SSD 970 launches, the NVMe market has become a much more competitive place with drives like WD's Black NVMe offering serious competition to Samsung's once dominant 960-series in various market segments.
Not only that, but in the same time frame, the value market segment for NVMe drives has sprung up from nowhere and already is a fiercely competitive arena.
The new SSD 970 series upgrades the NAND of the previous generation SSD 960 and sees the introduction of a new controller. The SSD 970 EVO uses Samsung's latest 64-layer 3-bit MLC (or TLC to you and me) V-NAND rather than the 48-layer version the SSD 960 EVO used, while the new controller goes under the name of Phoenix. Phoenix is an 8-channel, 5-core controller with of the five cores used as a dedicated communication link between the Phoenix and the host system.
Also upgraded for the 970 EVO is Samsung's TurboWrite technology. First introduced with the 960 EVO, TurboWrite basically uses a portion of the NAND as an SLC write buffer to boost write performance. The 2TB drive has a default TurboWrite region of 6GB but if the drive is being asked to write more than 6GB, the 970 EVO can use up to 72GB of dynamic SLC buffer to give a total SLC buffer of 78GB. This dynamic SLC buffer takes advantage of idle capacity so will not work, in the example of the 2TB drive, if there is less than 72GB of free capacity.
Performance wise the 970 EVO is a very quick drive. Samsung quotes sequential read/write figures for the 2TB drive as up to 3,500MB/s and 2,500MB/s respectively. When tested with the ATTO benchmark our review drive came up a little shy of the maximum quoted read speed at 3,154MB/s, while the tested write speed was bang on the mark at 2,506MB/s.
Random 4K read/write performance is quoted at up to 500,000 IOPS and 480,000 IOPS at a queue depth of 32. We couldn't match those figures either, but the tested drive's 366,265 IOPS for reads is the fastest we've seen to date from a consumer NVMe SSD, while the tested write speed of 316,863 IOPS is the third fastest we've seen.
![]()
We found the 2TB 970 EVO on Overclockers UK for £749.99 (inc VAT) HERE.
Pros
- 64-layer NAND technology.
- Overall performance.
- 5-year warranty.
Cons
- Pricey.
- We couldn't match Samsung's quoted sequential read figure.
KitGuru says: It has taken a while but the successor to the immensely popular 960 EVO is here. The 970 EVO performs very well and has increased endurance compared to its predecessor, but we couldn't quite hit Samsung's quoted read speeds.