

Hot on the heels of Nvidia's announcement at Virtual Computex 2021, today we can present our review of the RTX 3080 Ti. Built on the same GA102 GPU as the RTX 3080 and the RTX 3090, the RTX 3080 Ti sports a total of 82 Streaming Multiprocessors, only two fewer than the RTX 3090. Its memory allocation has been halved, with 12GB of GDDR6X which also runs fractionally slower. How much difference will those tweaks make to real world gaming though? That's what we find out today.
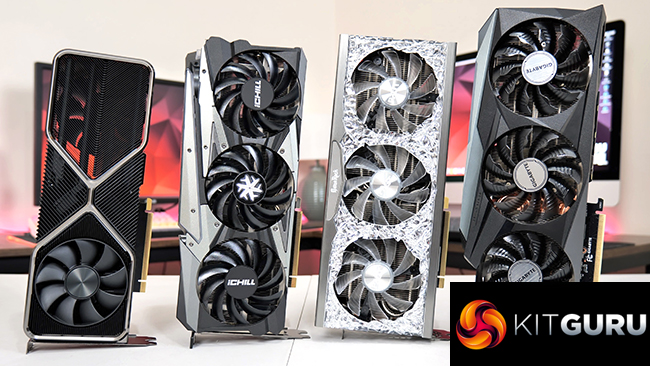
As part of this review, we will of course be focusing on Nvidia's RTX 3080 Ti Founders Edition, which uses the same cooler as the RTX 3080 that launched back in September. We do also have three AIB cards to include as part of this day one review, which will make an interesting comparison for the Founders Edition.
The first of these is Gigabyte's RTX 3080 Ti Gaming OC, a now-familiar looking triple-fan card. In fact, all three partner models are use thick triple-fan coolers, with the other two in question being the Palit RTX 3080 Ti GameRock OC and the Inno3D RTX 3080 Ti iChill X4.
| RTX 3090 | RTX 3080 Ti | RTX 3080 | RTX 3070 | RTX 3060 Ti | |
| SMs | 82 | 80 | 68 | 46 | 38 |
| CUDA Cores | 10496 | 10240 | 8704 | 5888 | 4864 |
| Tensor Cores | 328 | 320 | 272 | 184 | 152 |
| RT Cores | 82 | 80 | 68 | 46 | 38 |
| Texture Units | 328 | 320 | 272 | 184 | 152 |
| ROPs | 112 | 112 | 96 | 96 | 80 |
| GPU Boost Clock | 1695 MHz | 1665 MHz | 1710 MHz | 1725 MHz | 1665 MHz |
| Memory Data Rate | 19.5 Gbps | 19 Gbps | 19 Gbps | 14 Gbps | 14 Gbps |
| Total Video Memory | 24GB GDDR6X | 12GB GDDR6X | 10GB GDDR6X | 8GB GDDR6 | 8GB GDDR6 |
| Memory Interface | 384-bit | 384-bit | 320-bit | 256-bit | 256-bit |
| Memory Bandwidth | 936 GB/Sec | 912 GB/Sec | 760 GB/Sec | 448 GB/Sec | 448 GB/Sec |
| TGP | 350W | 350W | 320W | 220W | 200W |
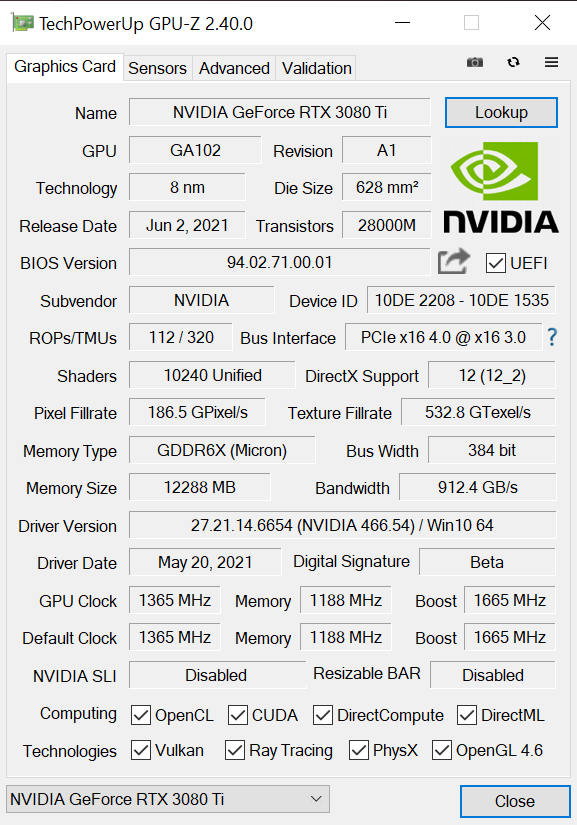
As mentioned, the RTX 3080 Ti uses Nvidia’s GA102 GPU, but a slightly cut-down version of the silicon. That means the RTX 3080 Ti incorporates 80 Streaming Multiprocessors (SMs), and thanks to Ampere’s new SM structure with its two FP32 datapaths, each SM houses 128 CUDA cores, giving a total of 10240. This is only 256 fewer cores compared to the RTX 3090, a reduction of 2.4%.
Ampere also places one RT core, and four Tensor cores, in each SM, giving a total of 80 RT cores and 320 Tensor cores. This is accompanied by 320 texture units and 112 ROPs which are now housed directly within each graphics processing cluster (GPC), with 16 ROPs per GPC, and 7 GPCs in total for RTX 3080 Ti.
Clock speed is another area where Nvidia has made cut backs compared to the RTX 3090. The RTX 3080 Ti Founders Edition has a reference clock of 1665MHz, a reduction of 30MHz against the RTX 3090, though all three of the partner cards we test come factory overclocked. We test real-world clock speed behaviour later in this review.
For the memory, Nvidia is using the same 384-bit bus as found with the RTX 3090. The memory allocation itself has been halved, to 12GB of GDDR6X, while it also comes clocked at 19Gbps instead of 19.5Gbps as with the RTX 3090.
Lastly, for total graphics power, Nvidia rates the RTX 3080 Ti for 350W, the exact same as the RTX 3090. This review is the first where we will debut our new GPU power testing methodology, so read on for our most detailed power testing yet.
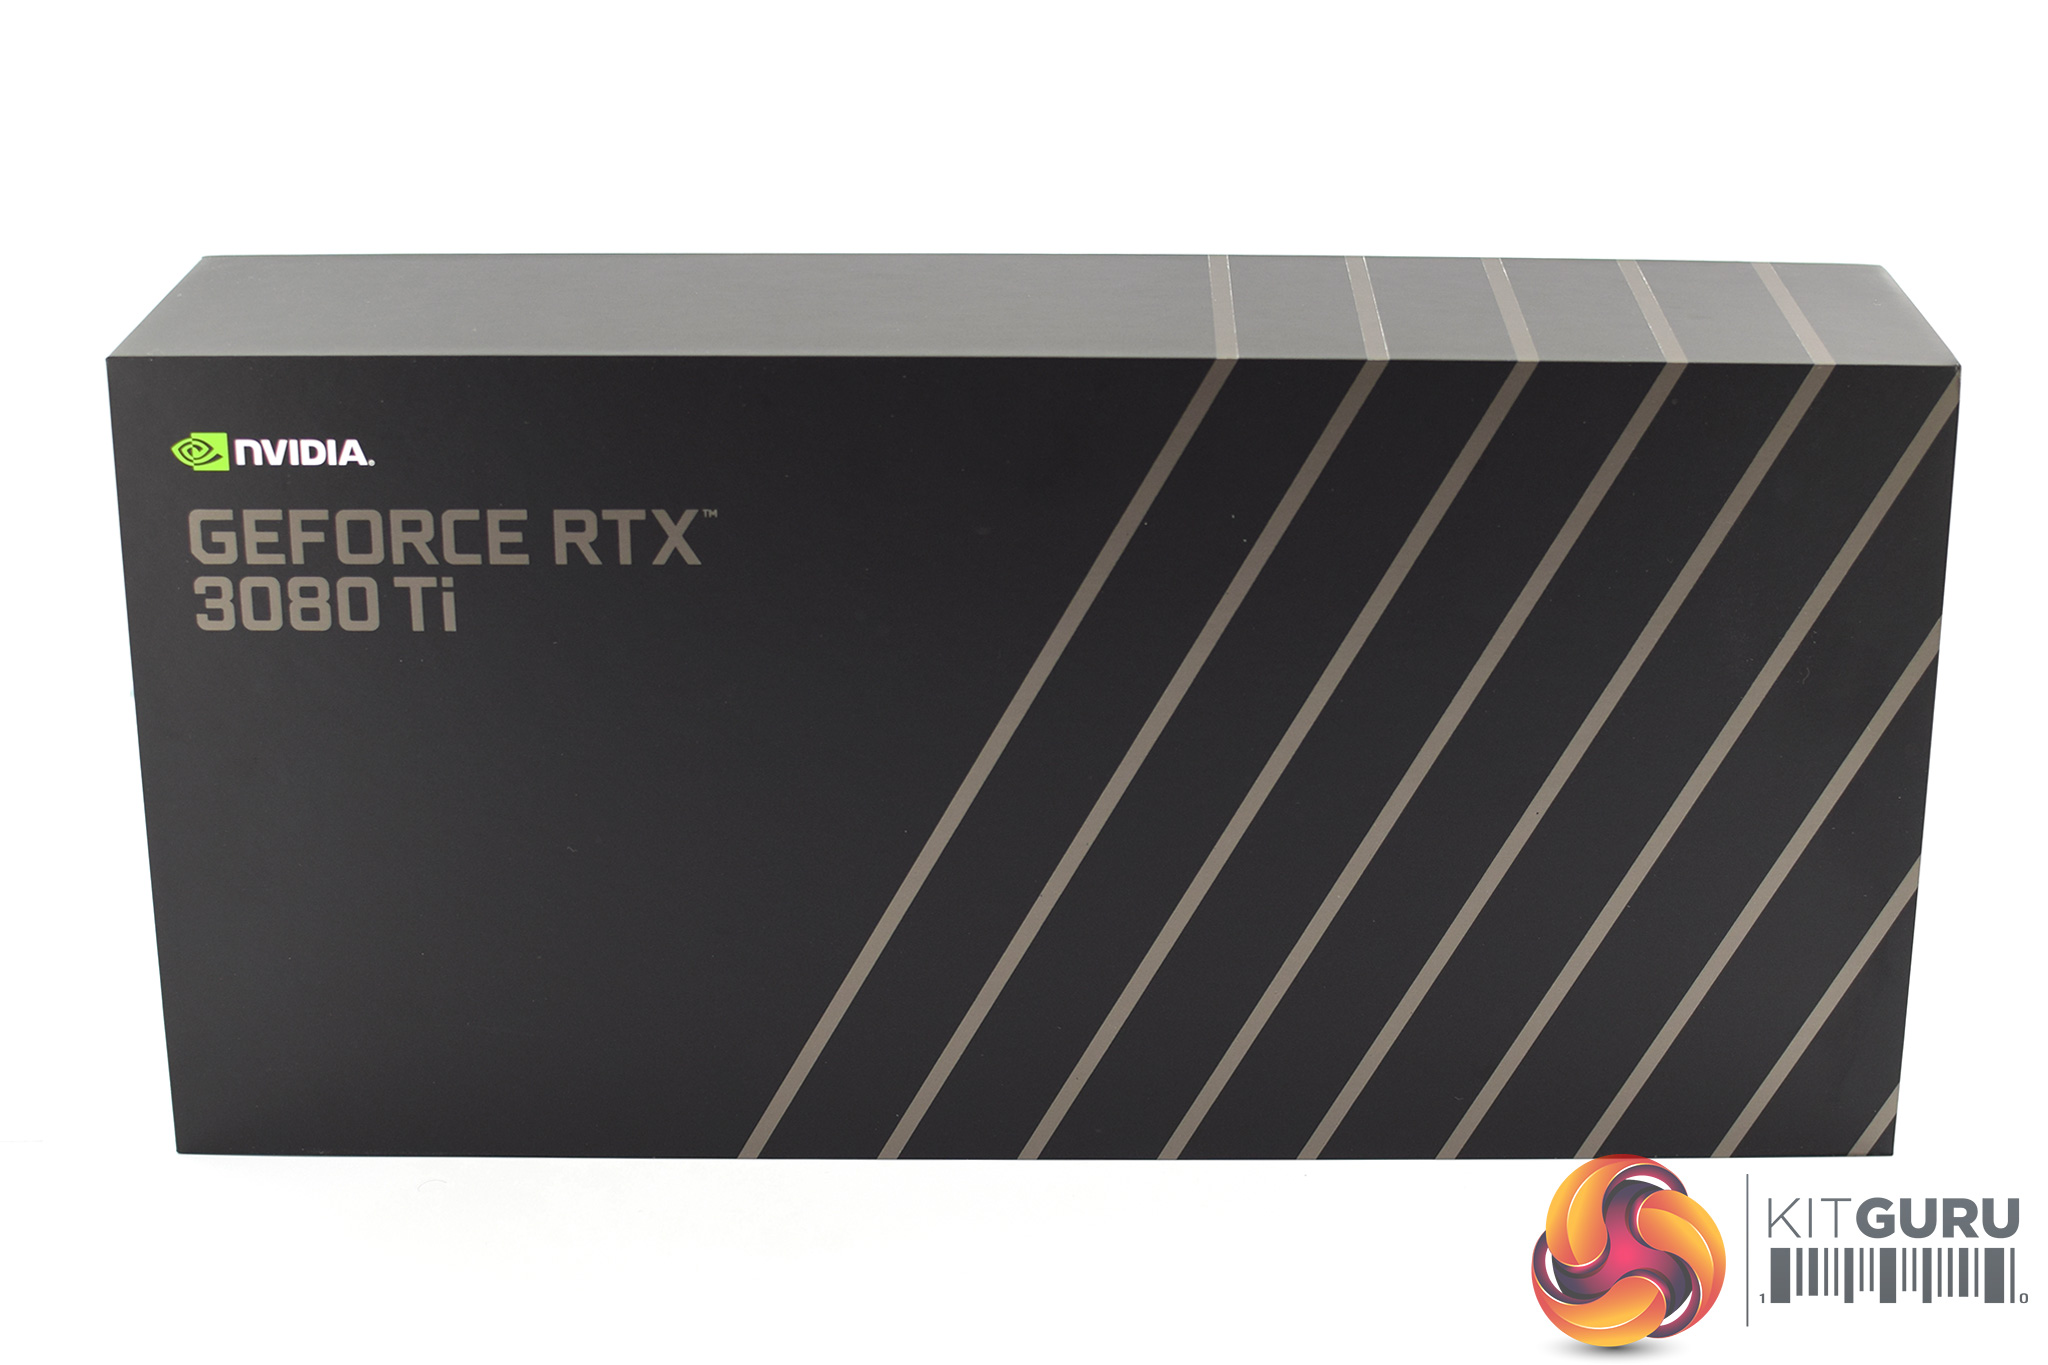
The Nvidia RTX 3080 Ti Founders Edition ships in a very similar box to that of the other RTX 30-series Founders Editions, though it is actually slightly more compact.
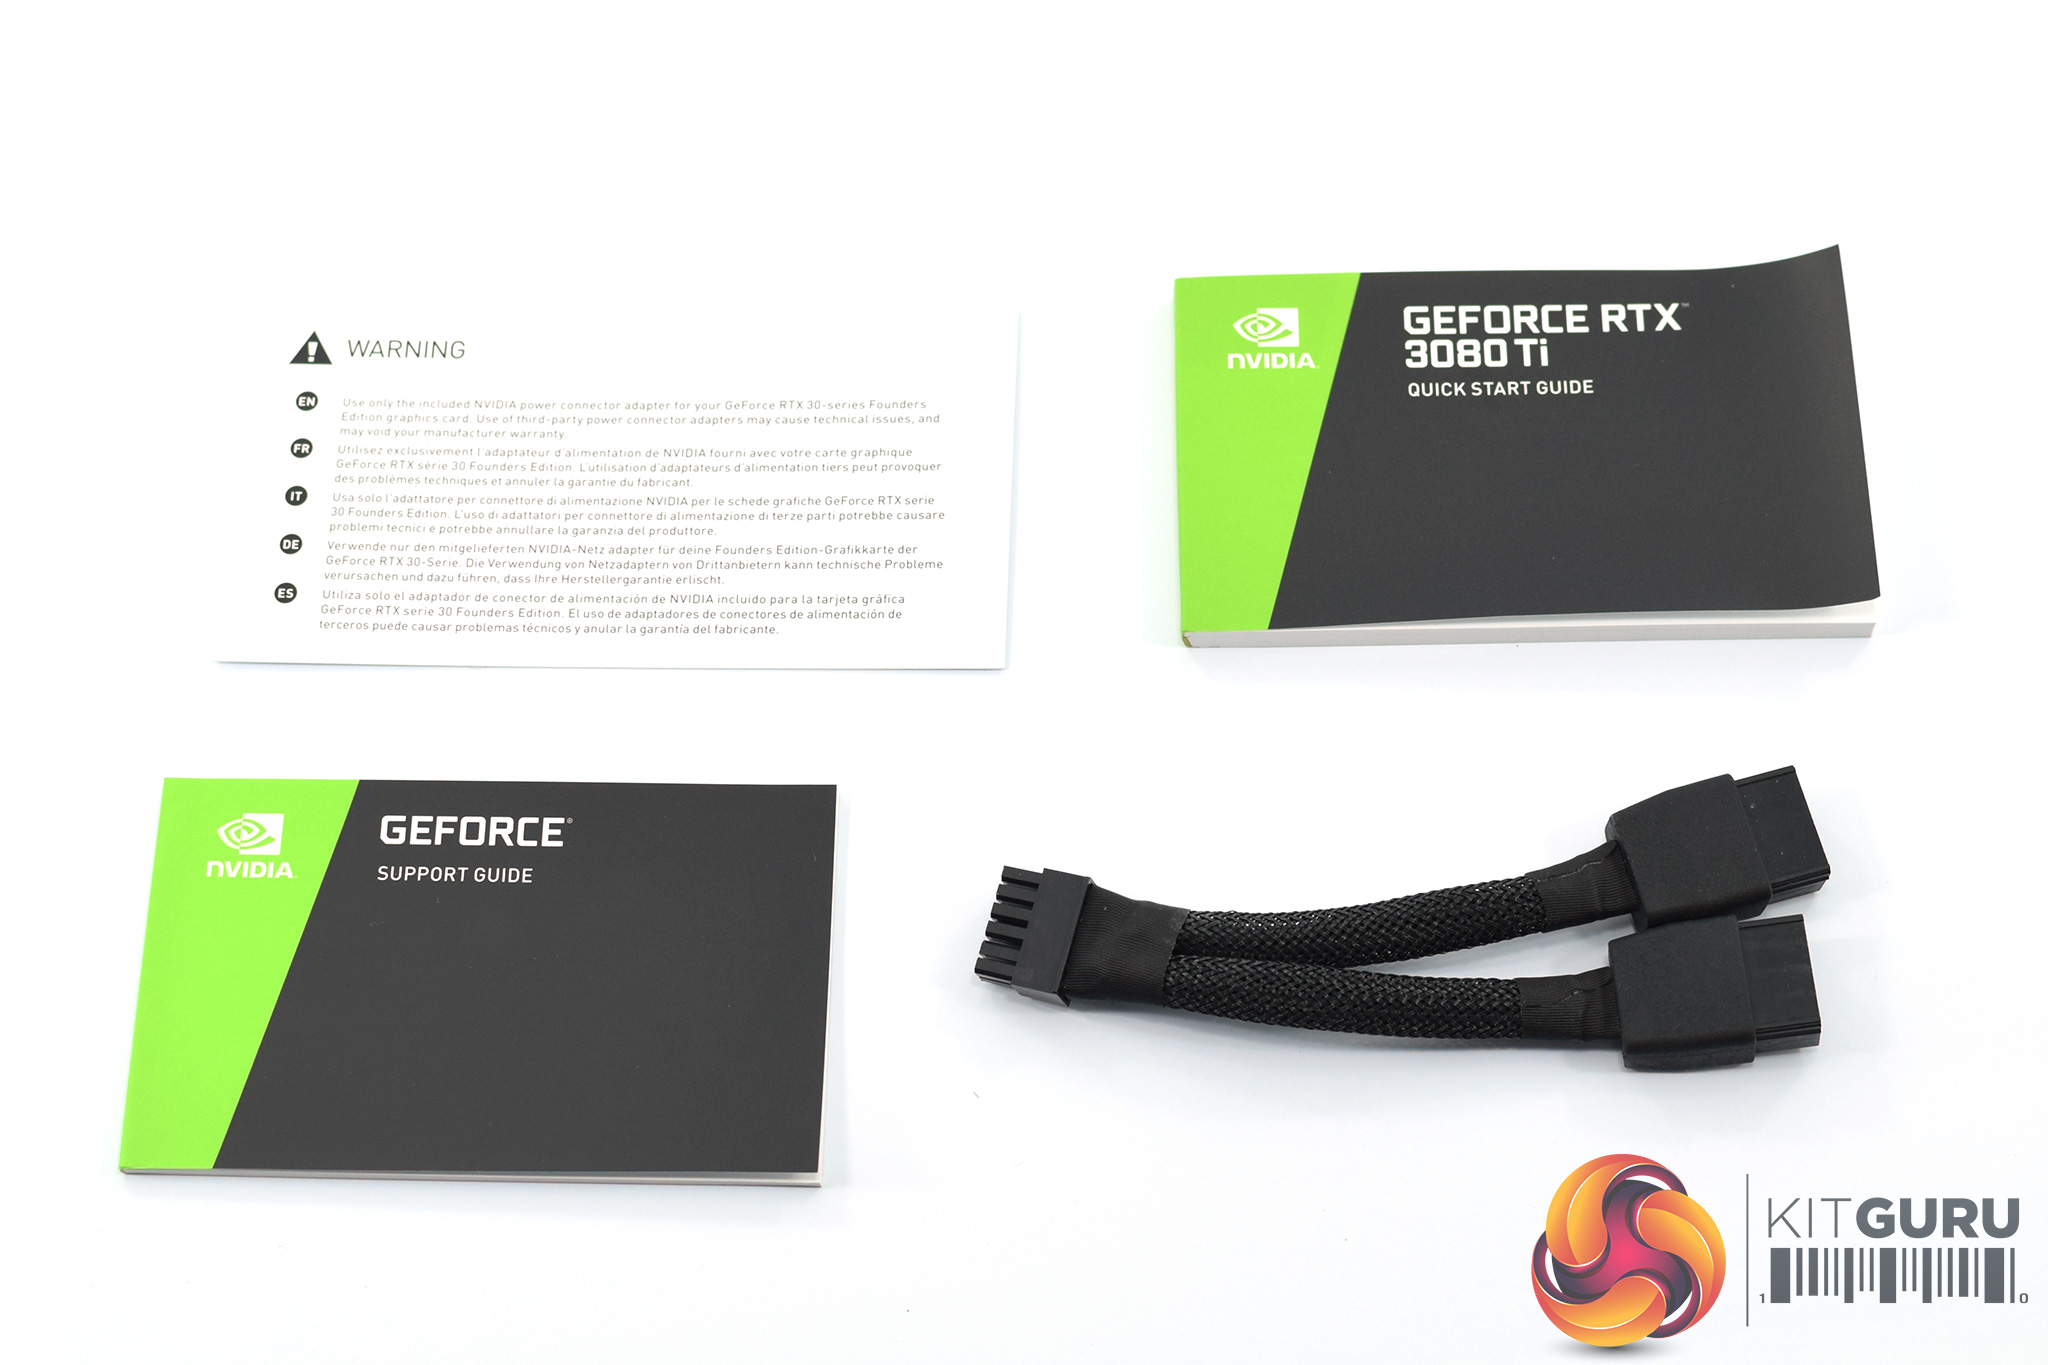
Inside, we get the usual documentation and a 2x 8-pin to 12-pin power adapter. That's right, Nvidia has stuck to its guns and the 12-pin connector is present on this Founders Edition.
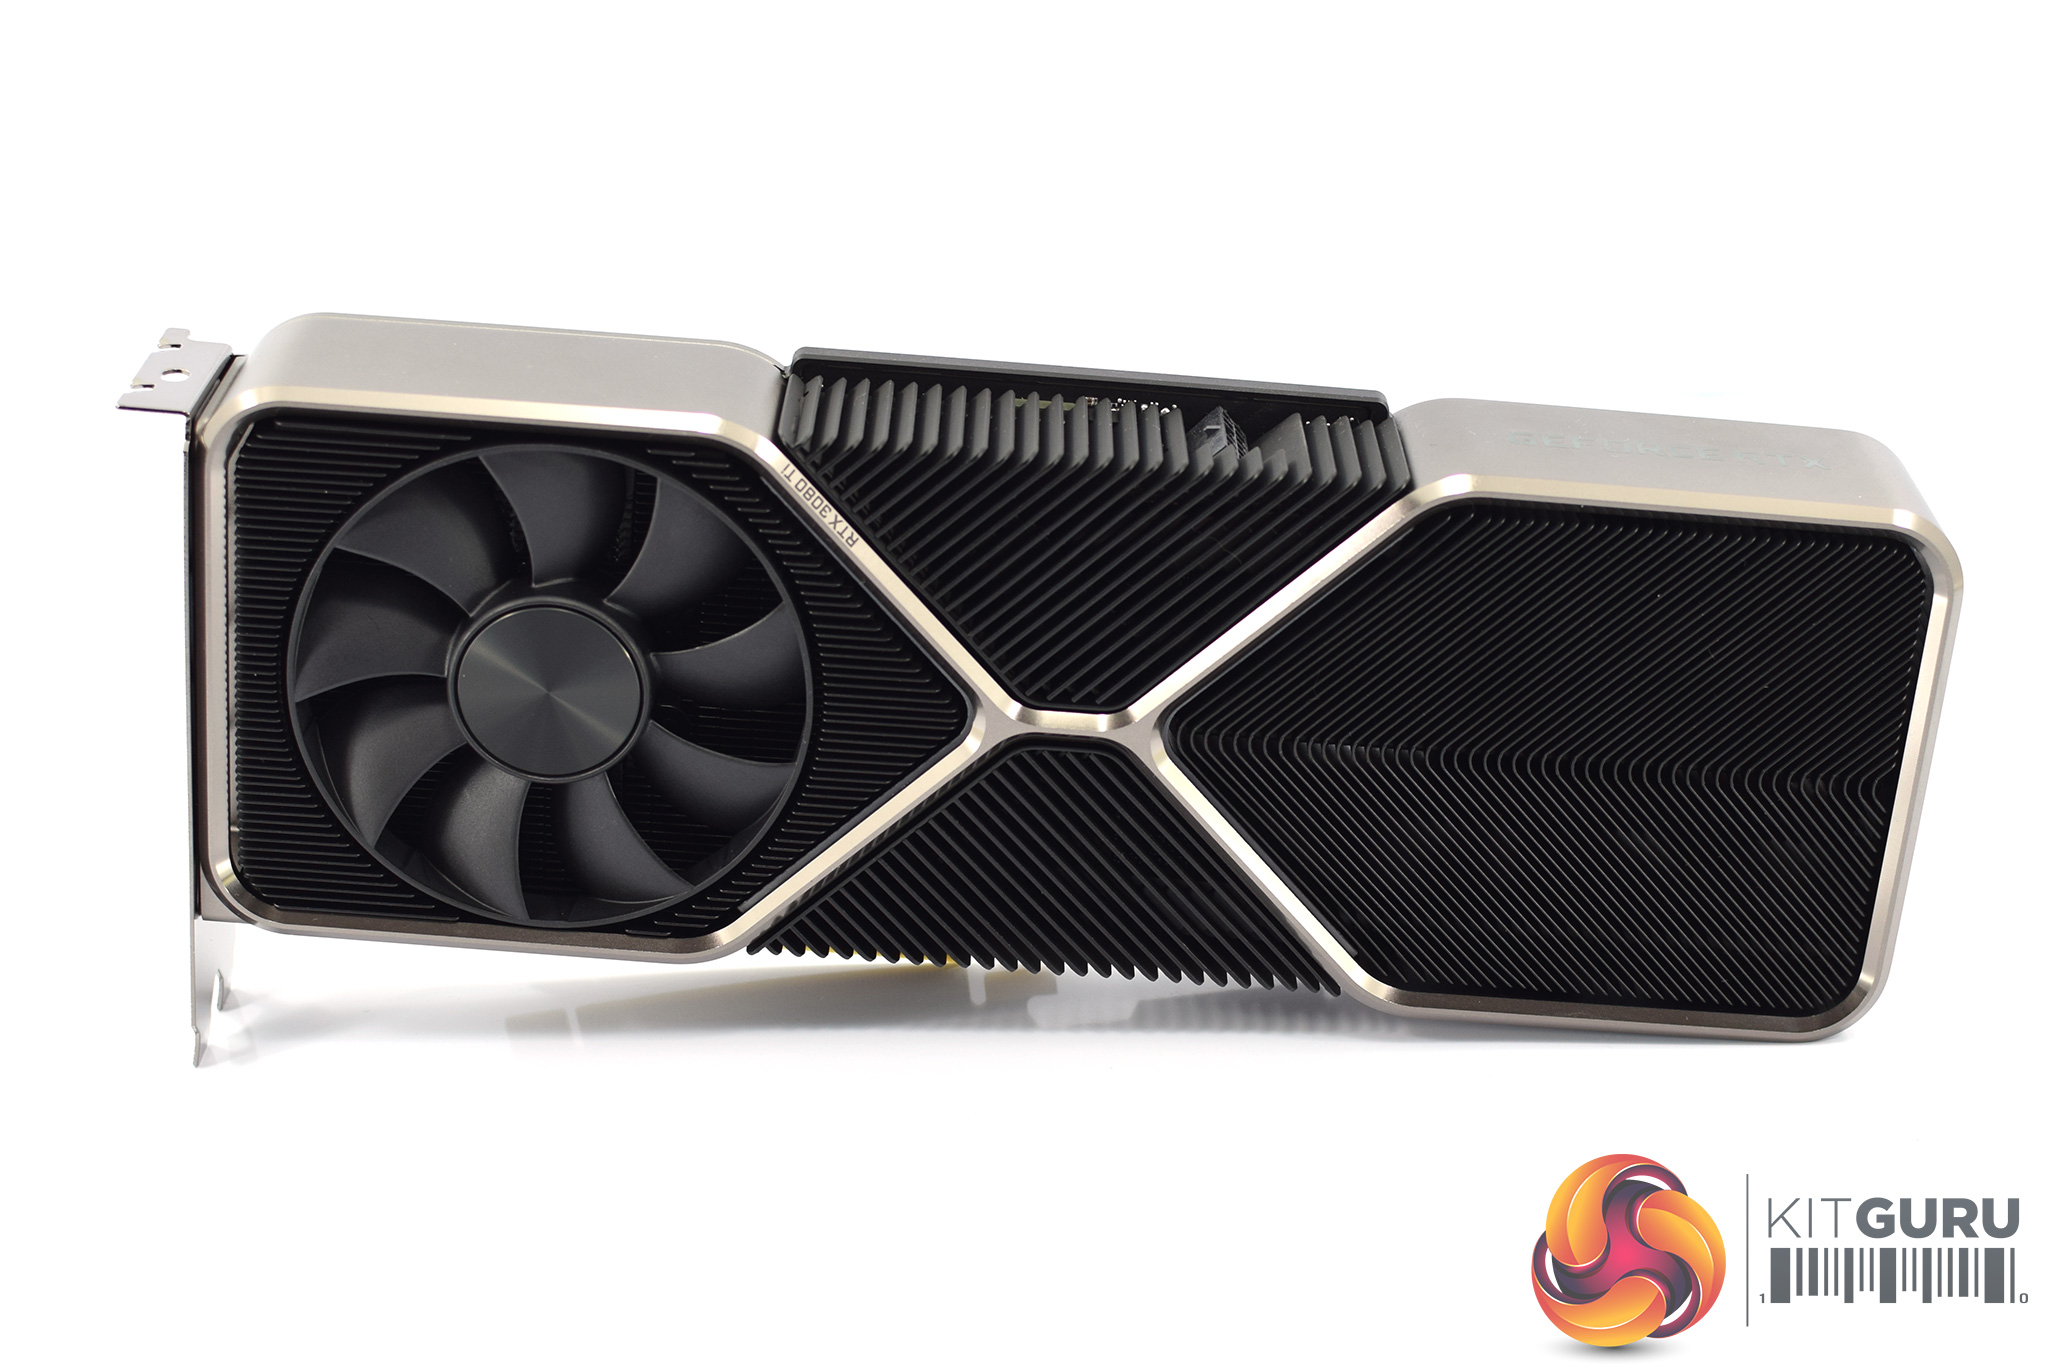
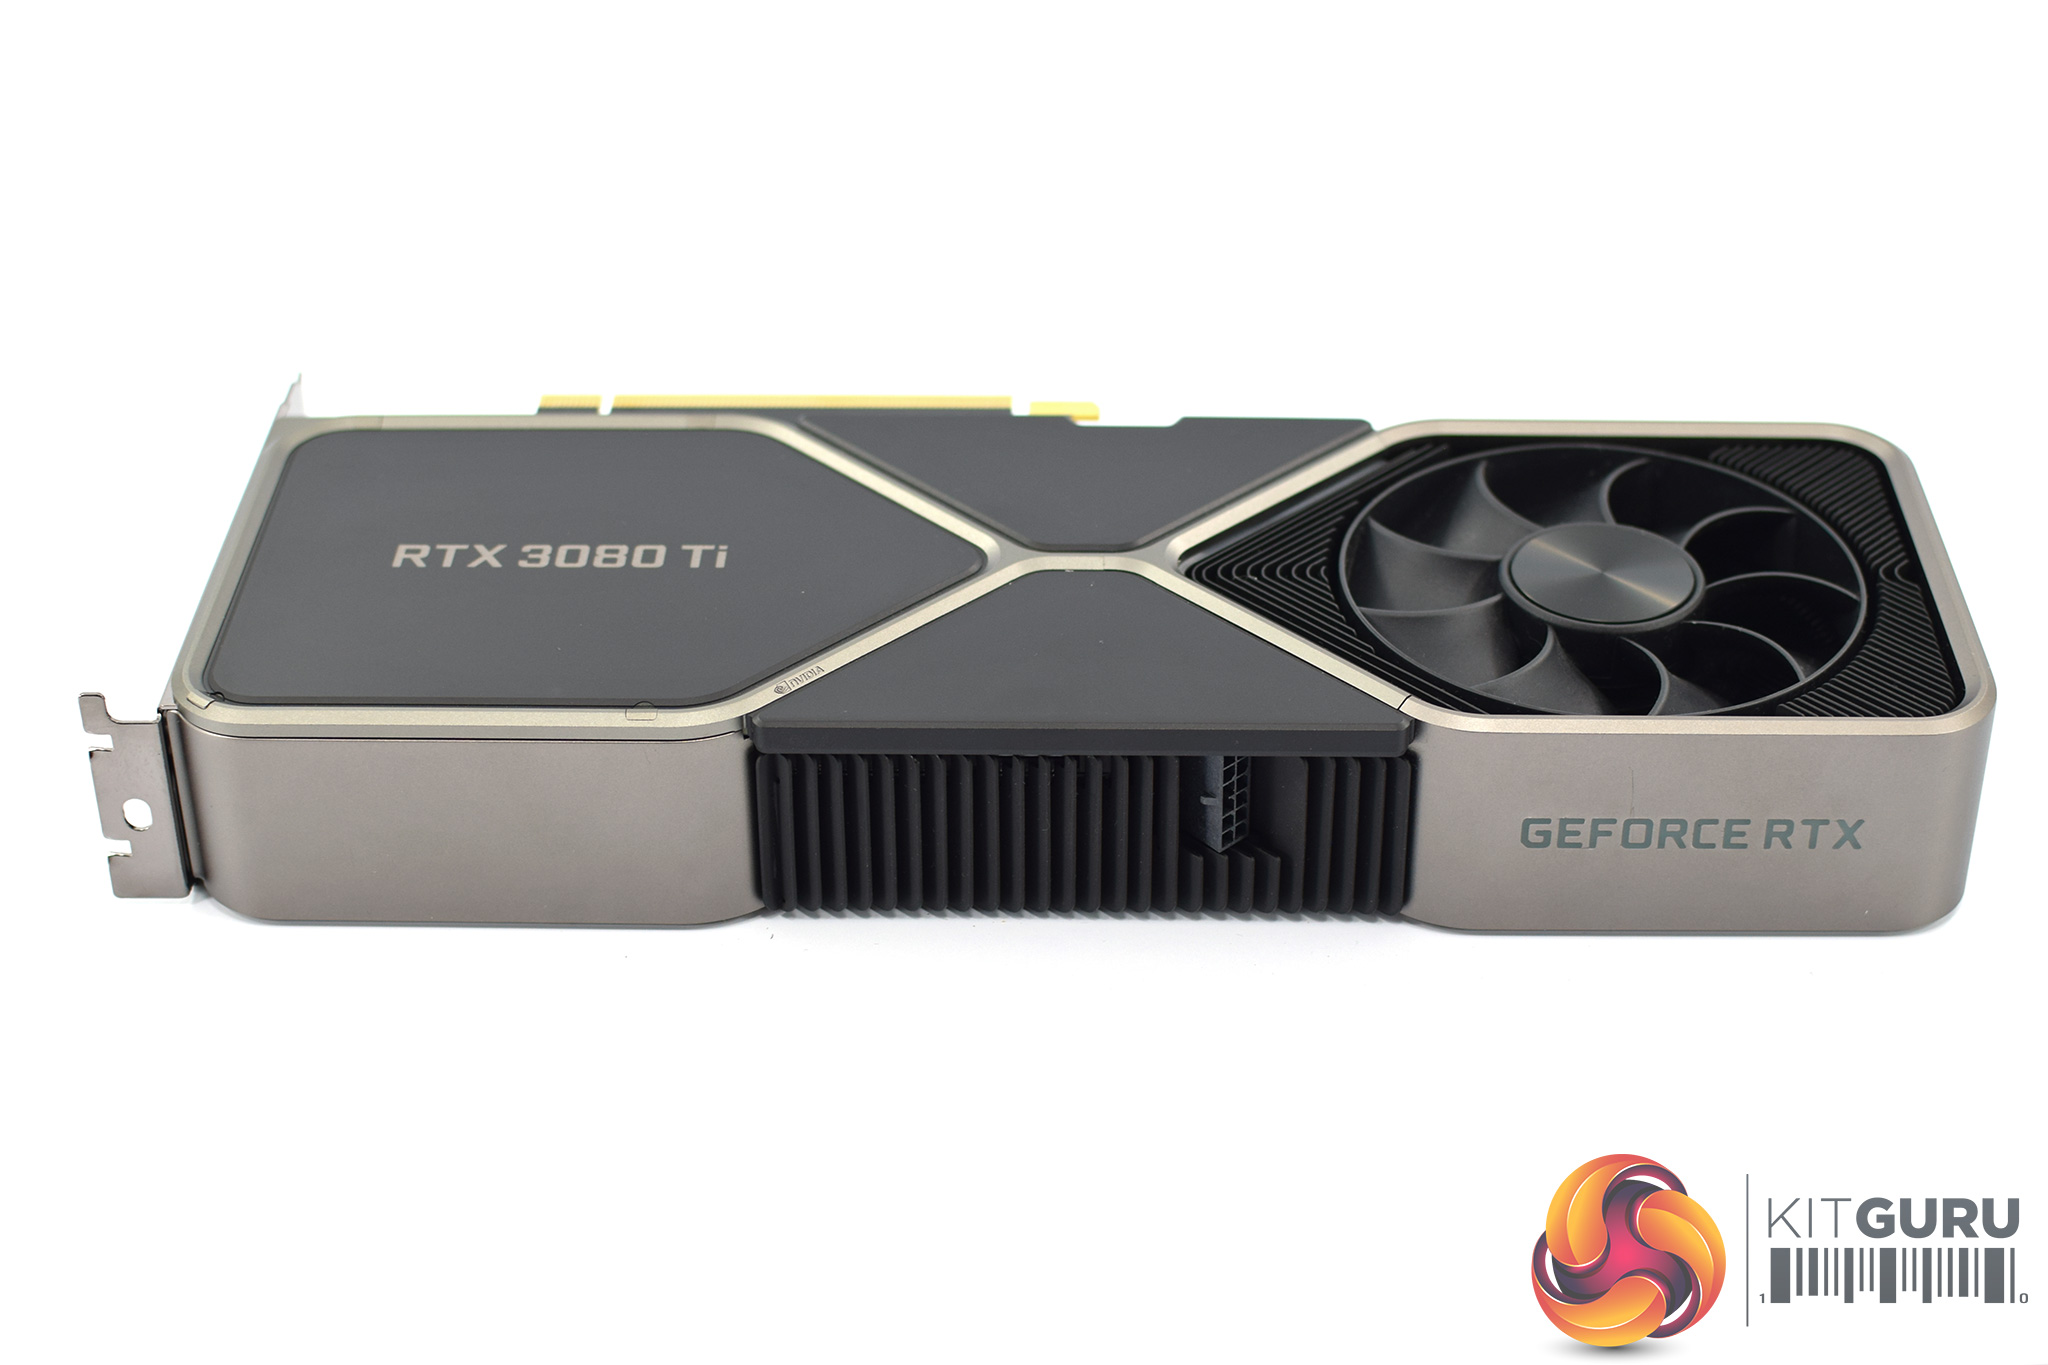
As for the card itself, Nvidia is re-using the same cooler as the RTX 3080 Founders Edition. My immediate thought was what the implication would be for thermals, as the RTX 3080 is a 320W GPU compare to the 350W TGP rating of the RTX 3080 Ti. We test thermal performance later in the review, but suffice to say I have no complaints.
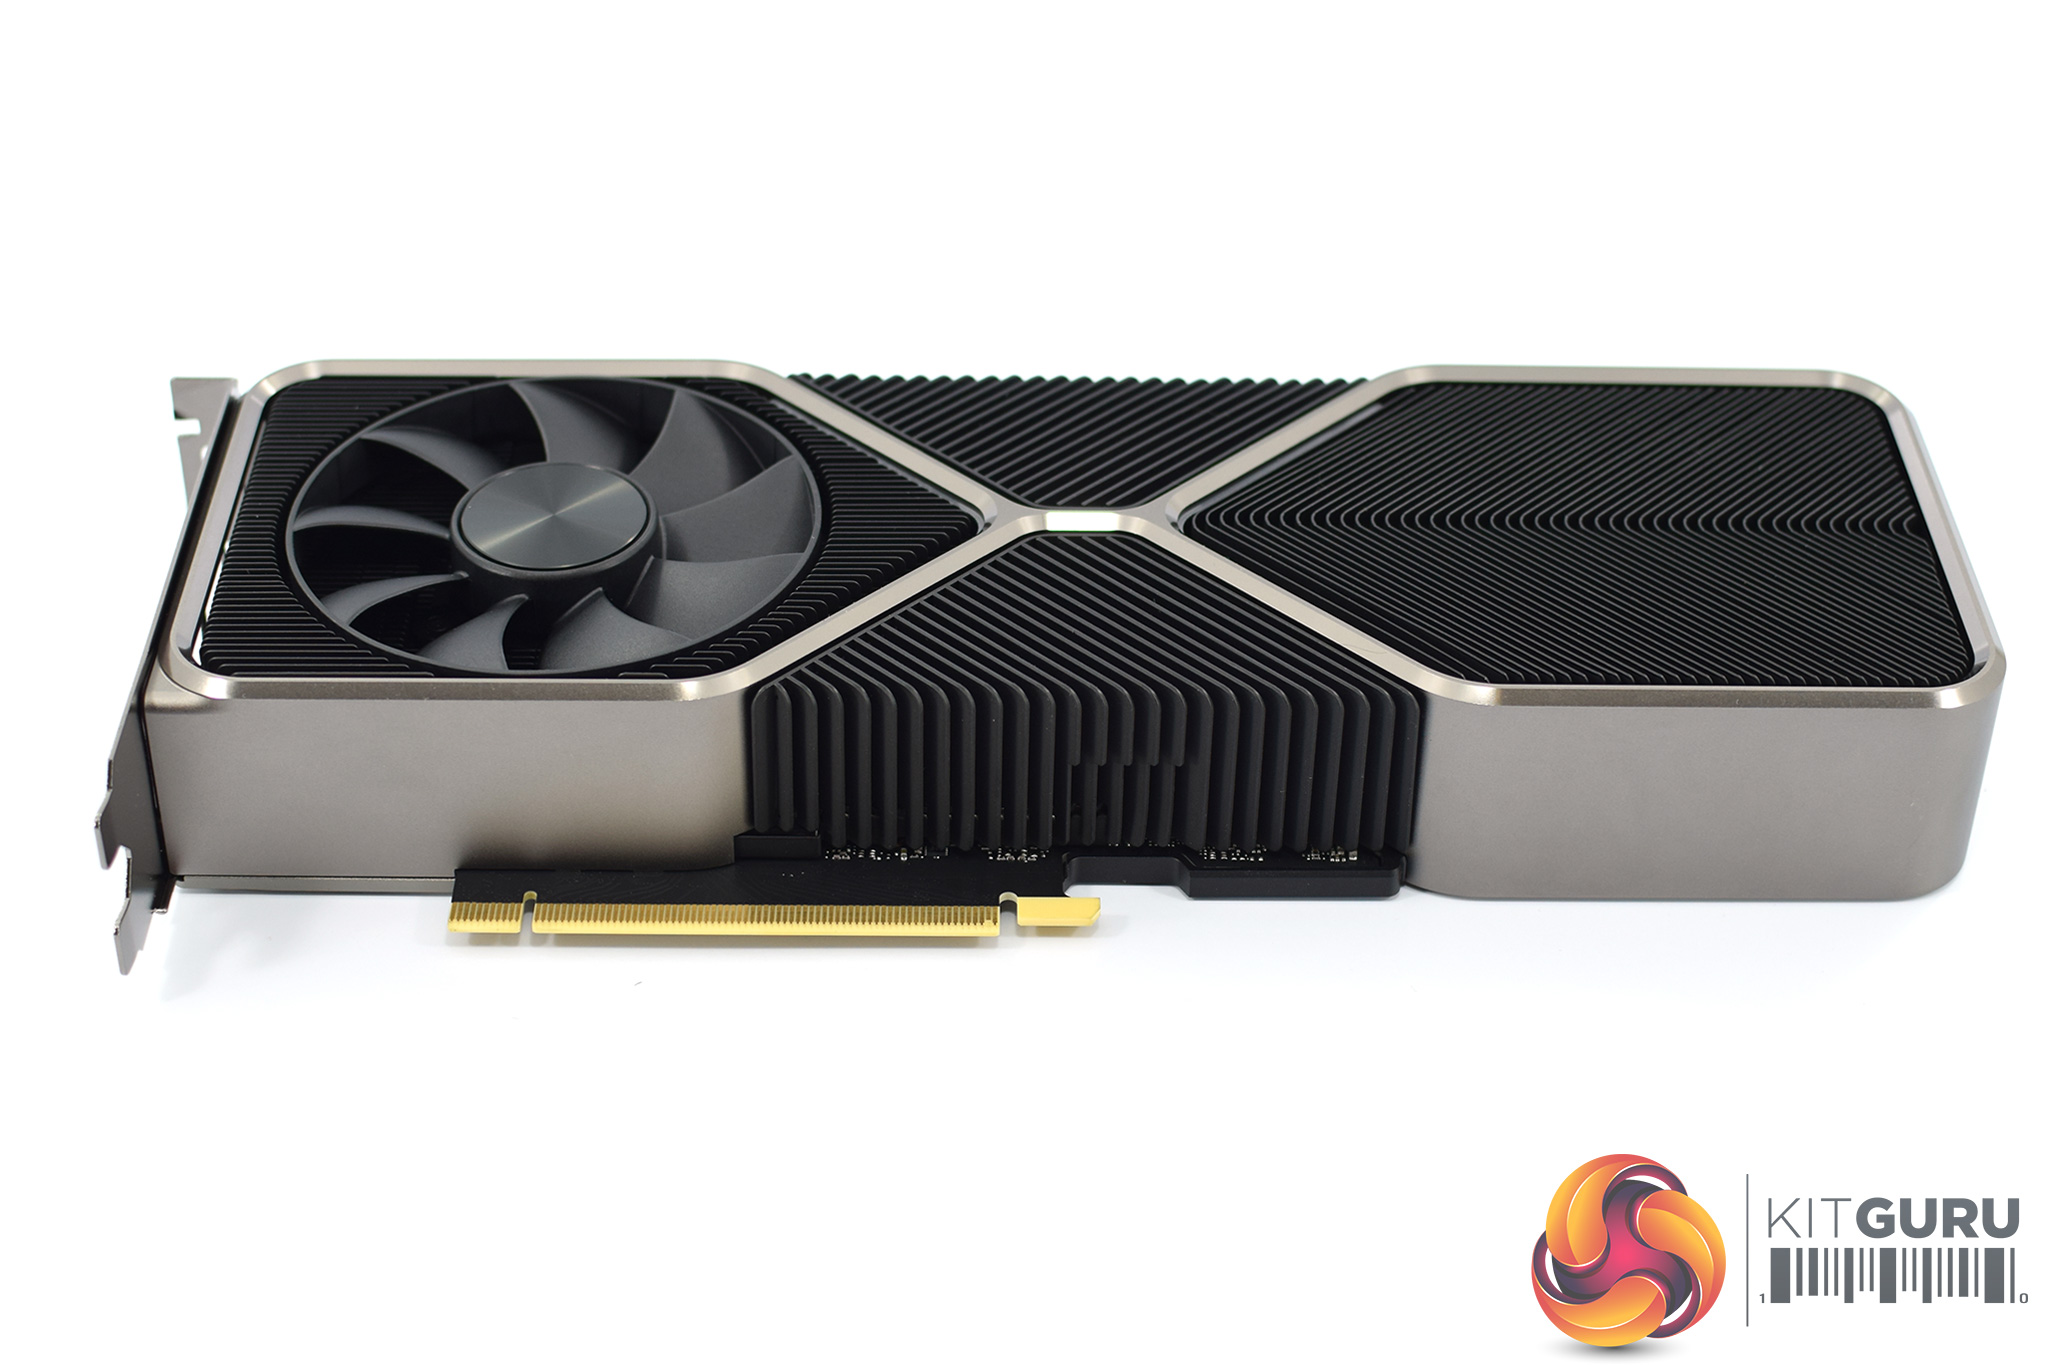
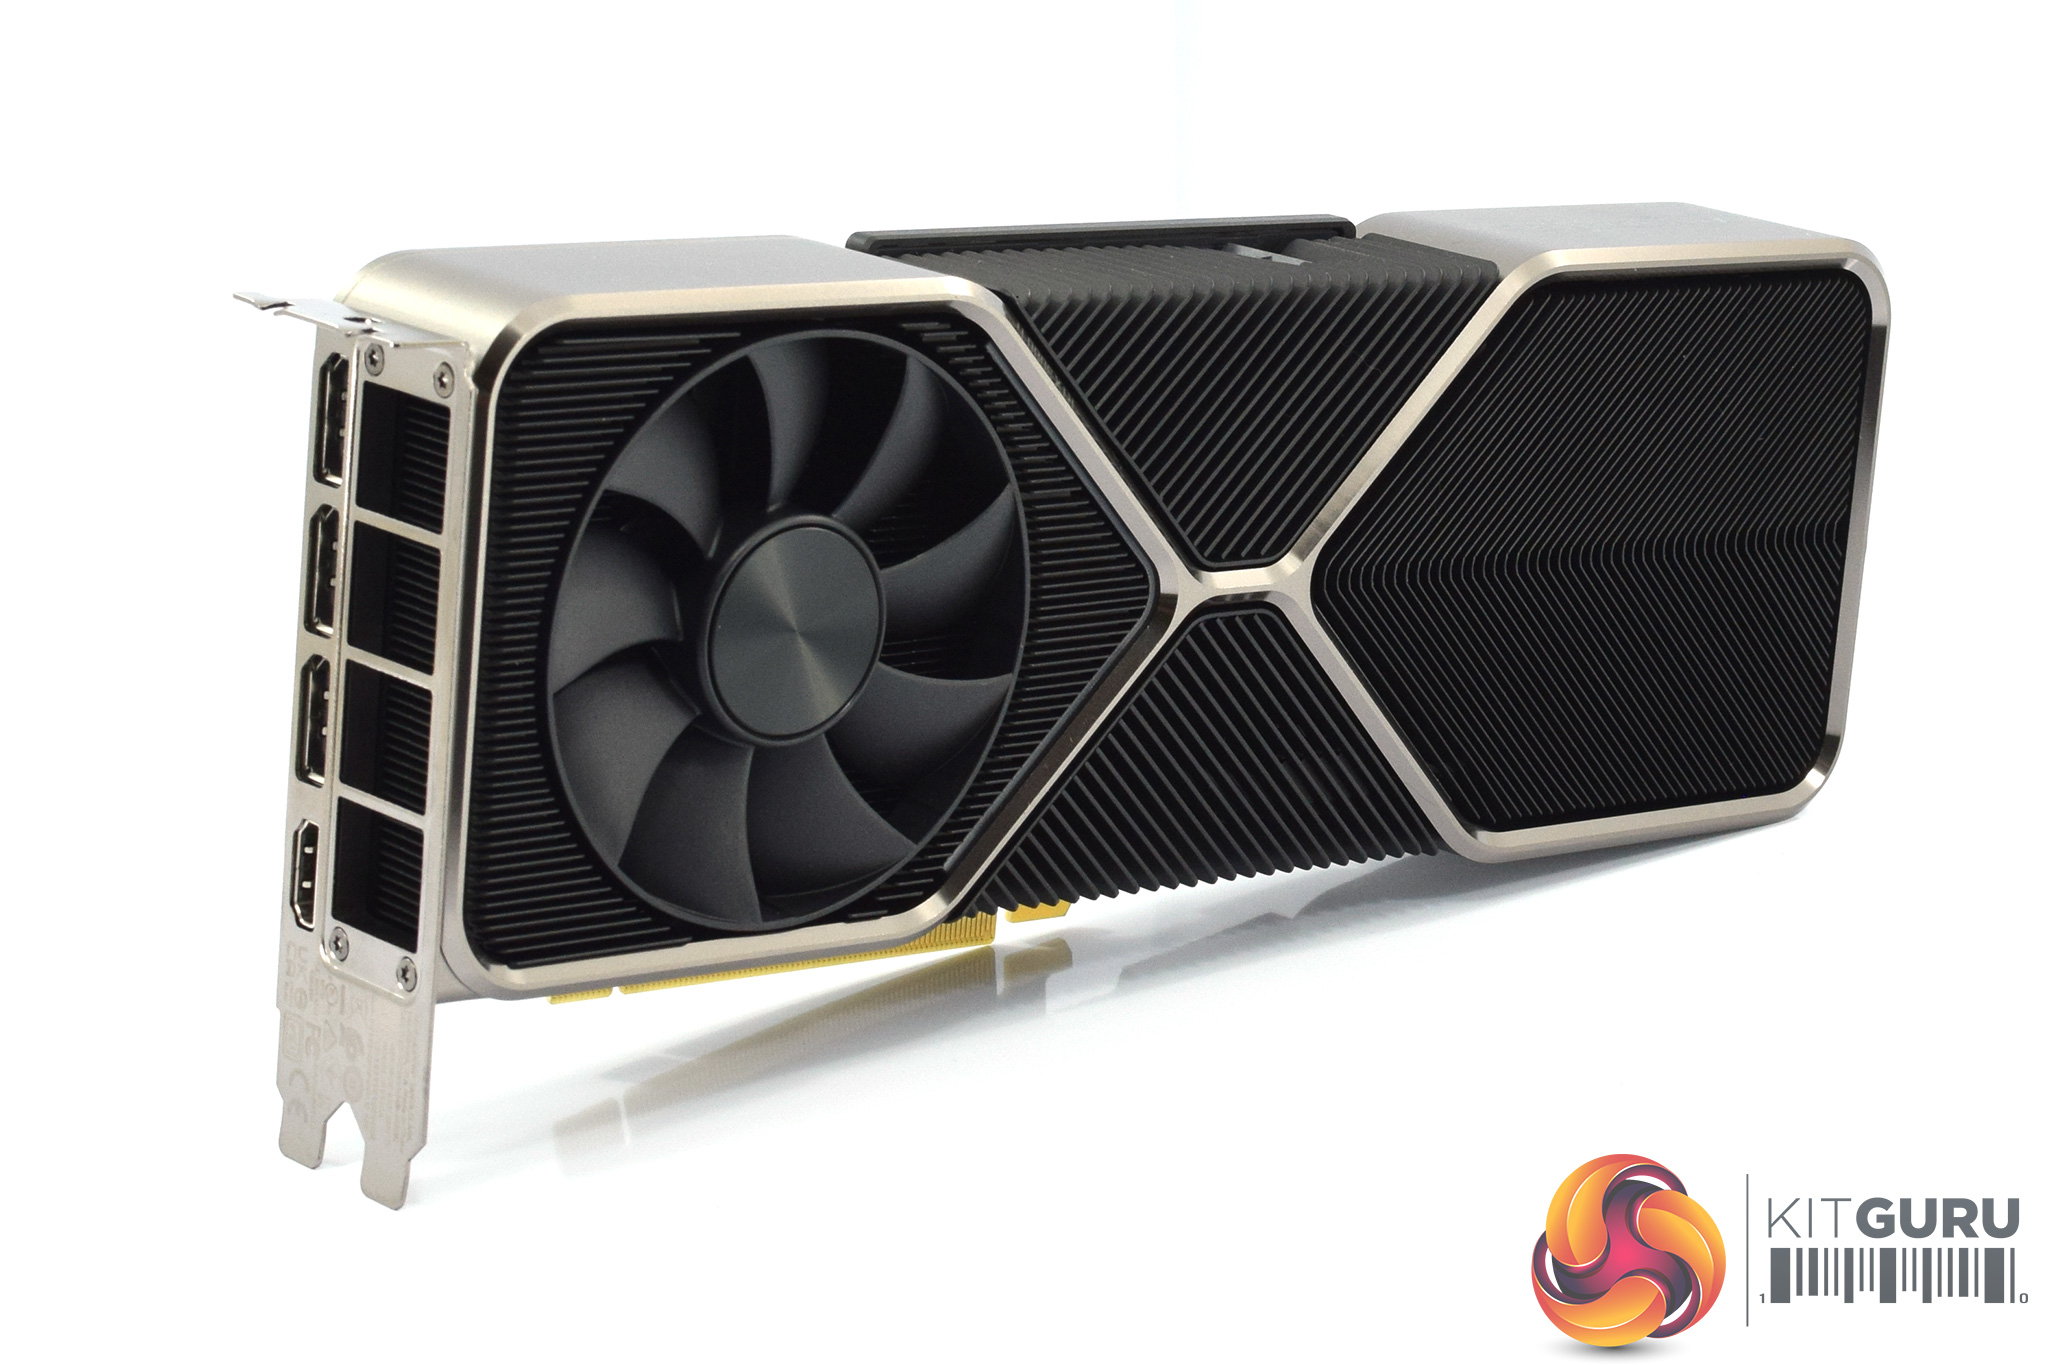
It's a very stylish-looking card overall, with some industrial-looking black fins set inside a gunmetal grey unibody frame. In terms of dimensions, it measures in at 285mm long and 112mm wide, with a standard dual-slot thickness.
The fan layout remains unchanged from the RTX 3080 too. This means one 85mm on the underside of the card pushes air through the heatsink and straight out of the case via the I/O bracket. The fan on the top of the card, next to the backplate, pulls air through the heatsink and exhausts it out into the CPU/memory area of the motherboard/chassis, where the system’s exhaust fans can expel the heat.
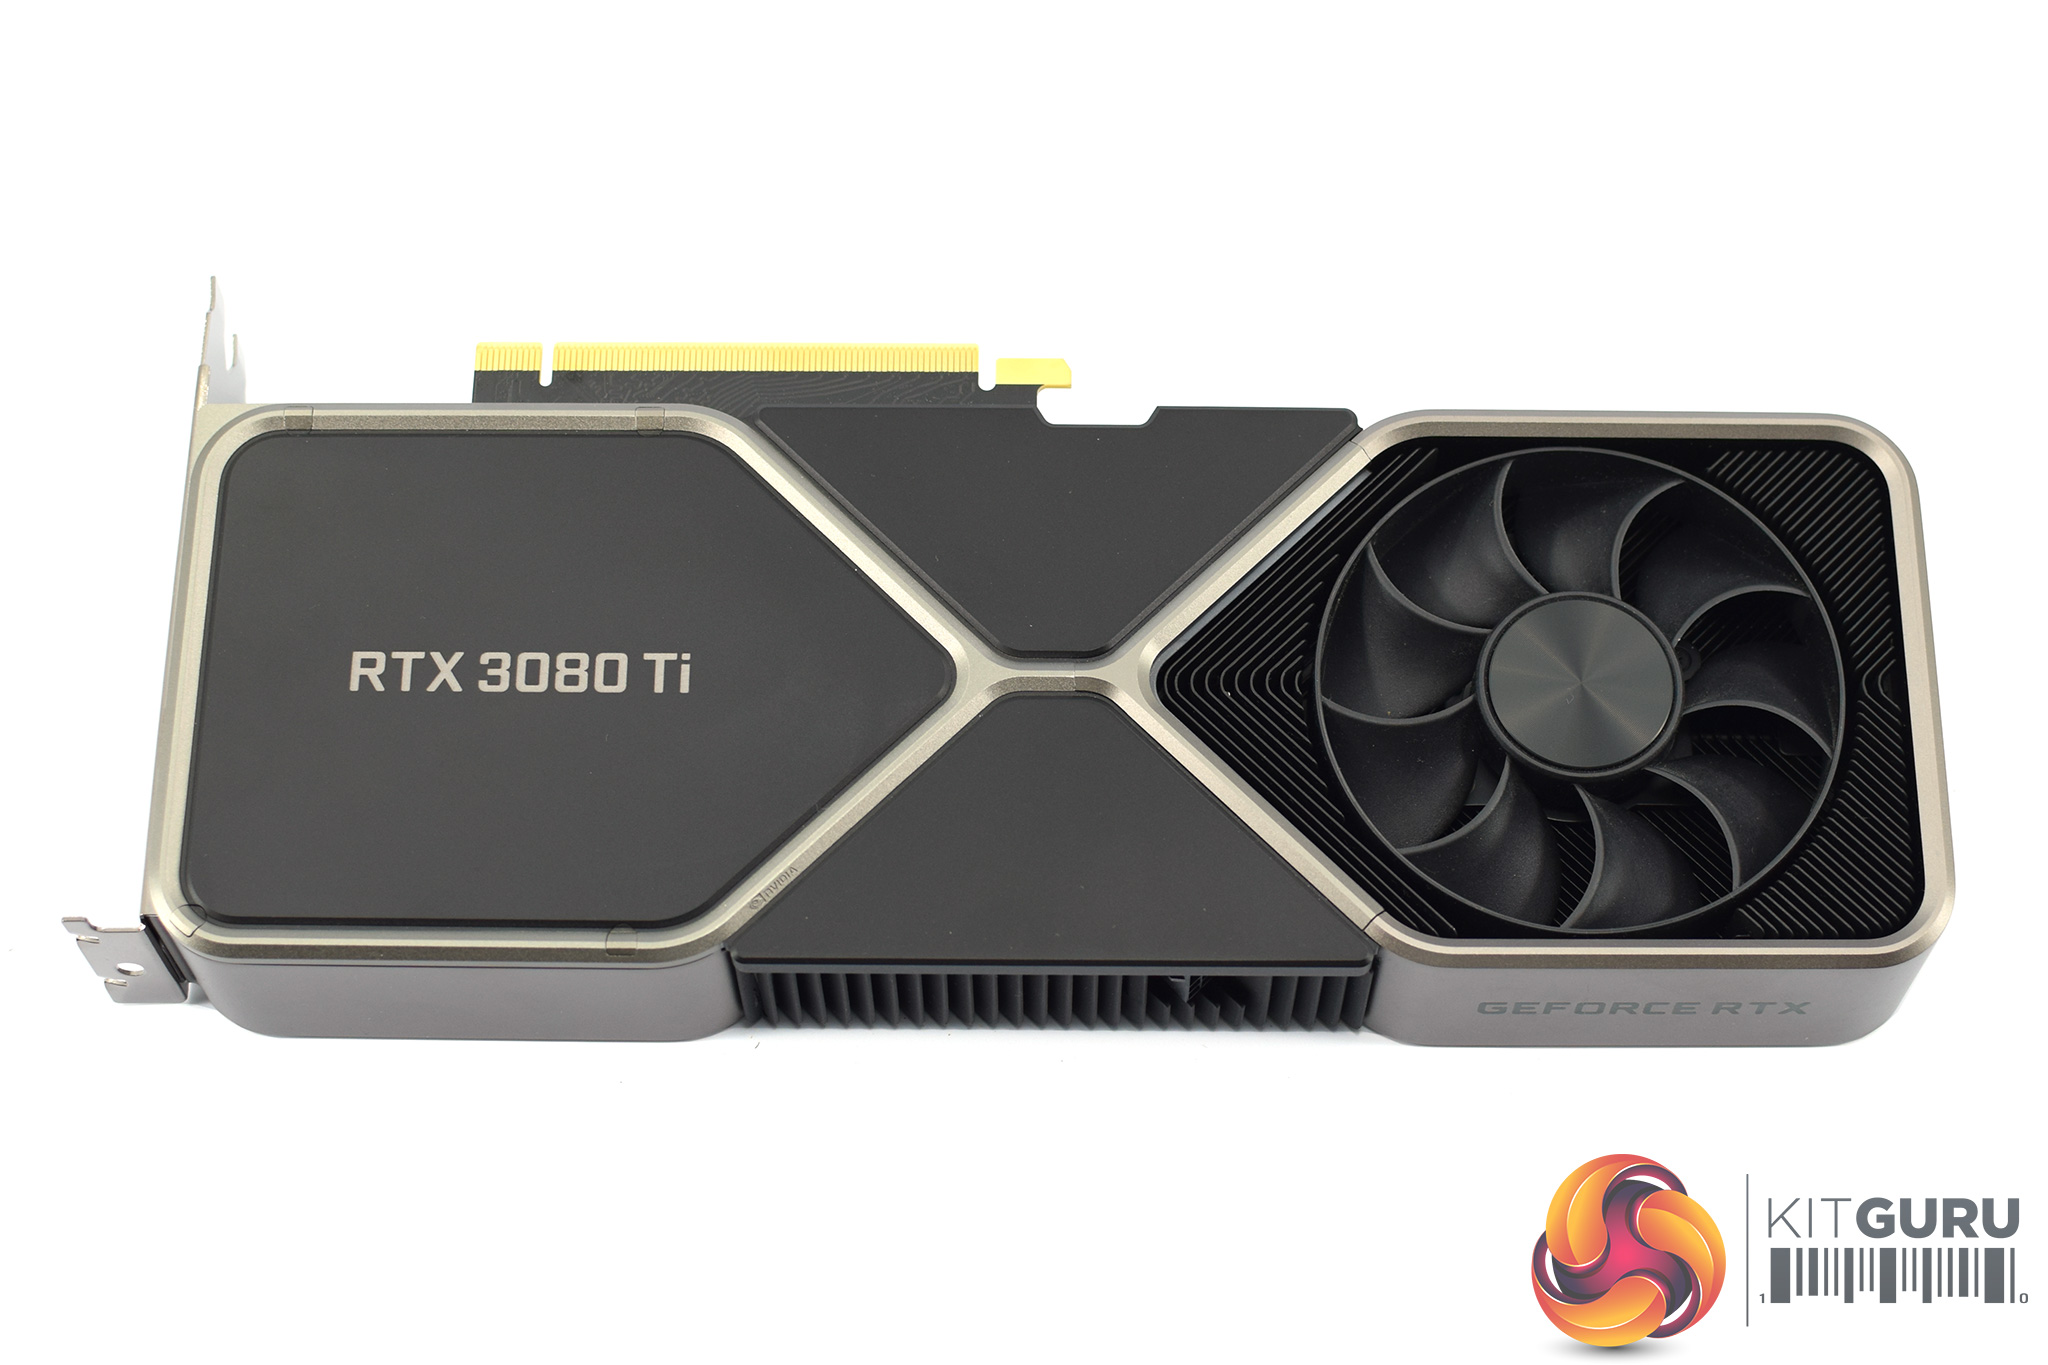
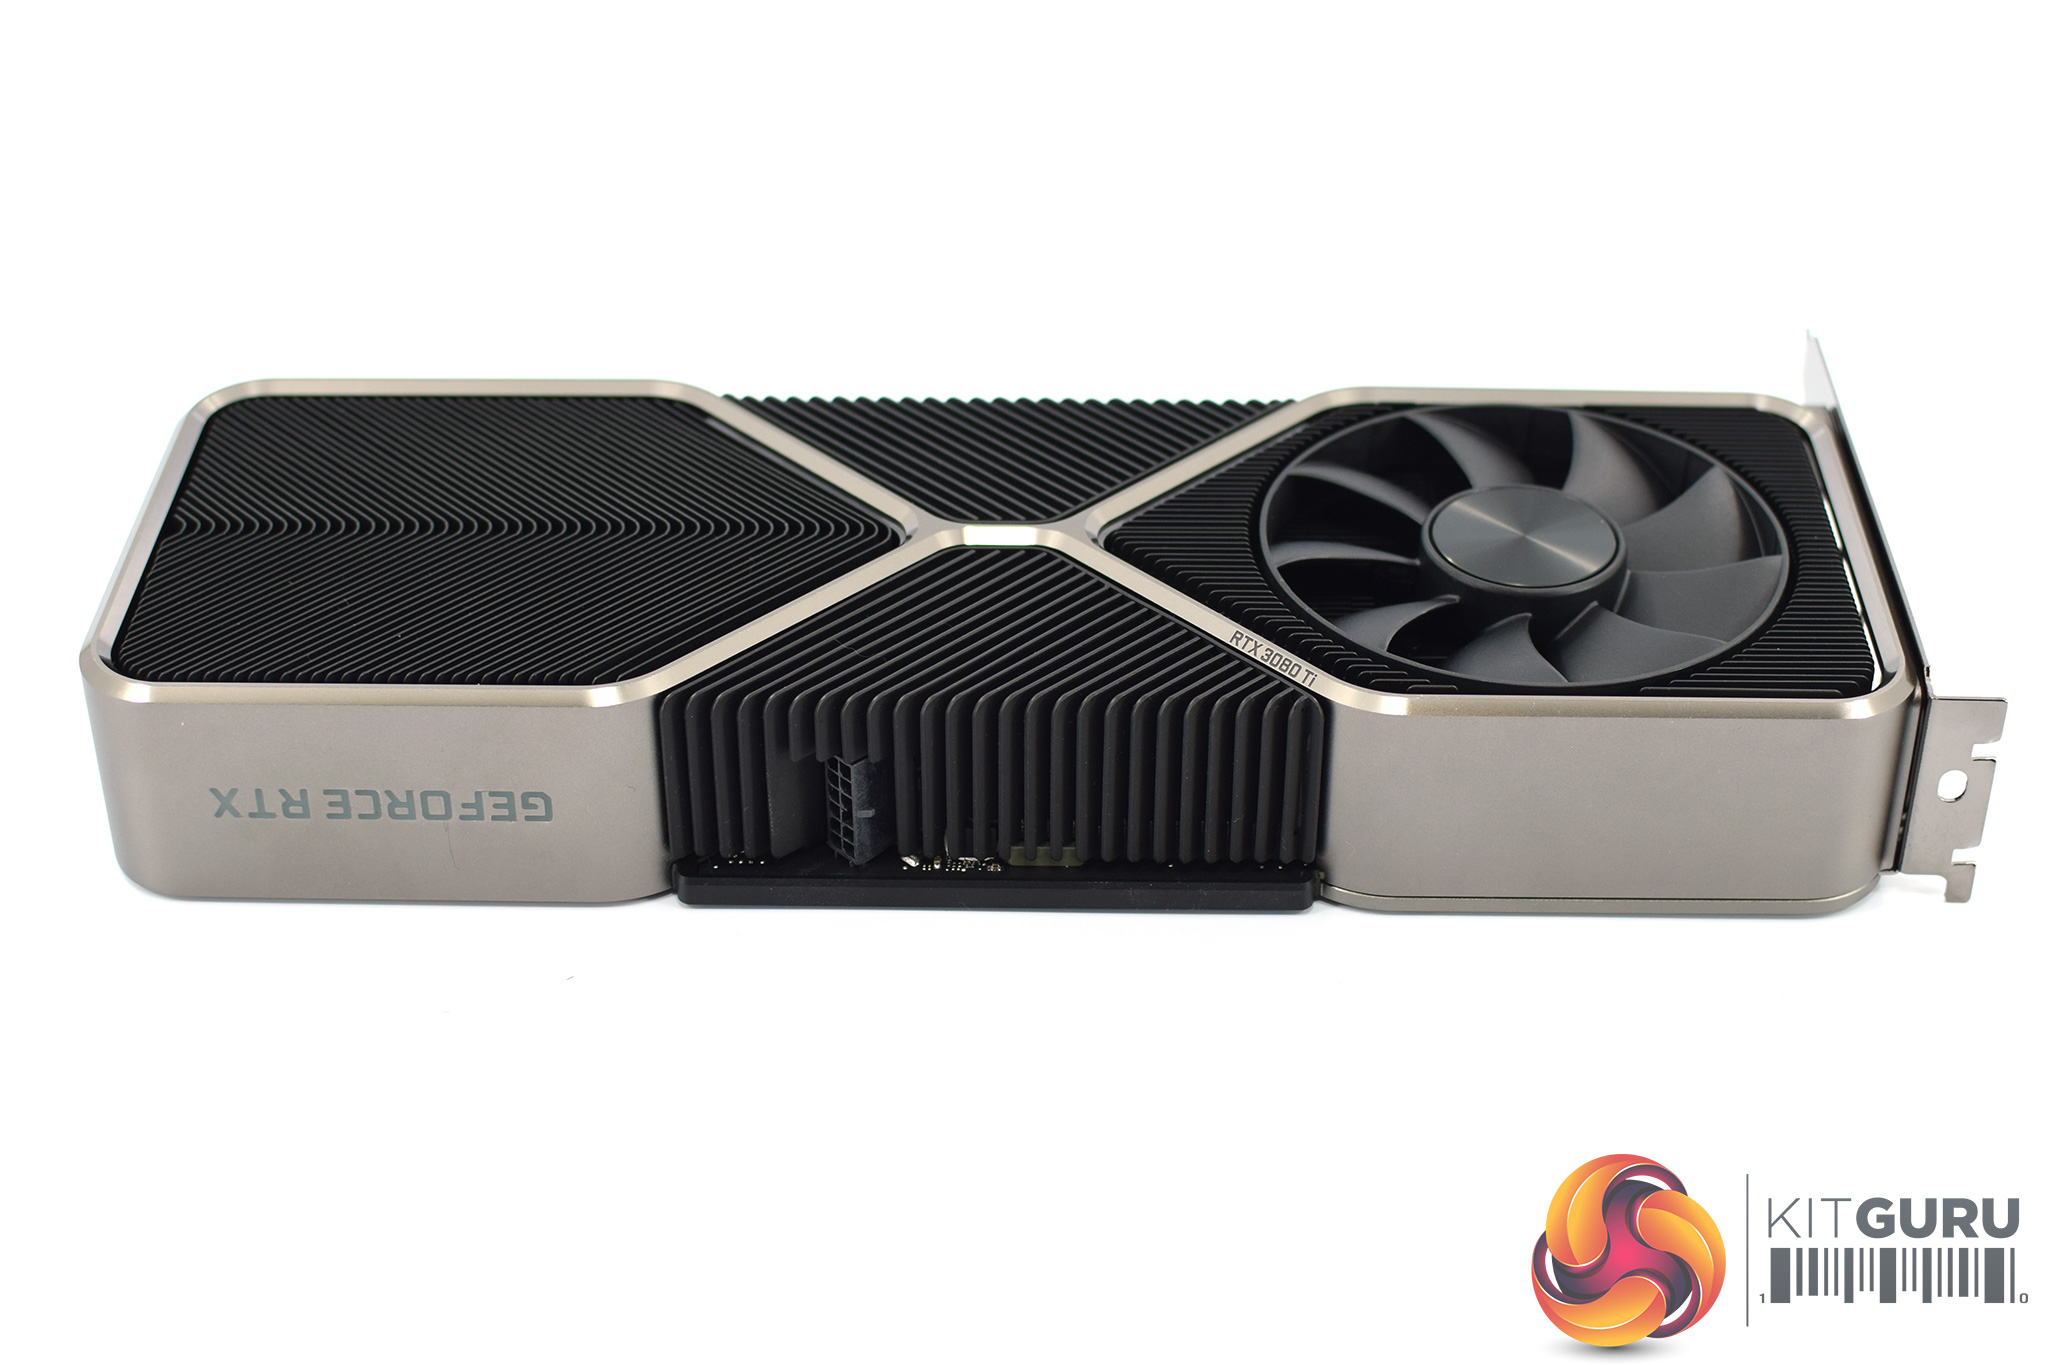
The backplate is more sold metal, with a silver ‘x-shaped' cross section in the middle. The RTX 3080 Ti branding is also printed on the section closest to the I/O bracket, while the fan obviously takes up the right-hand side of the card.
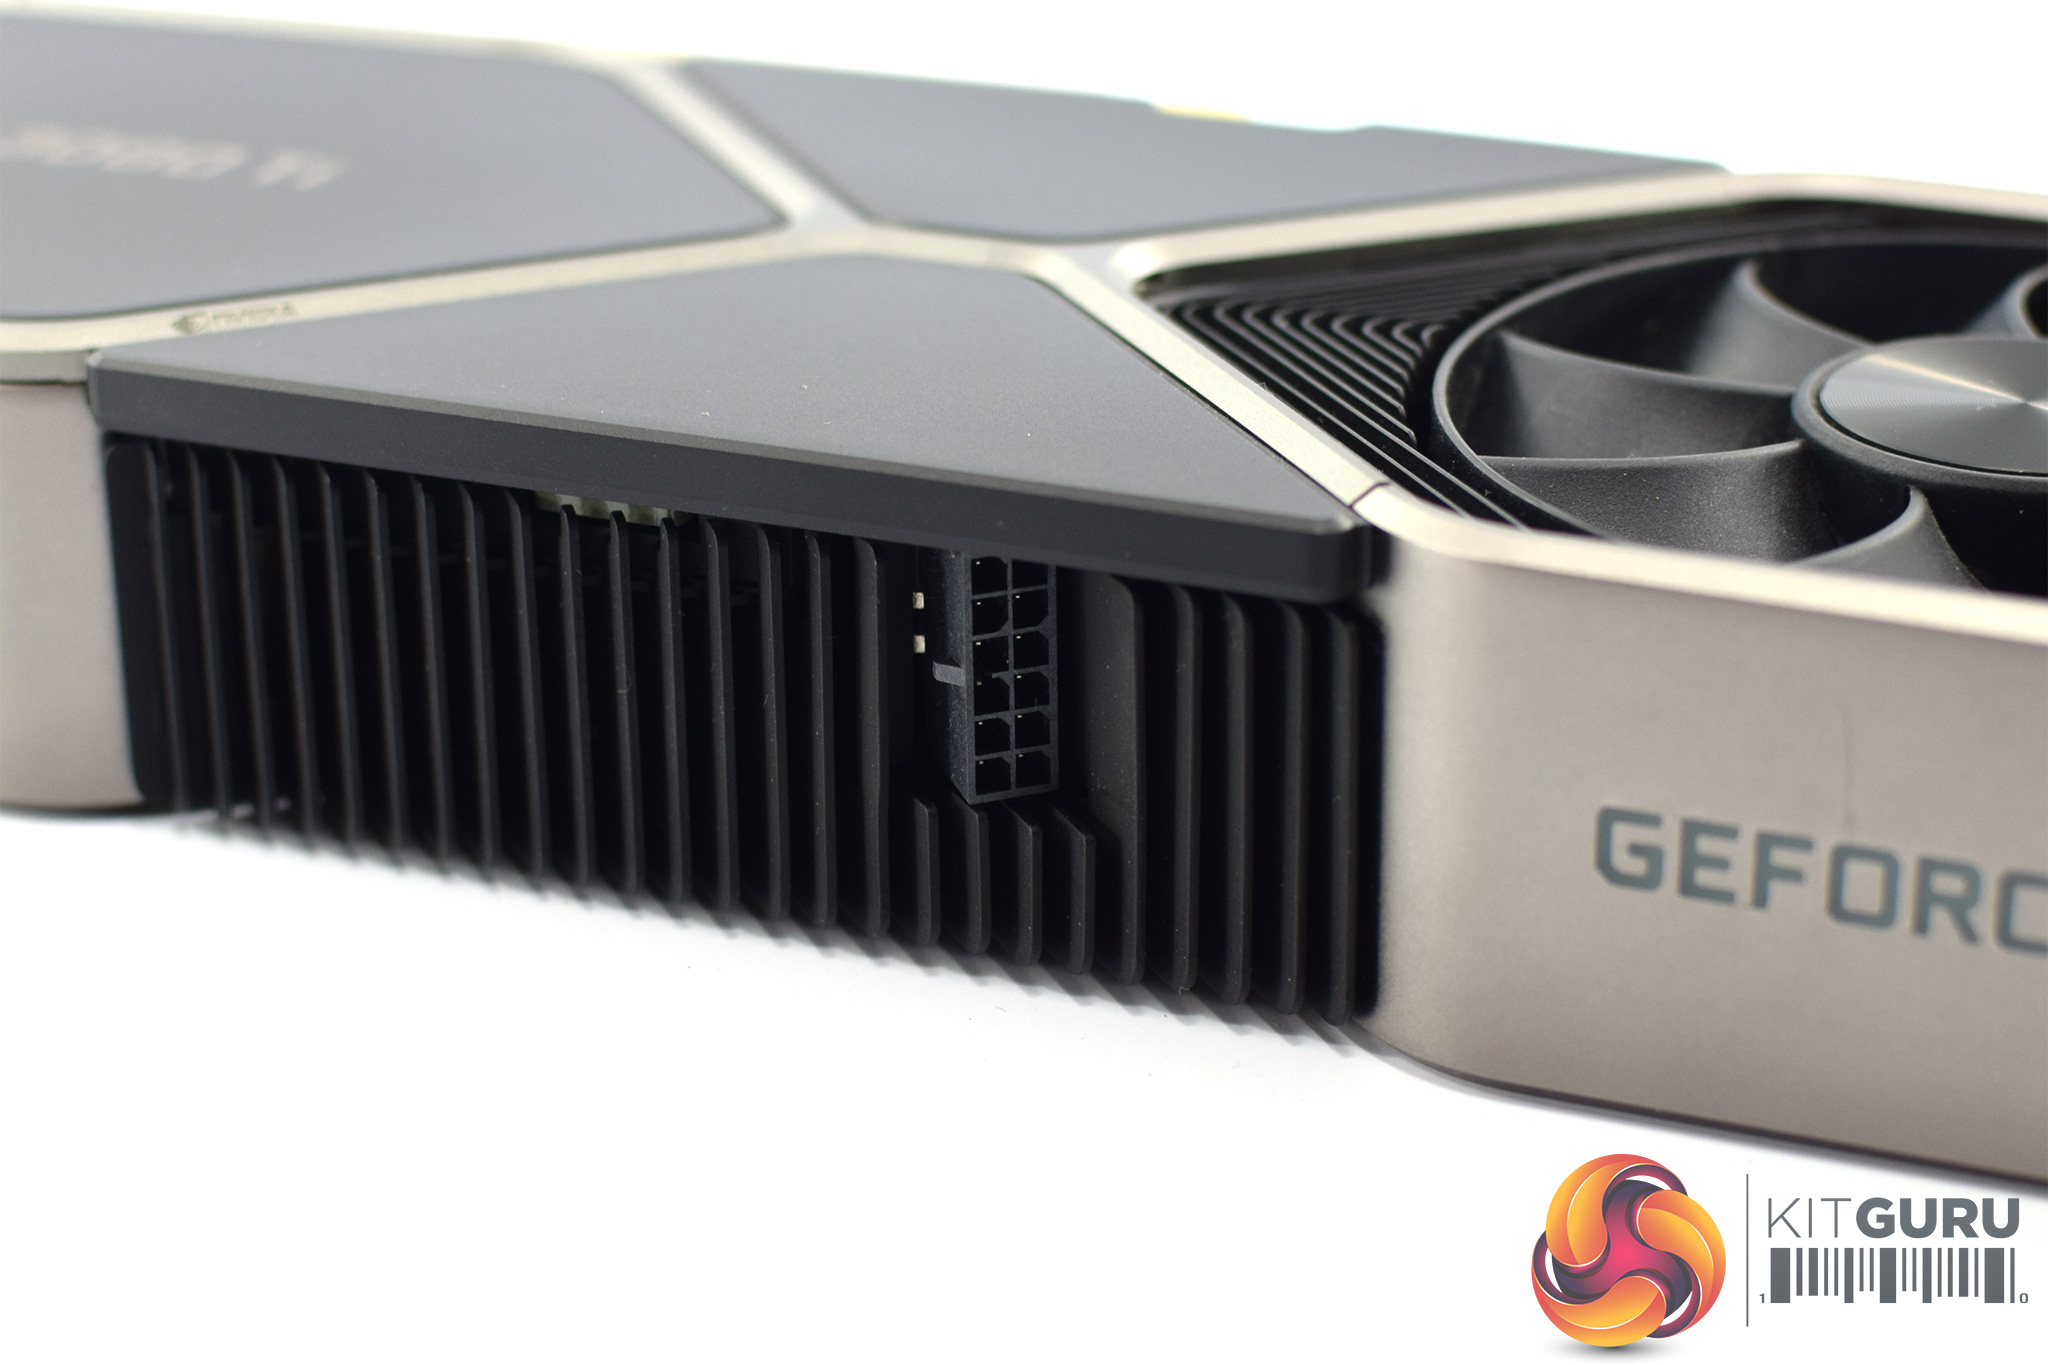
As we already mentioned, Nvidia is sticking to the 12-pin connector with the RTX 3080 Ti Founders Edition. Other partner cards however will be using the more traditional 8-pin connectors, so that's an option if you really don't like the 12-pin.
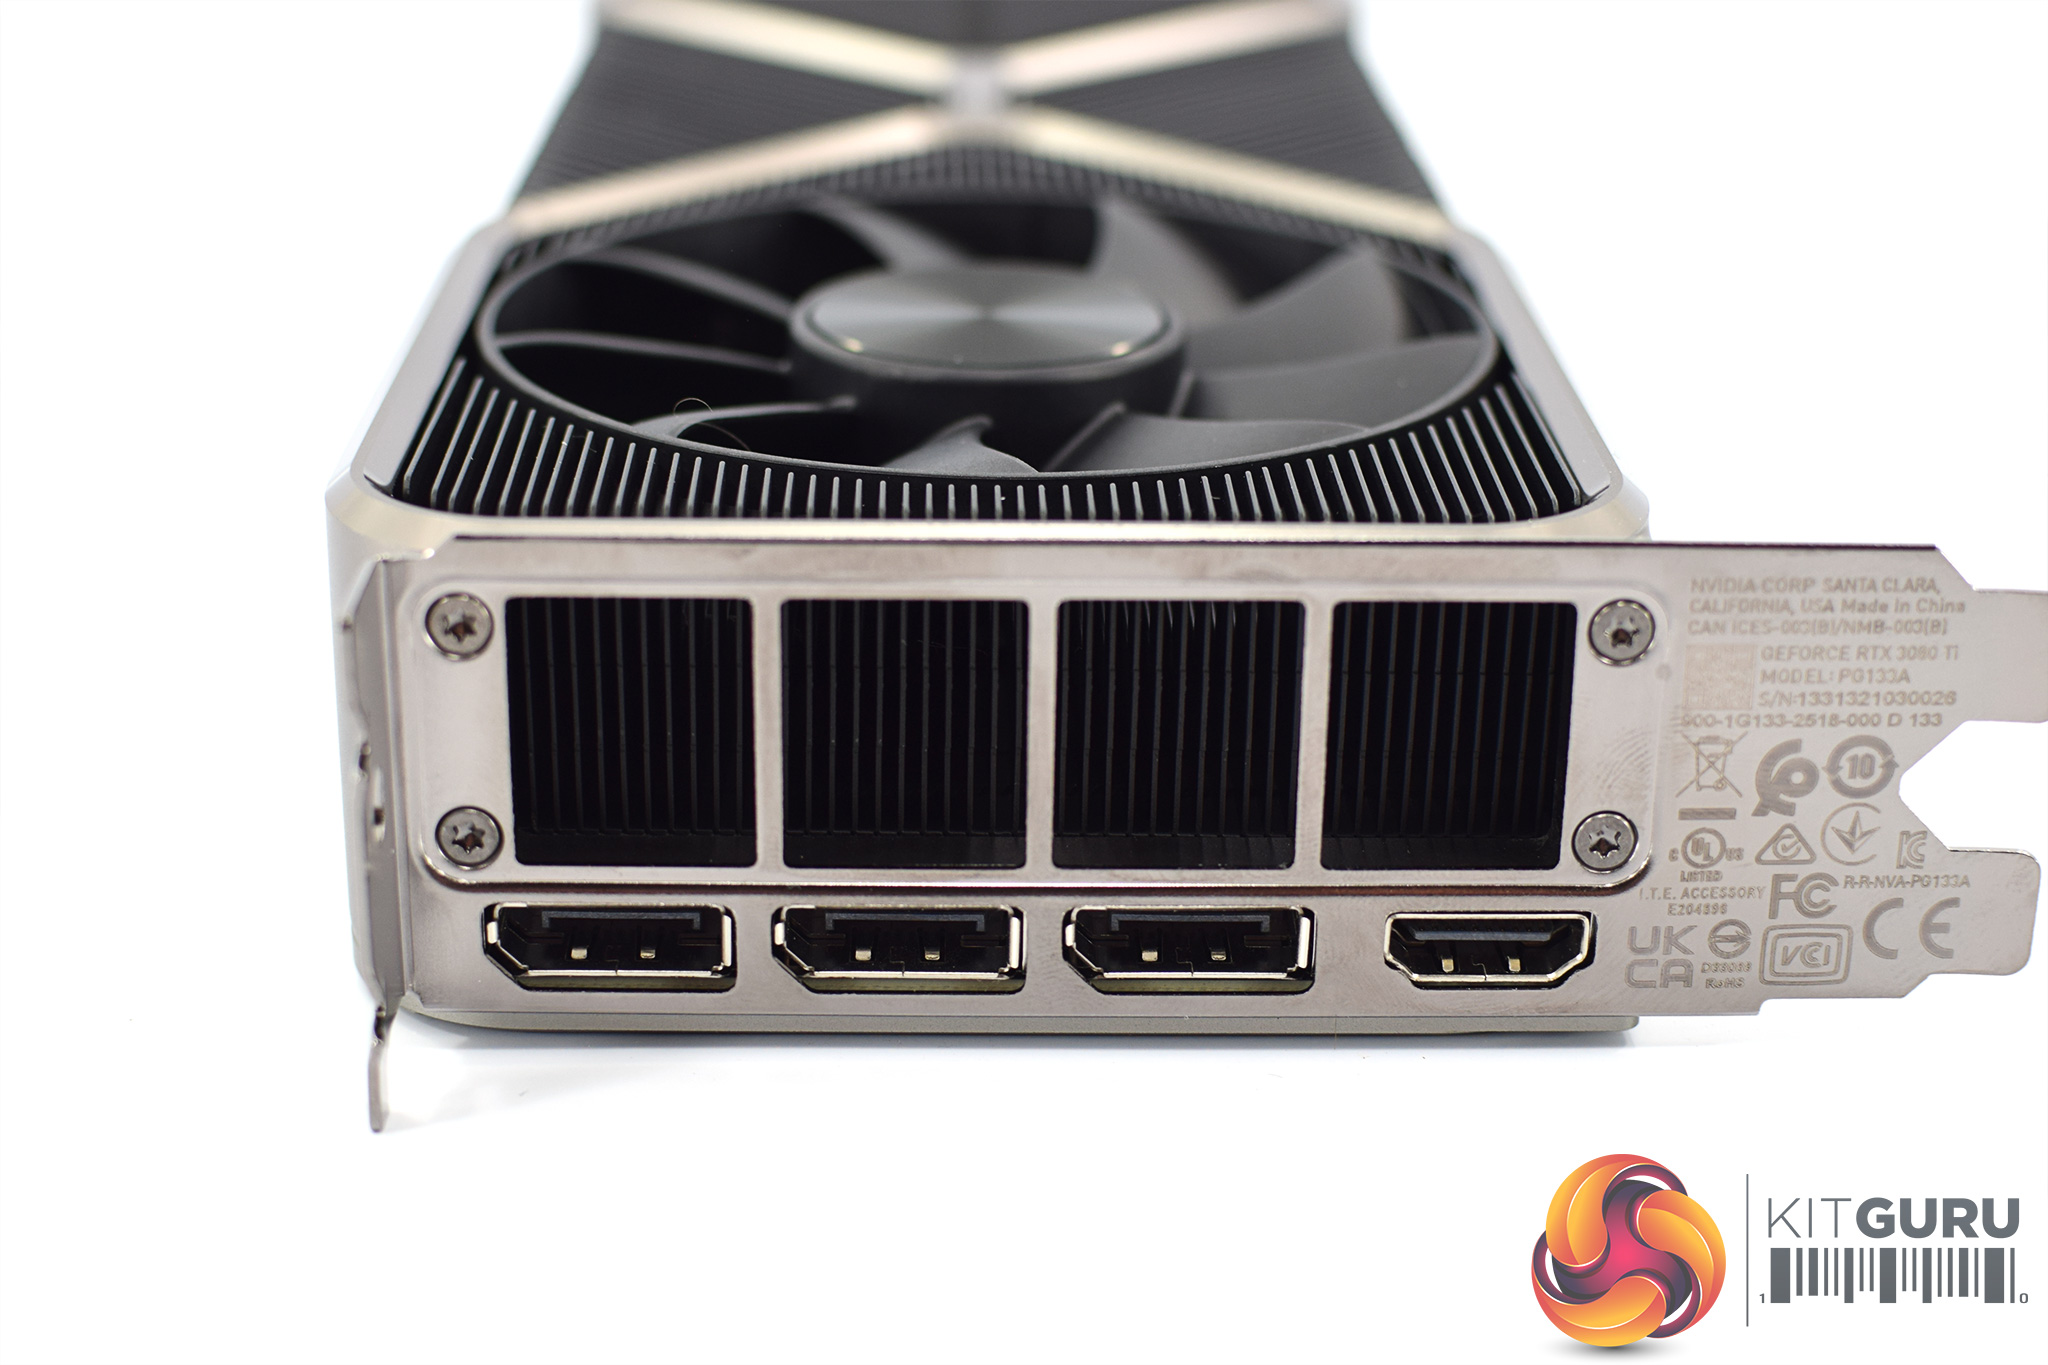
Lastly, video outputs come in the form of 3x DisplayPort 1.4a and 1x HDMI 2.1.
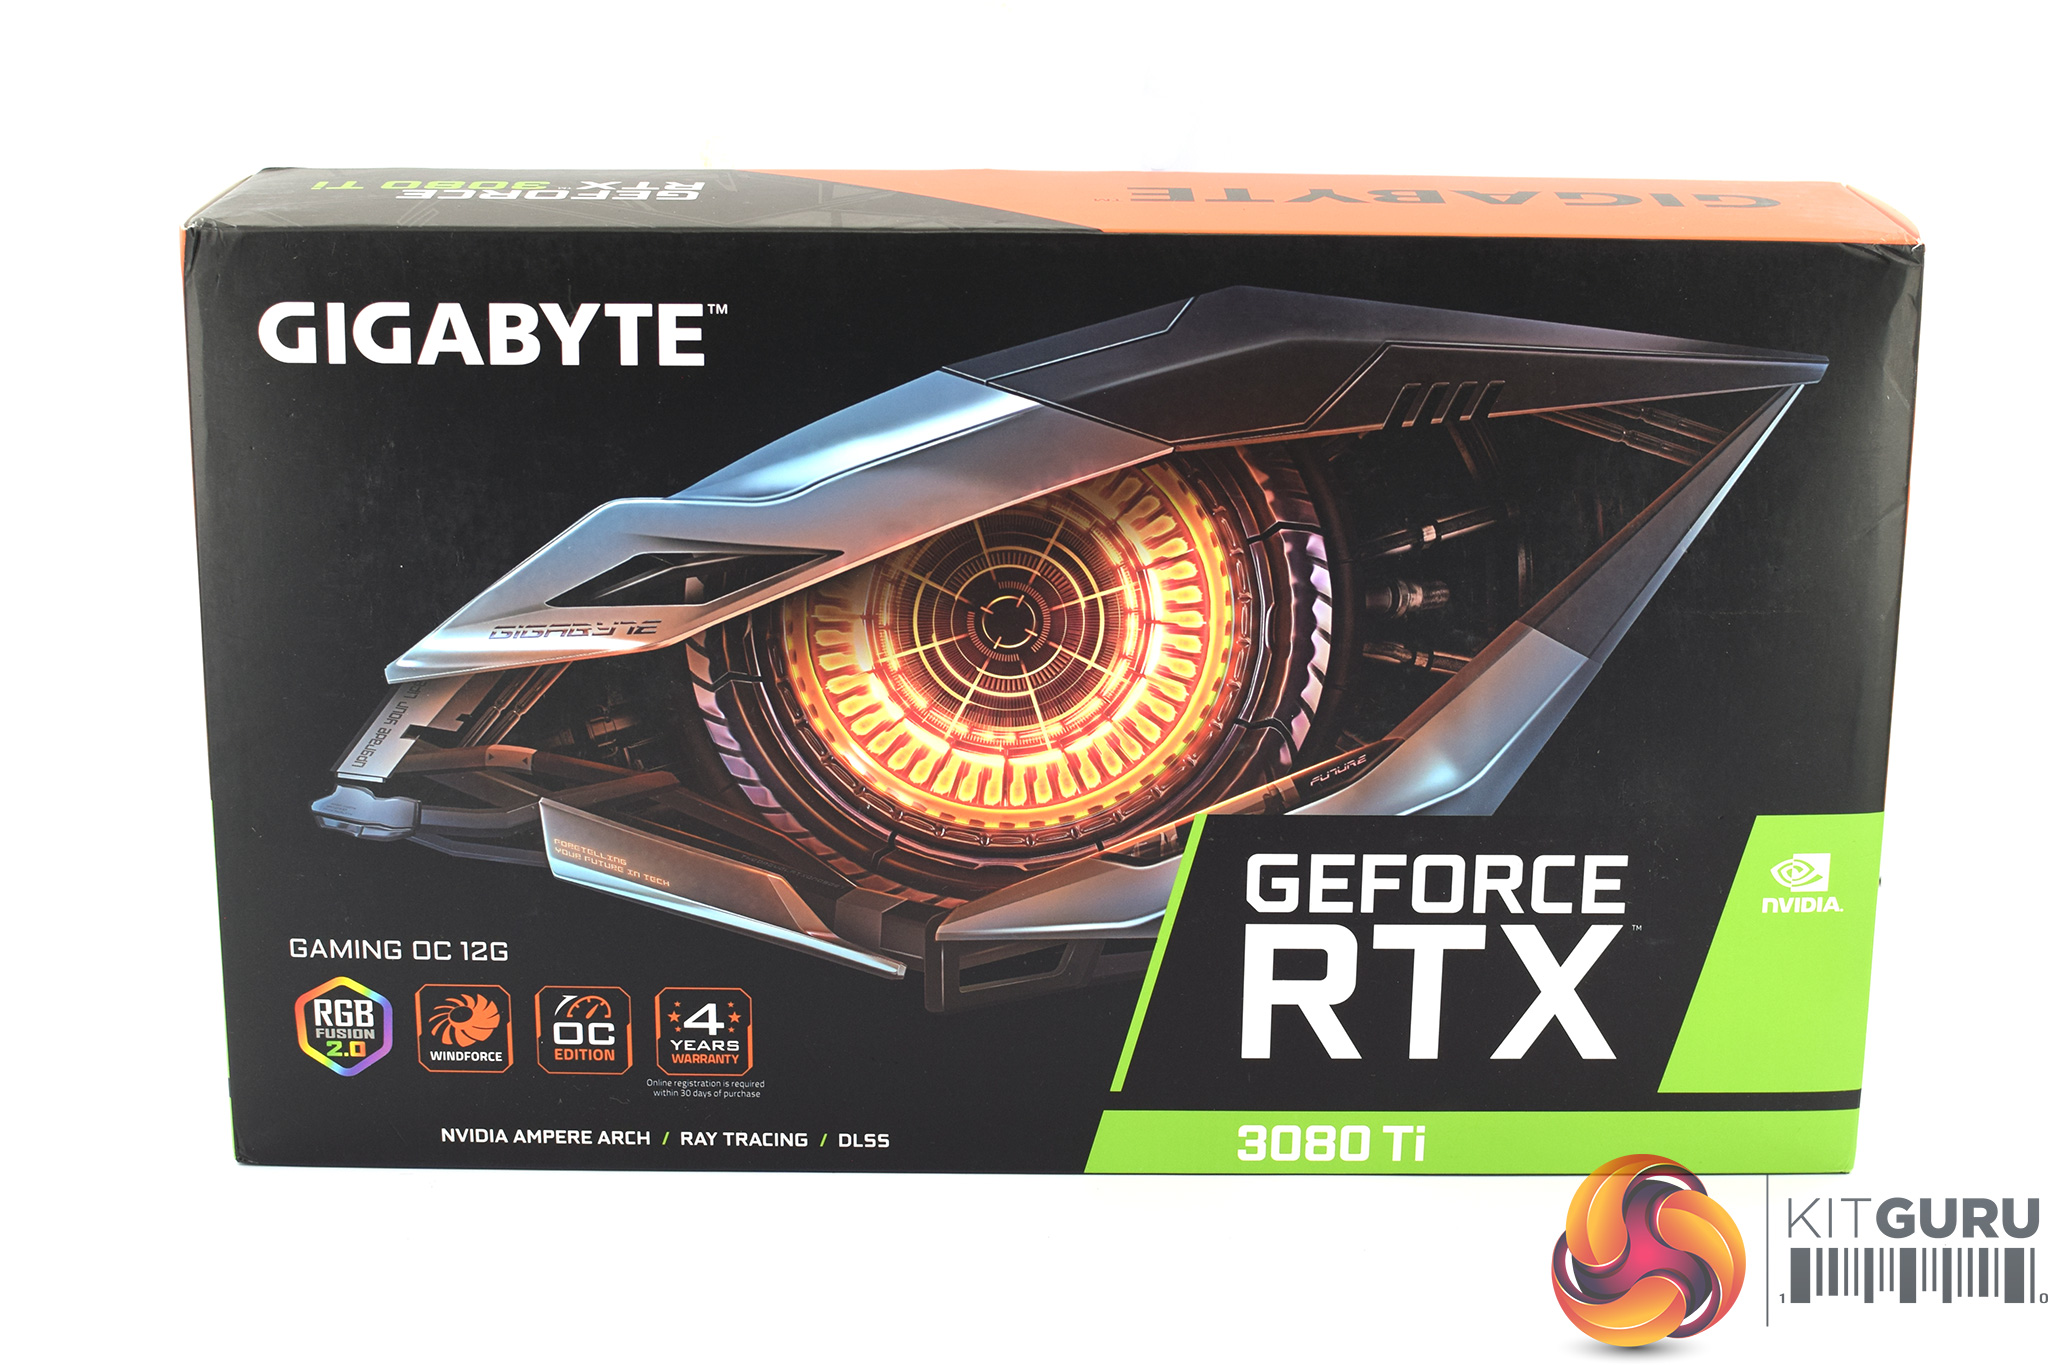
Next is the Gigabyte RTX 3080 Ti Gaming OC. This ships in a very familiar-looking box, with Gigabyte's robotic eye design taking up the front.
Inside, we get a warranty note and a quick start guide.
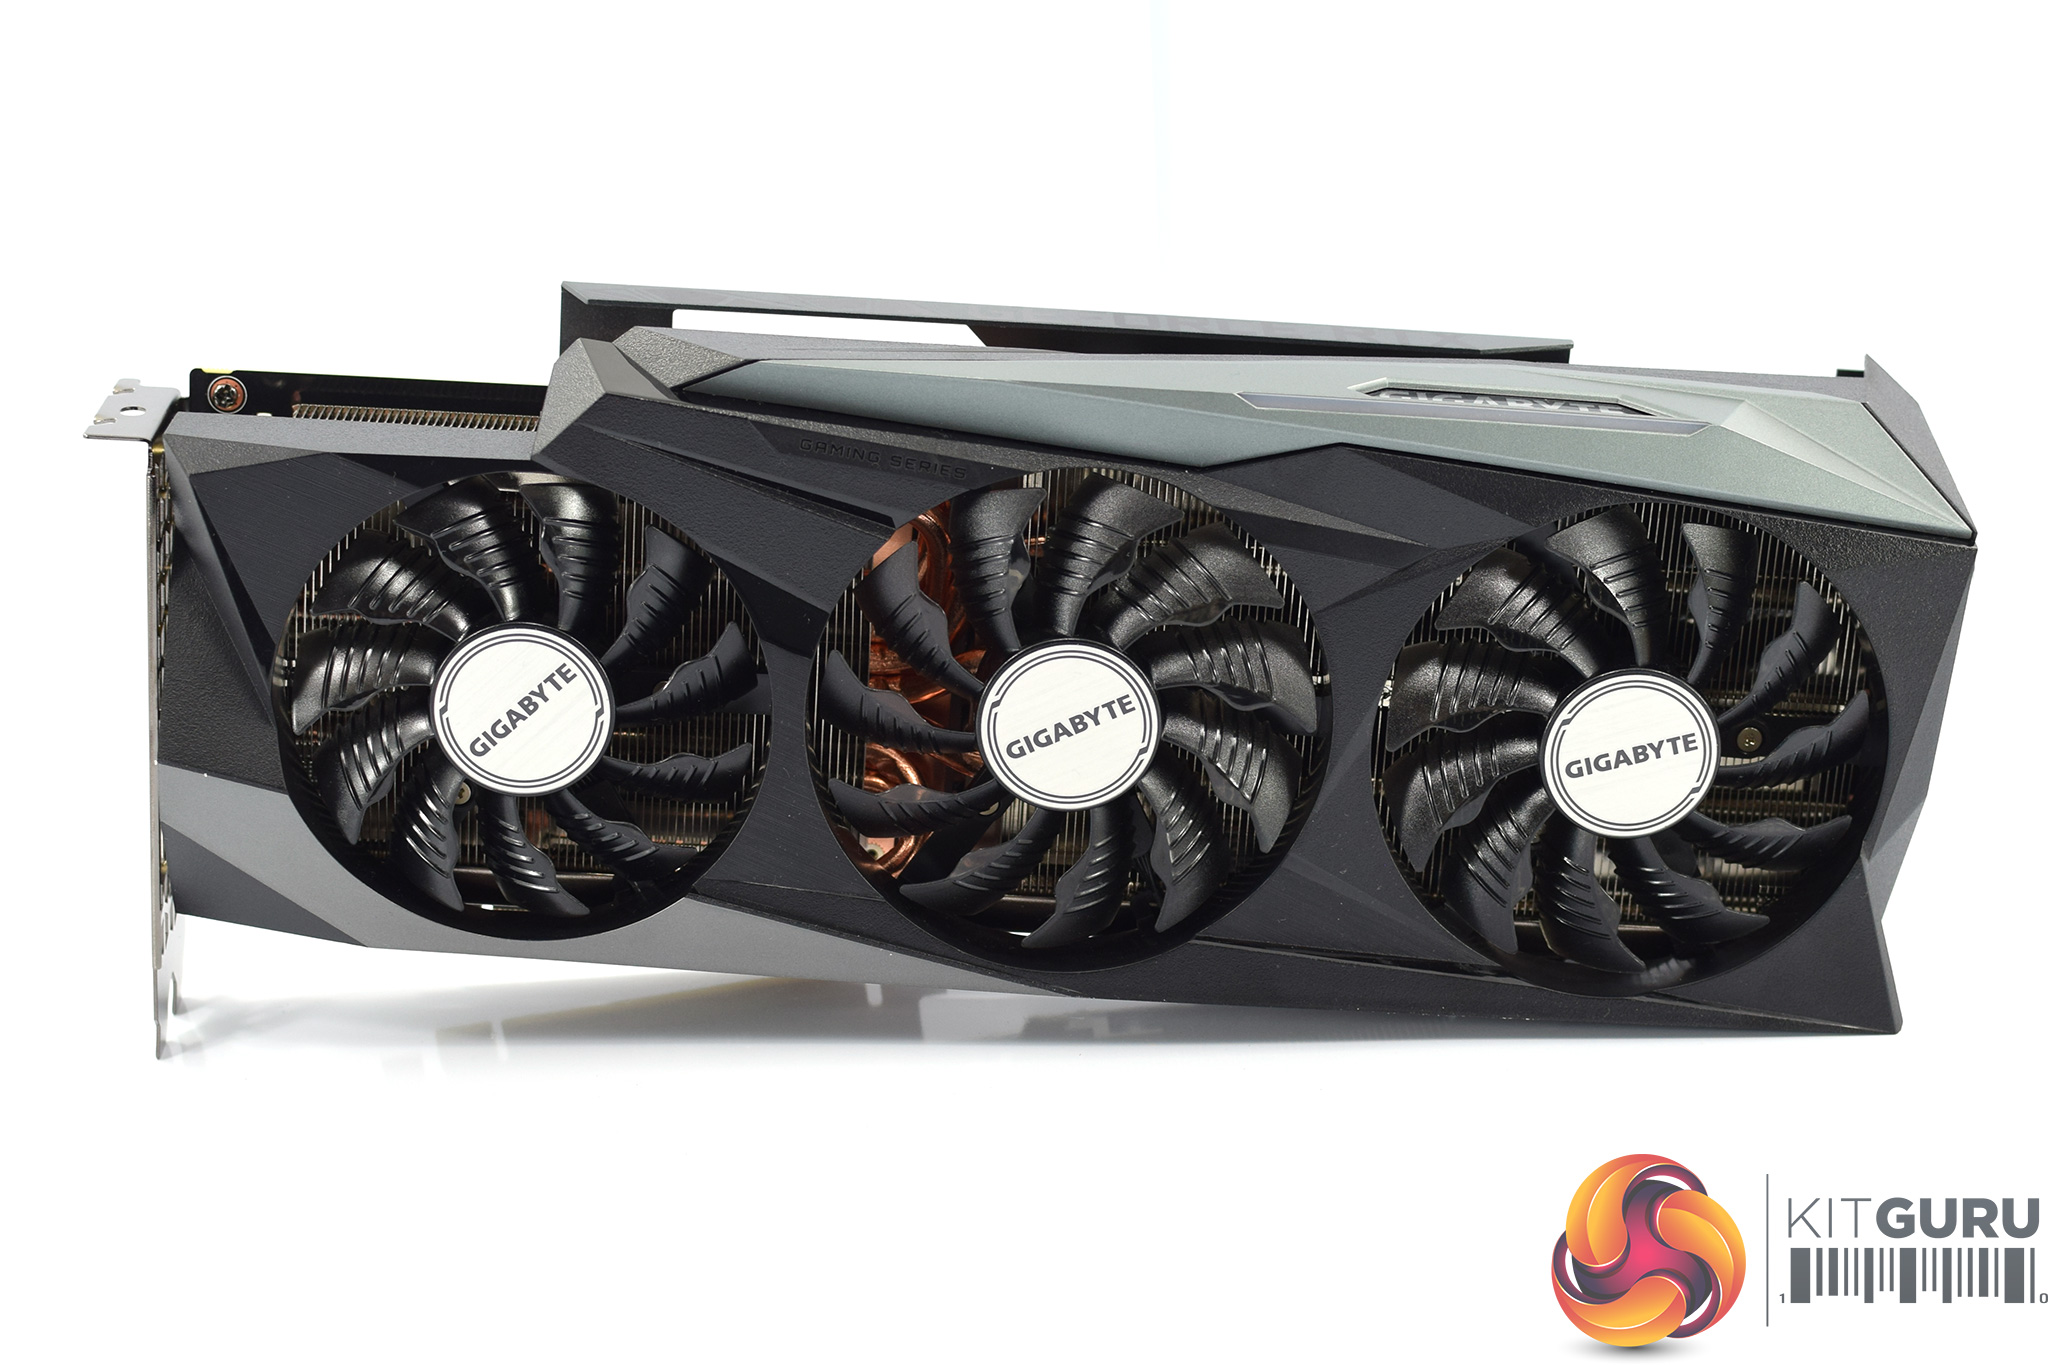
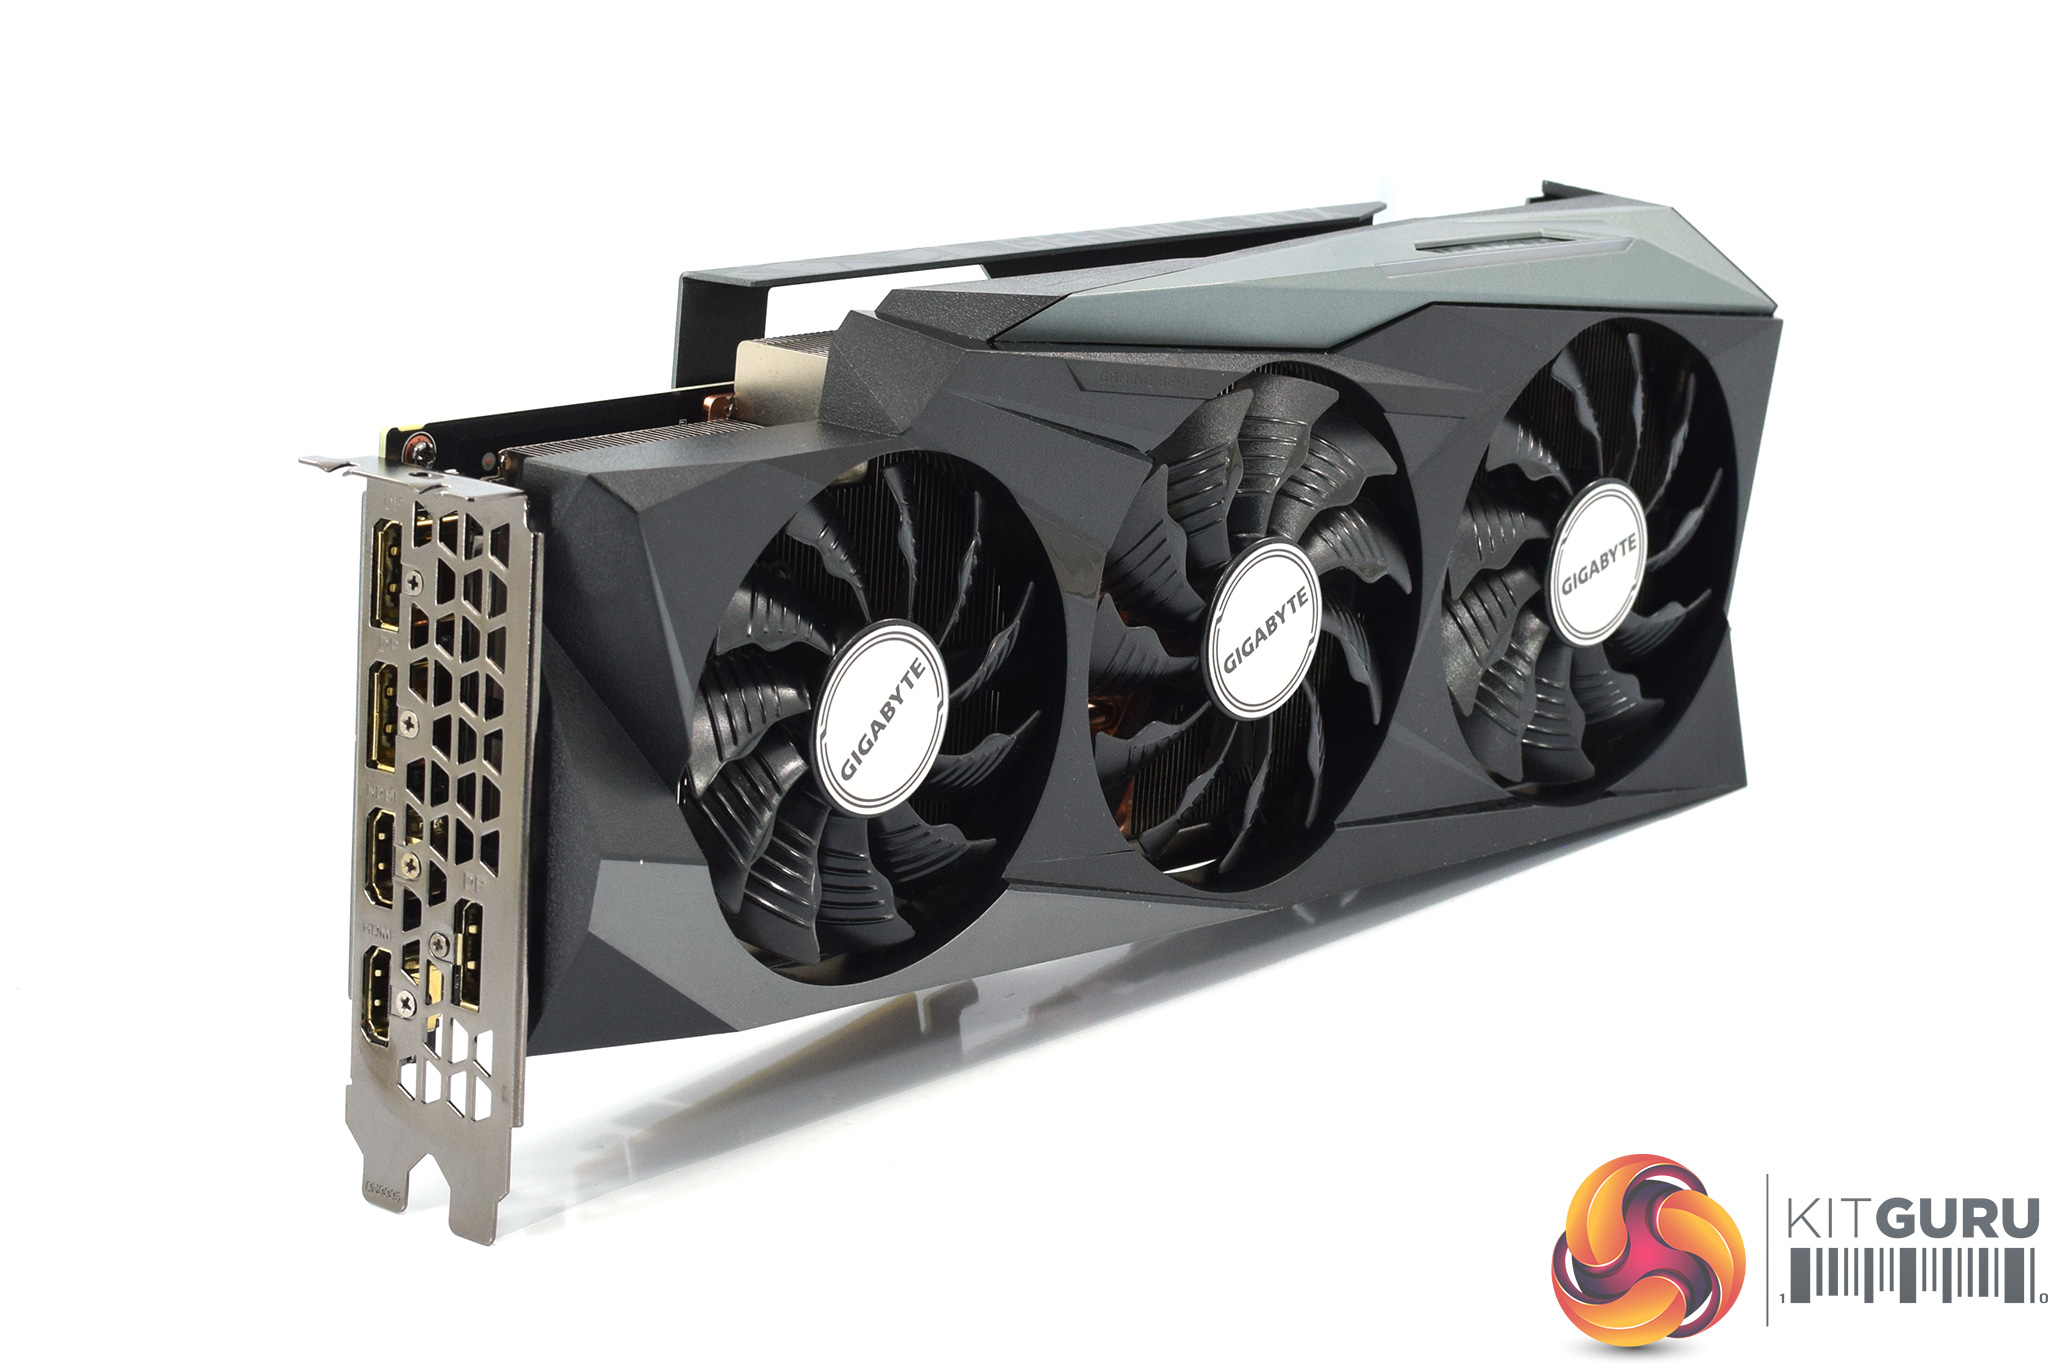
As for the card itself, while we haven't reviewed the RTX 3090 Gaming OC, we have looked at the likes of the RTX 3070 Gaming OC and it is clear these two cards are from the same family. Gigabyte uses a black shroud with some grey and silver accents, while it's triple-fan layout is also familiar. The fan closest to the I/O bracket measures 80mm, while the other two measure 90mm. As always, this cooler uses Gigabyte’s Alternate Spinning feature, where the central fan spins in reverse relative to the outer two, which should reduce turbulence and increase overall pressure down onto the heatsink itself.
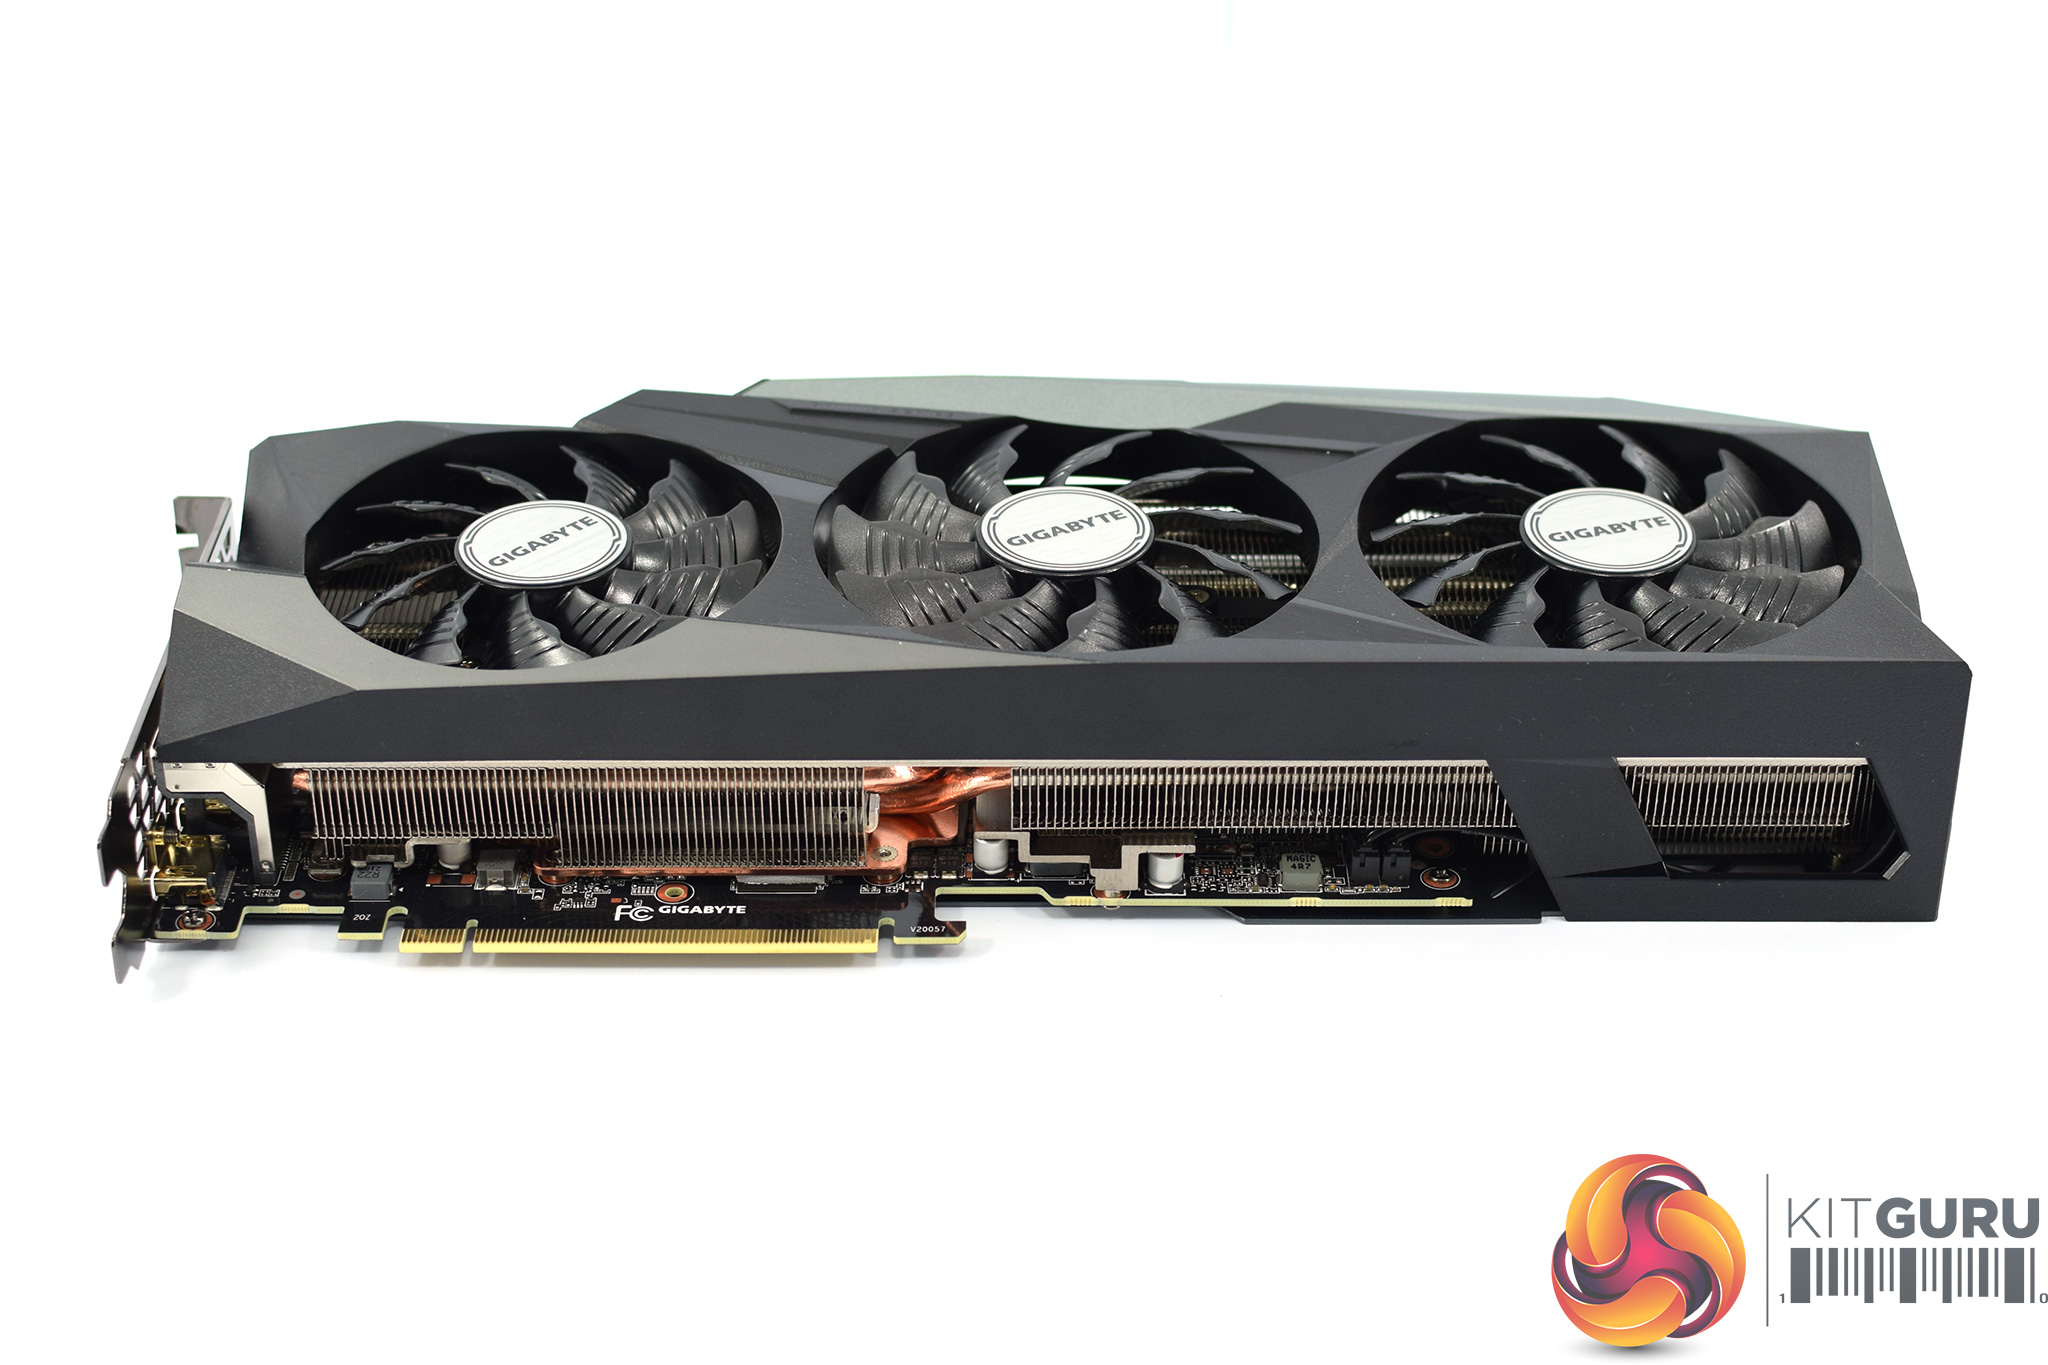
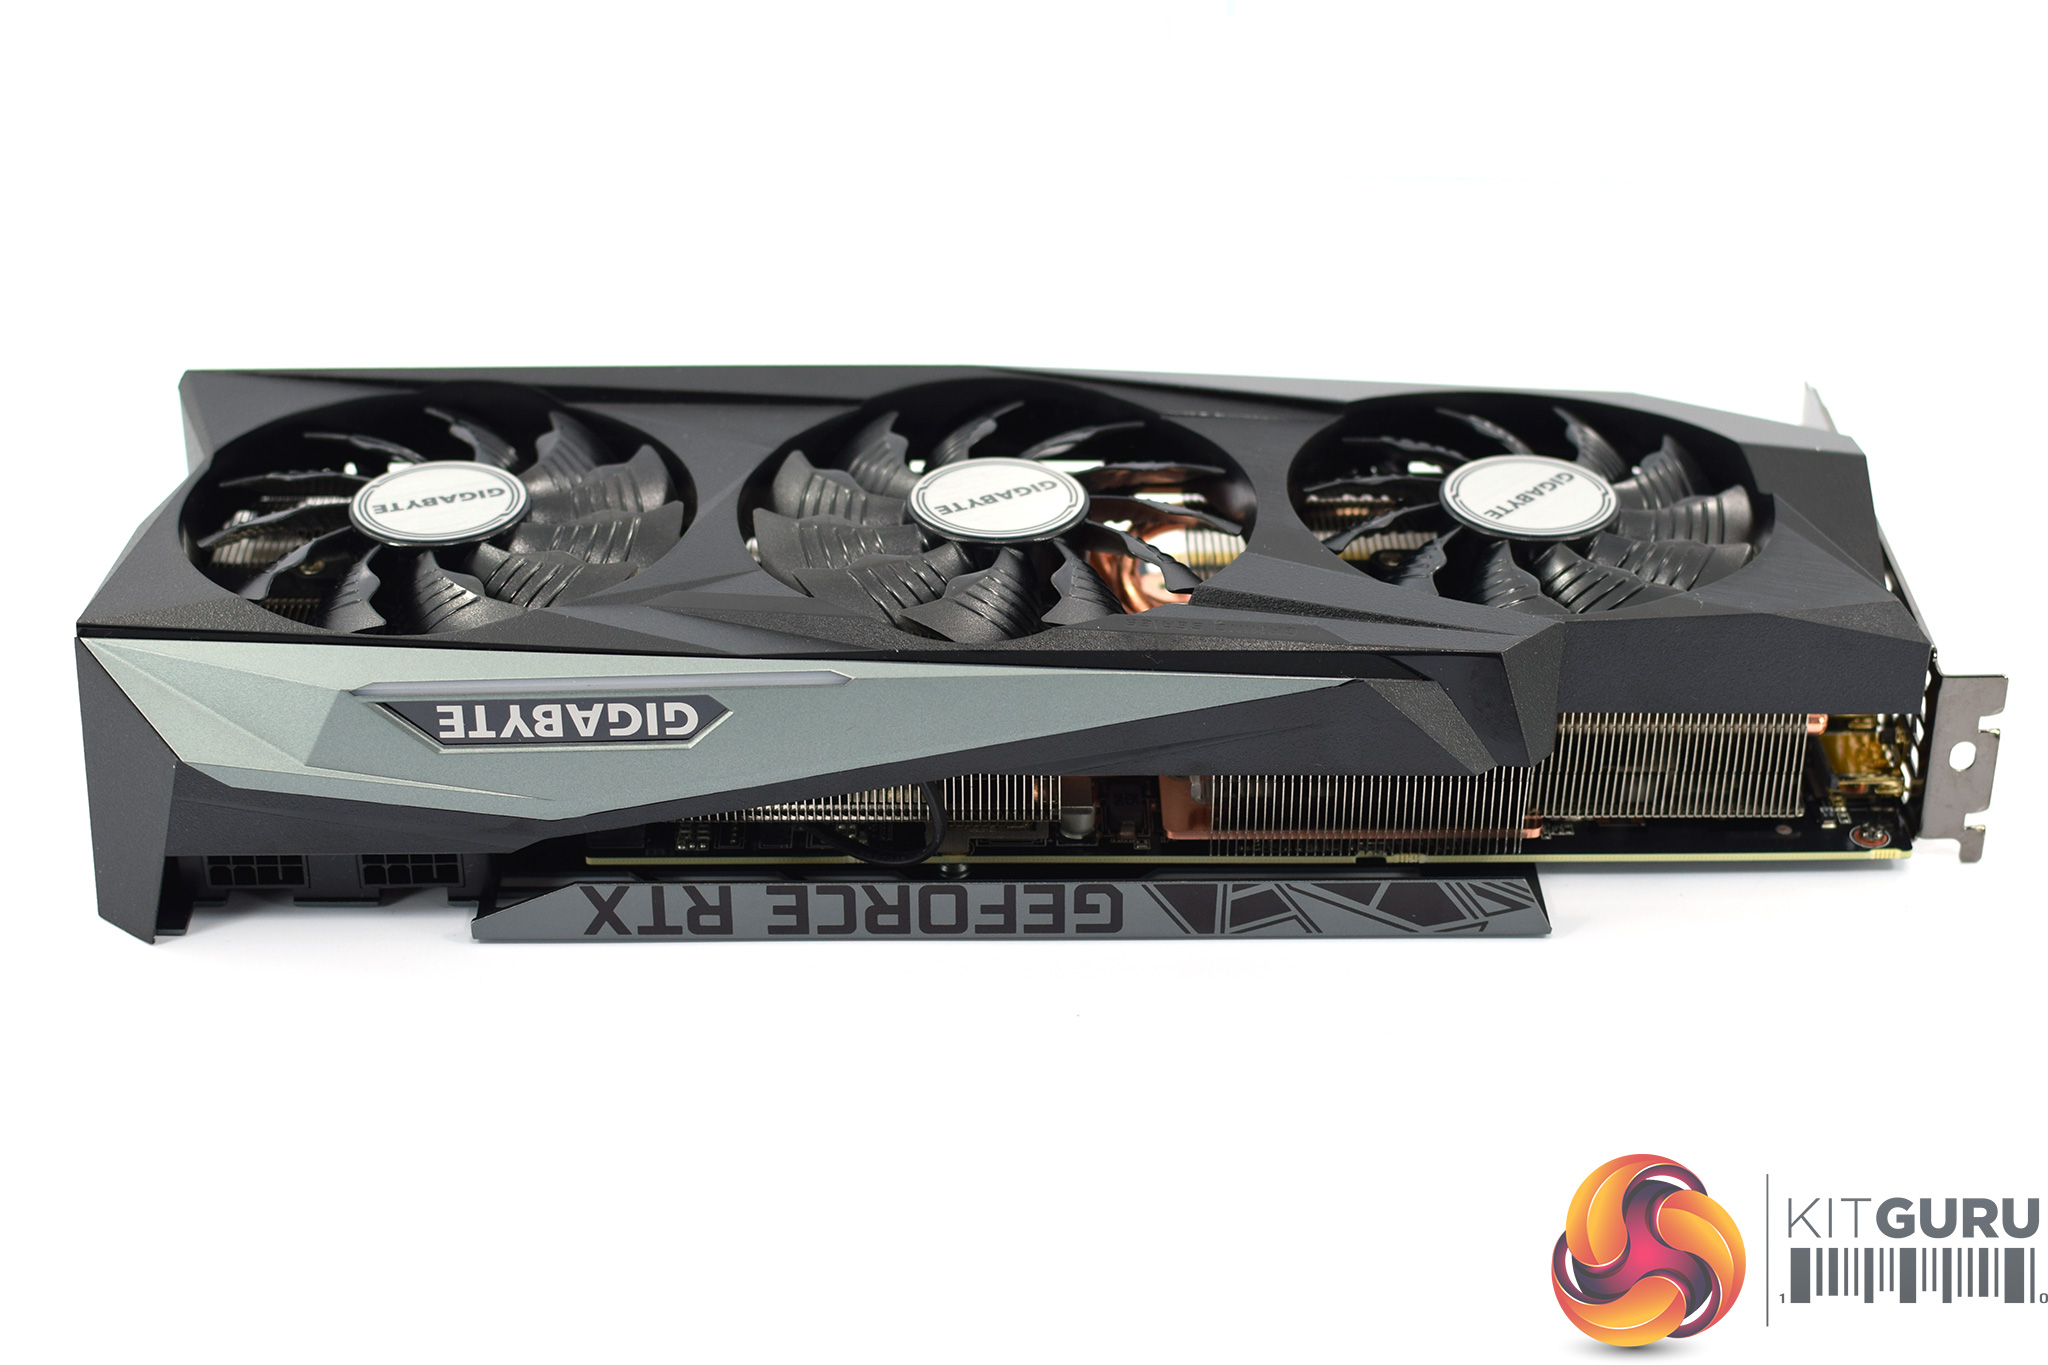
In terms of sizing, this is a very hefty card. It measures 320 x 129 x 55mm, making it a ‘2.7' slot thickness, though in reality you will need three free expansion slots.
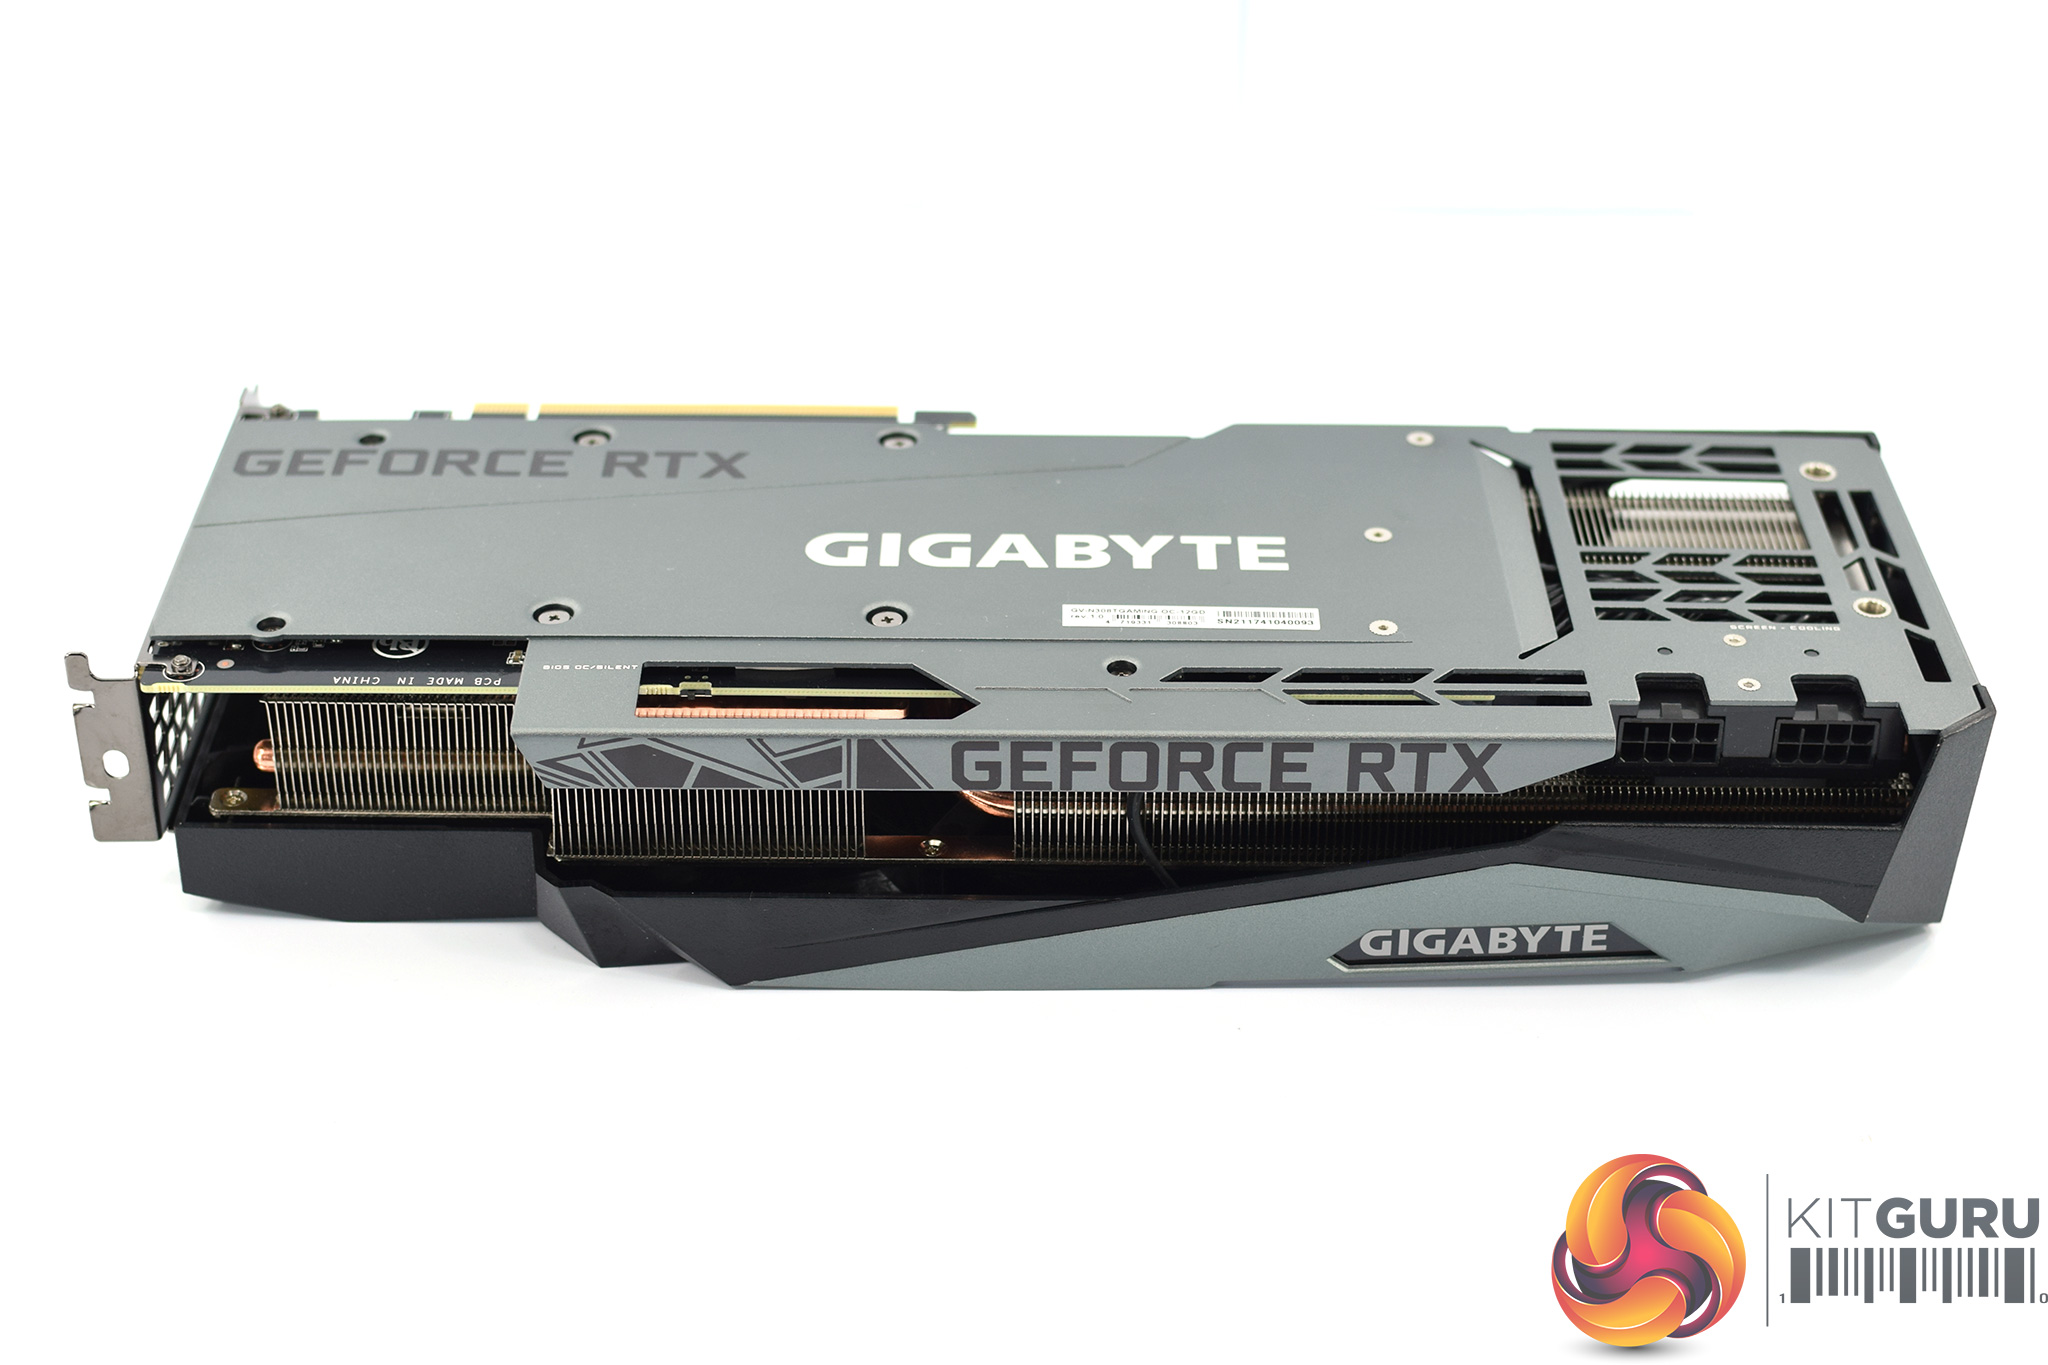
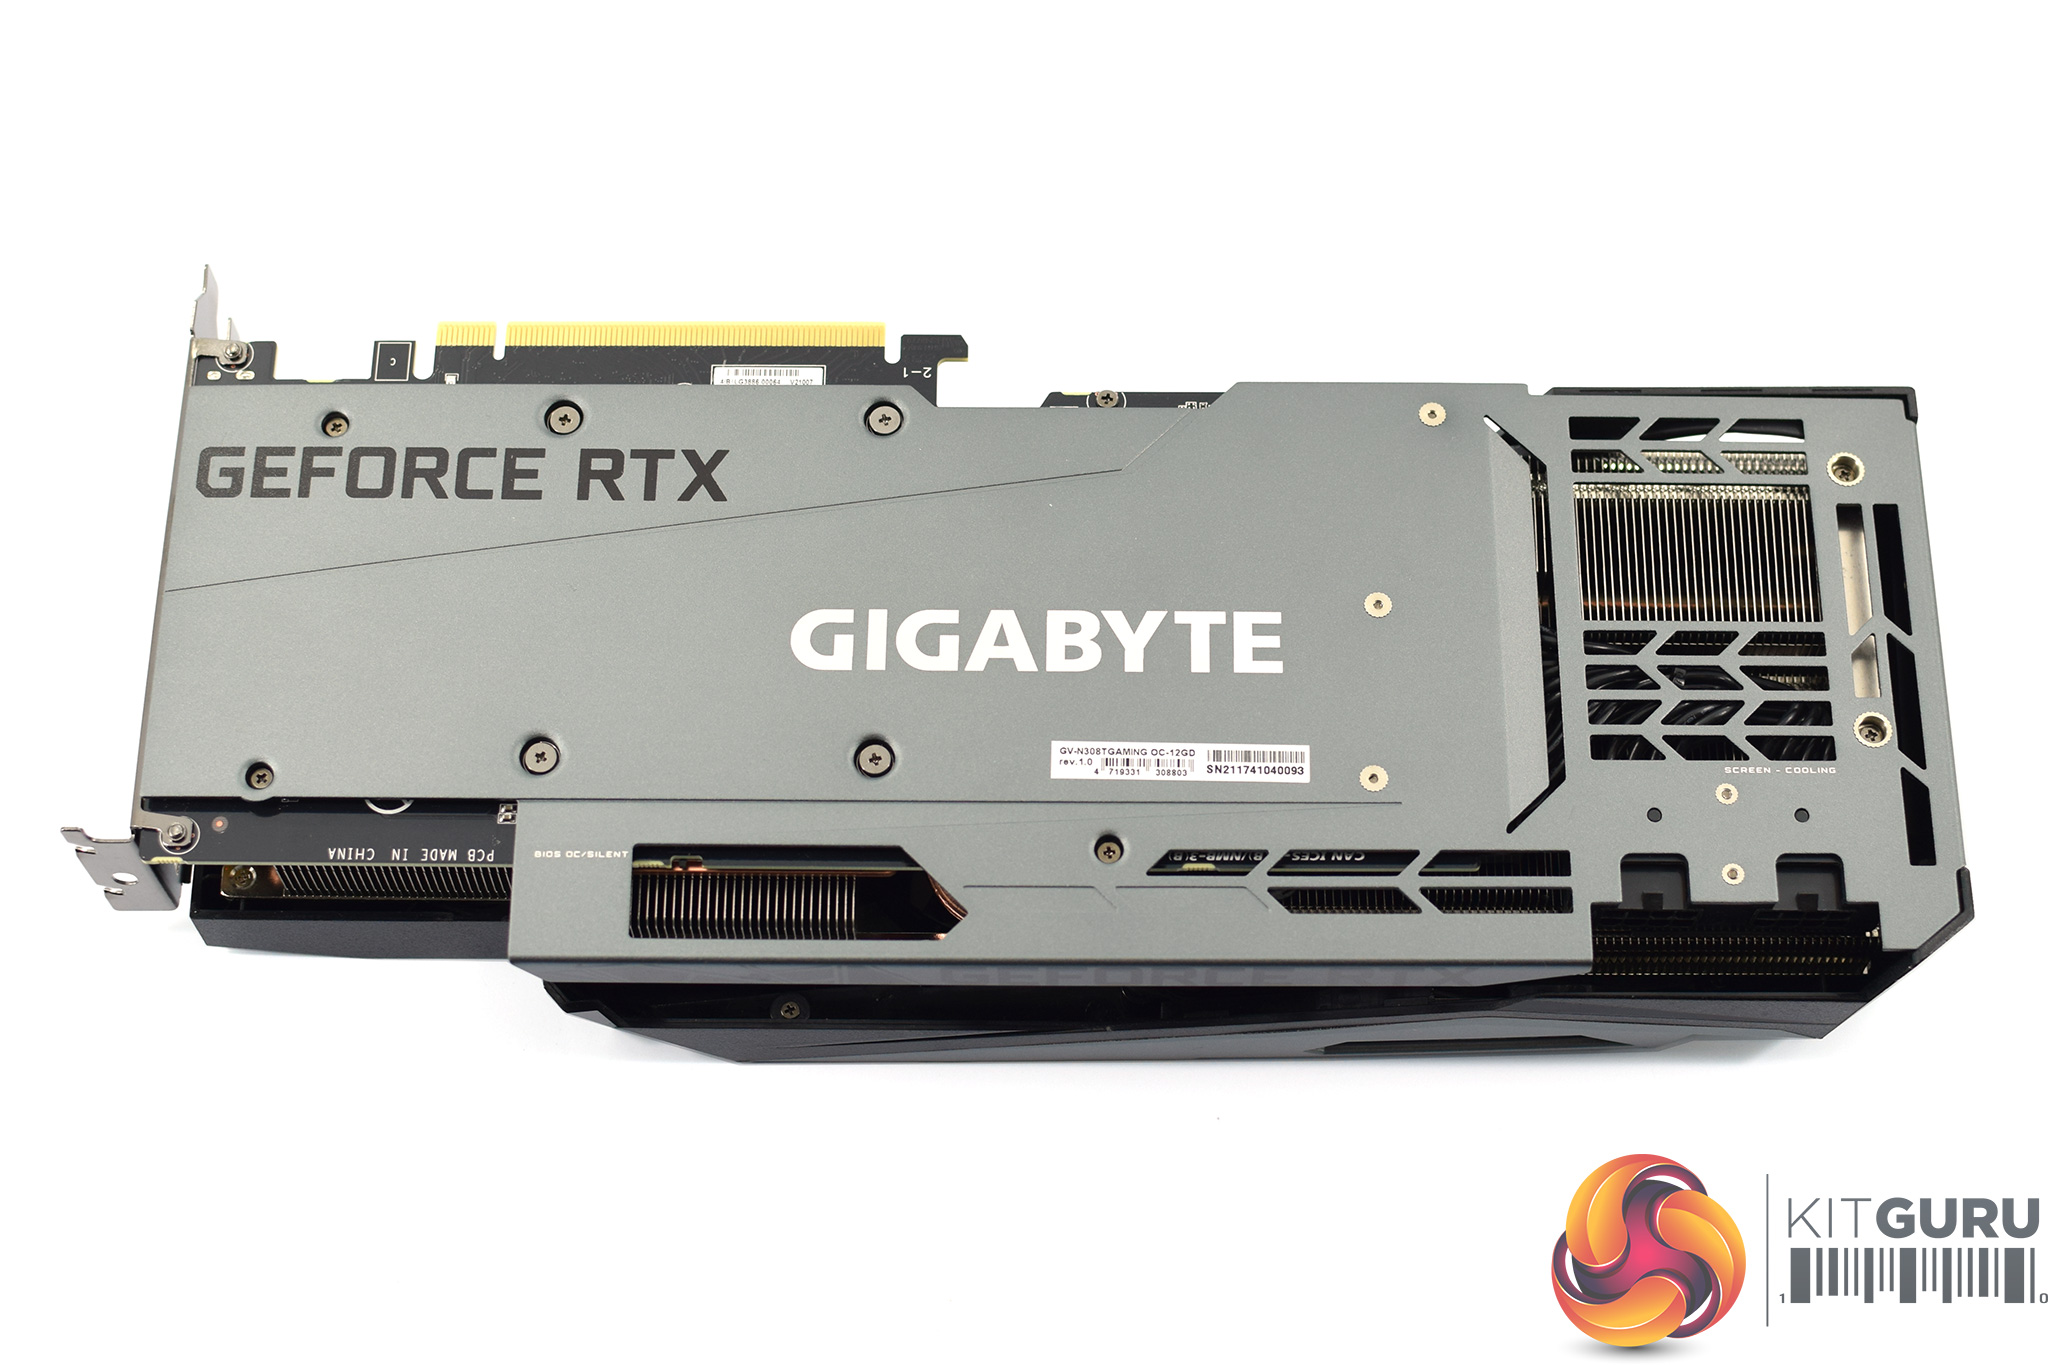
As for the backplate, it is again identical to other Gaming OC cards we have seen. That means it is a full-length metal design, with a large cut-out at the end of the card which Gigabyte calls ‘Screen Cooling'. The Gigabyte logo is printed centrally, in a white font.
We can also note a dual-BIOS switch positioned on the front side of the card, with the default being the OC BIOS (370W power limit), while a Silent BIOS (350W power limit) is also available.
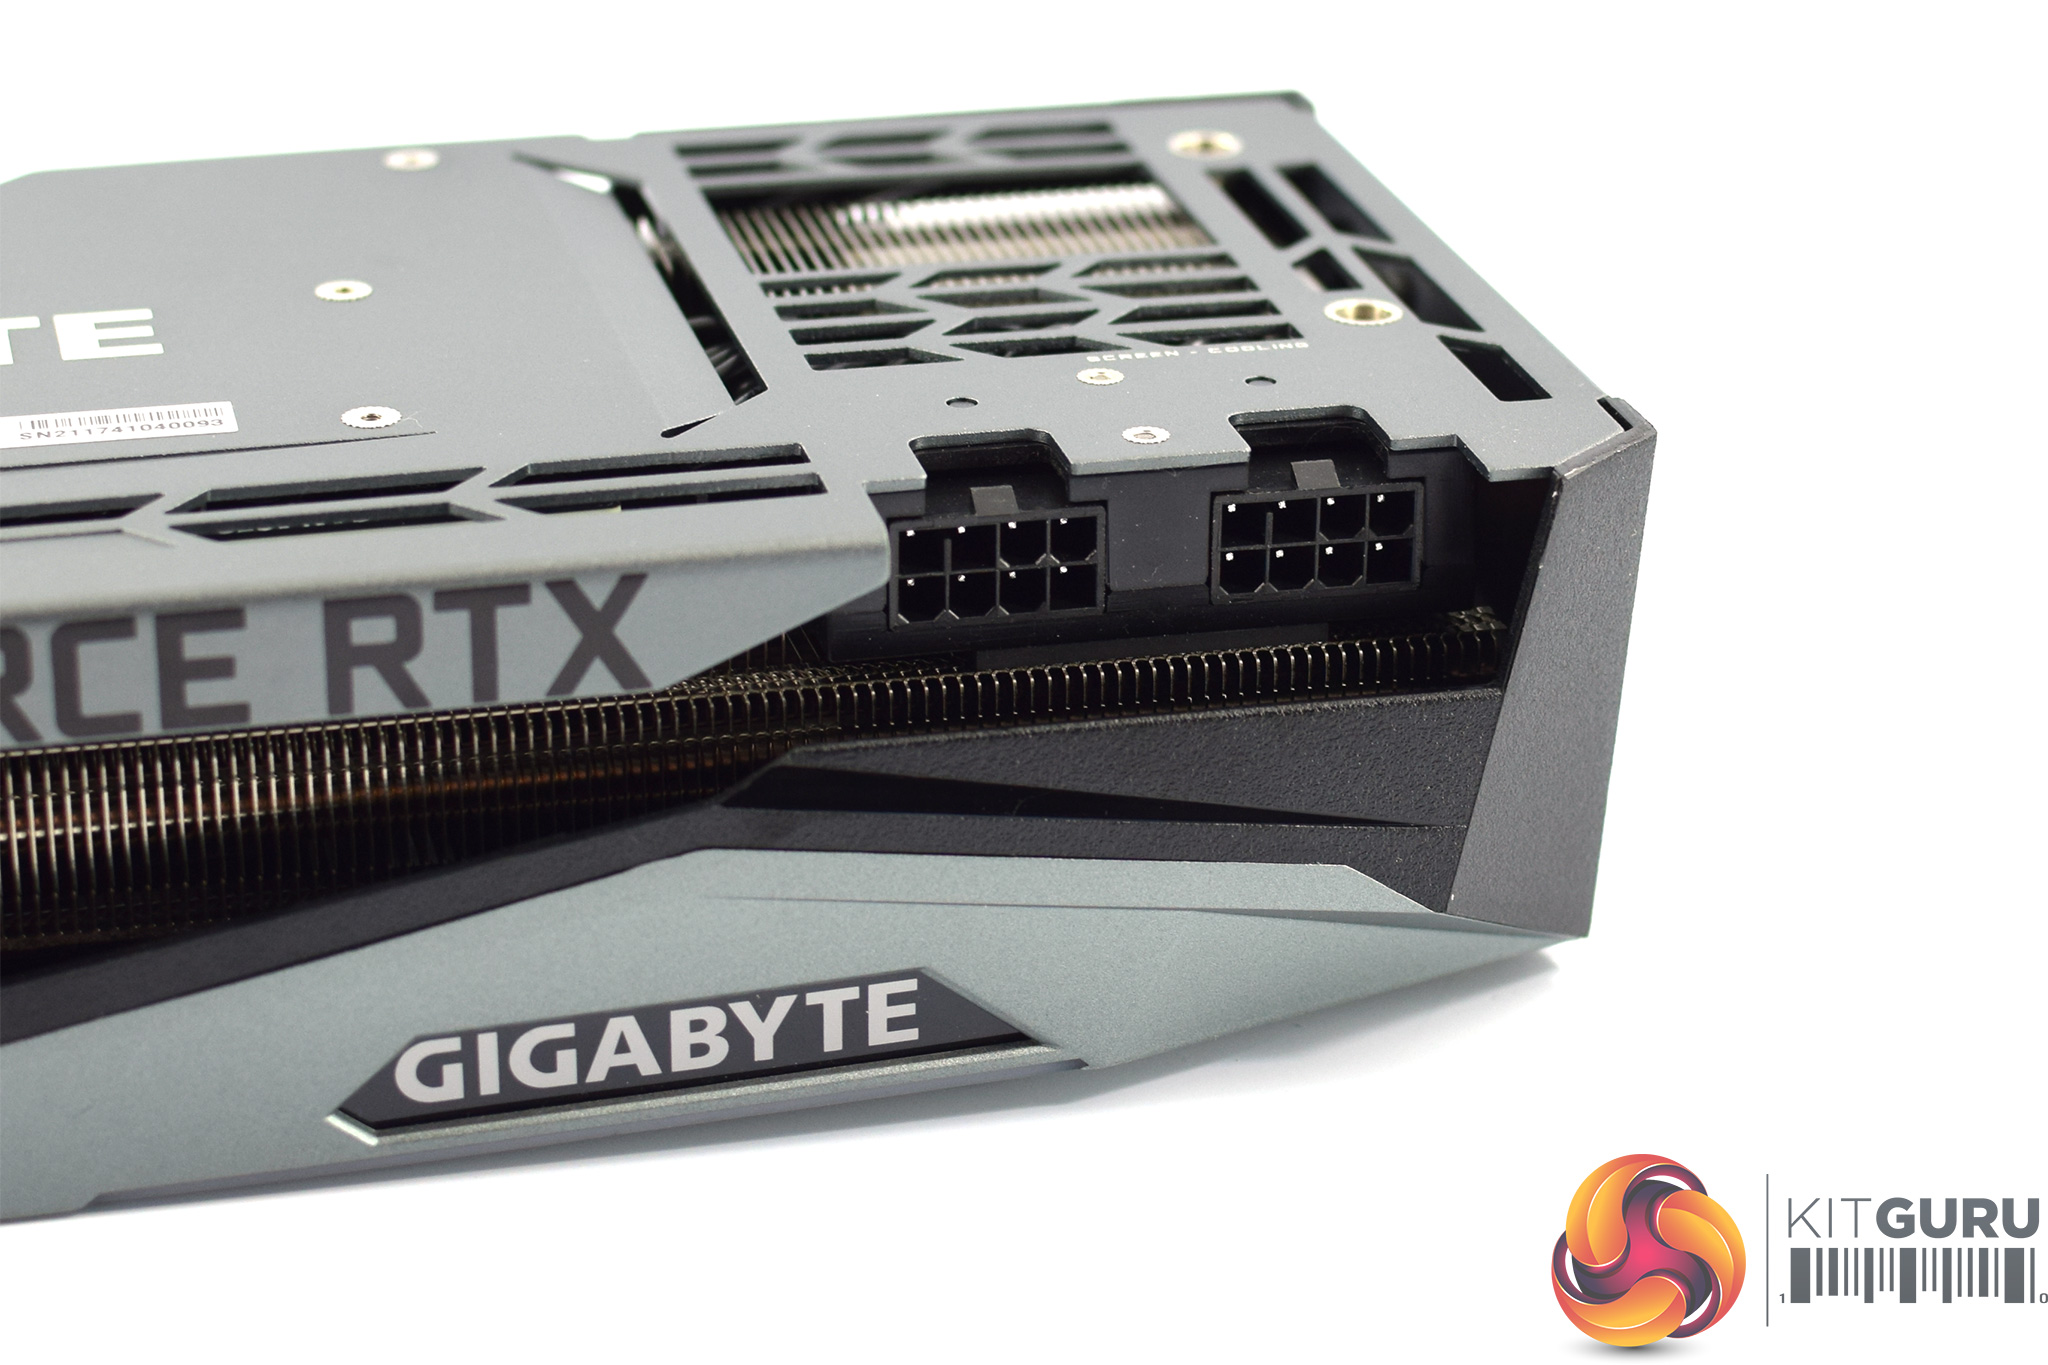
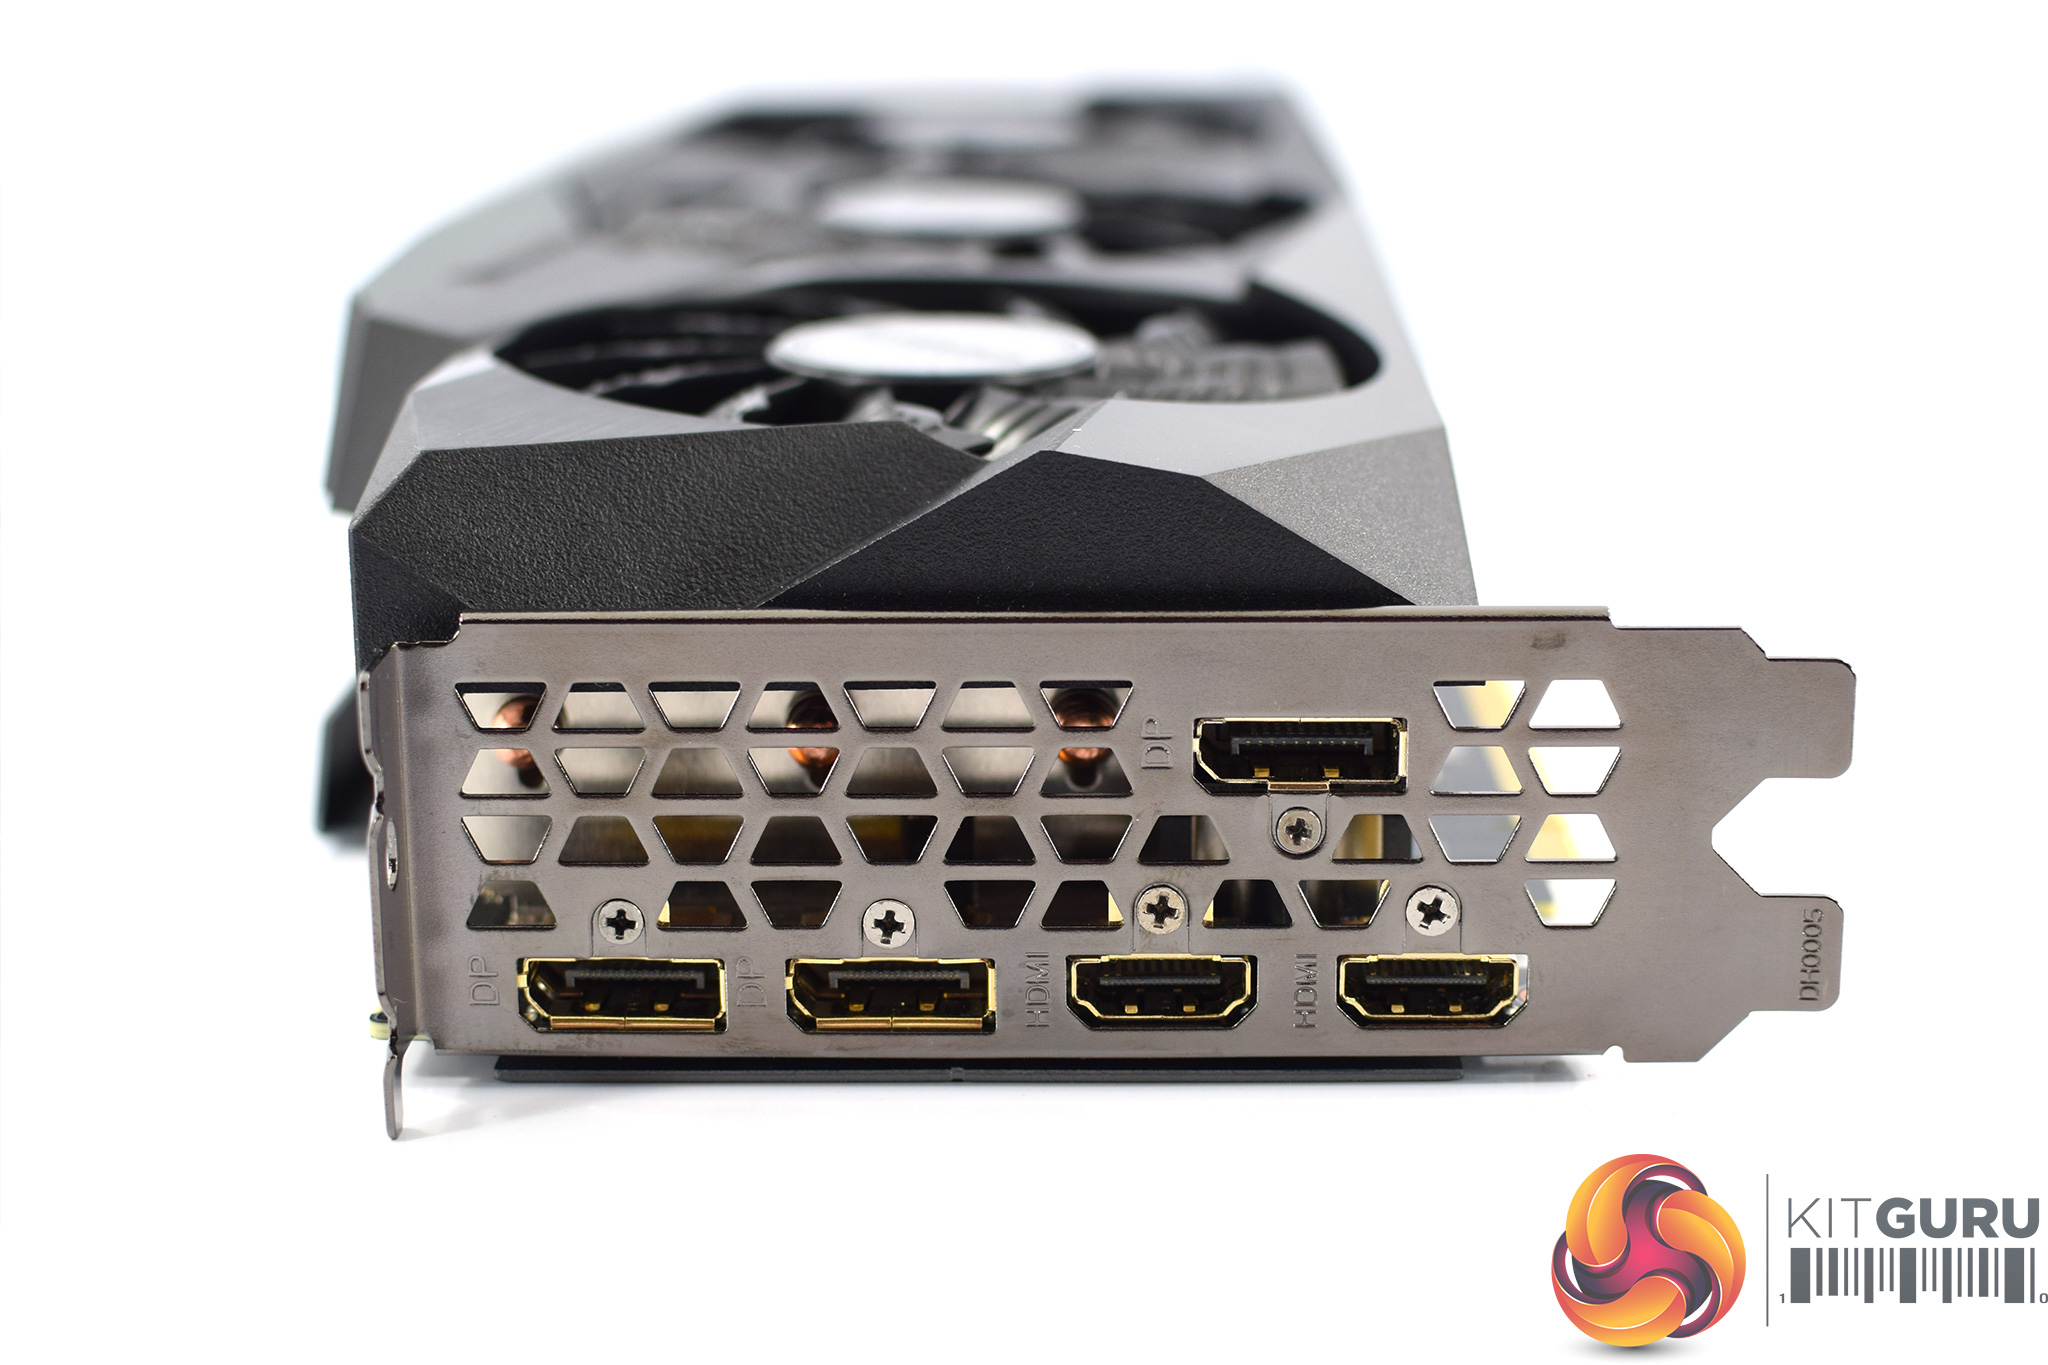
Two 8-pin power inputs are required, while we find 3x DisplayPort 1.4 and 2x HDMI 2.1 display outputs.
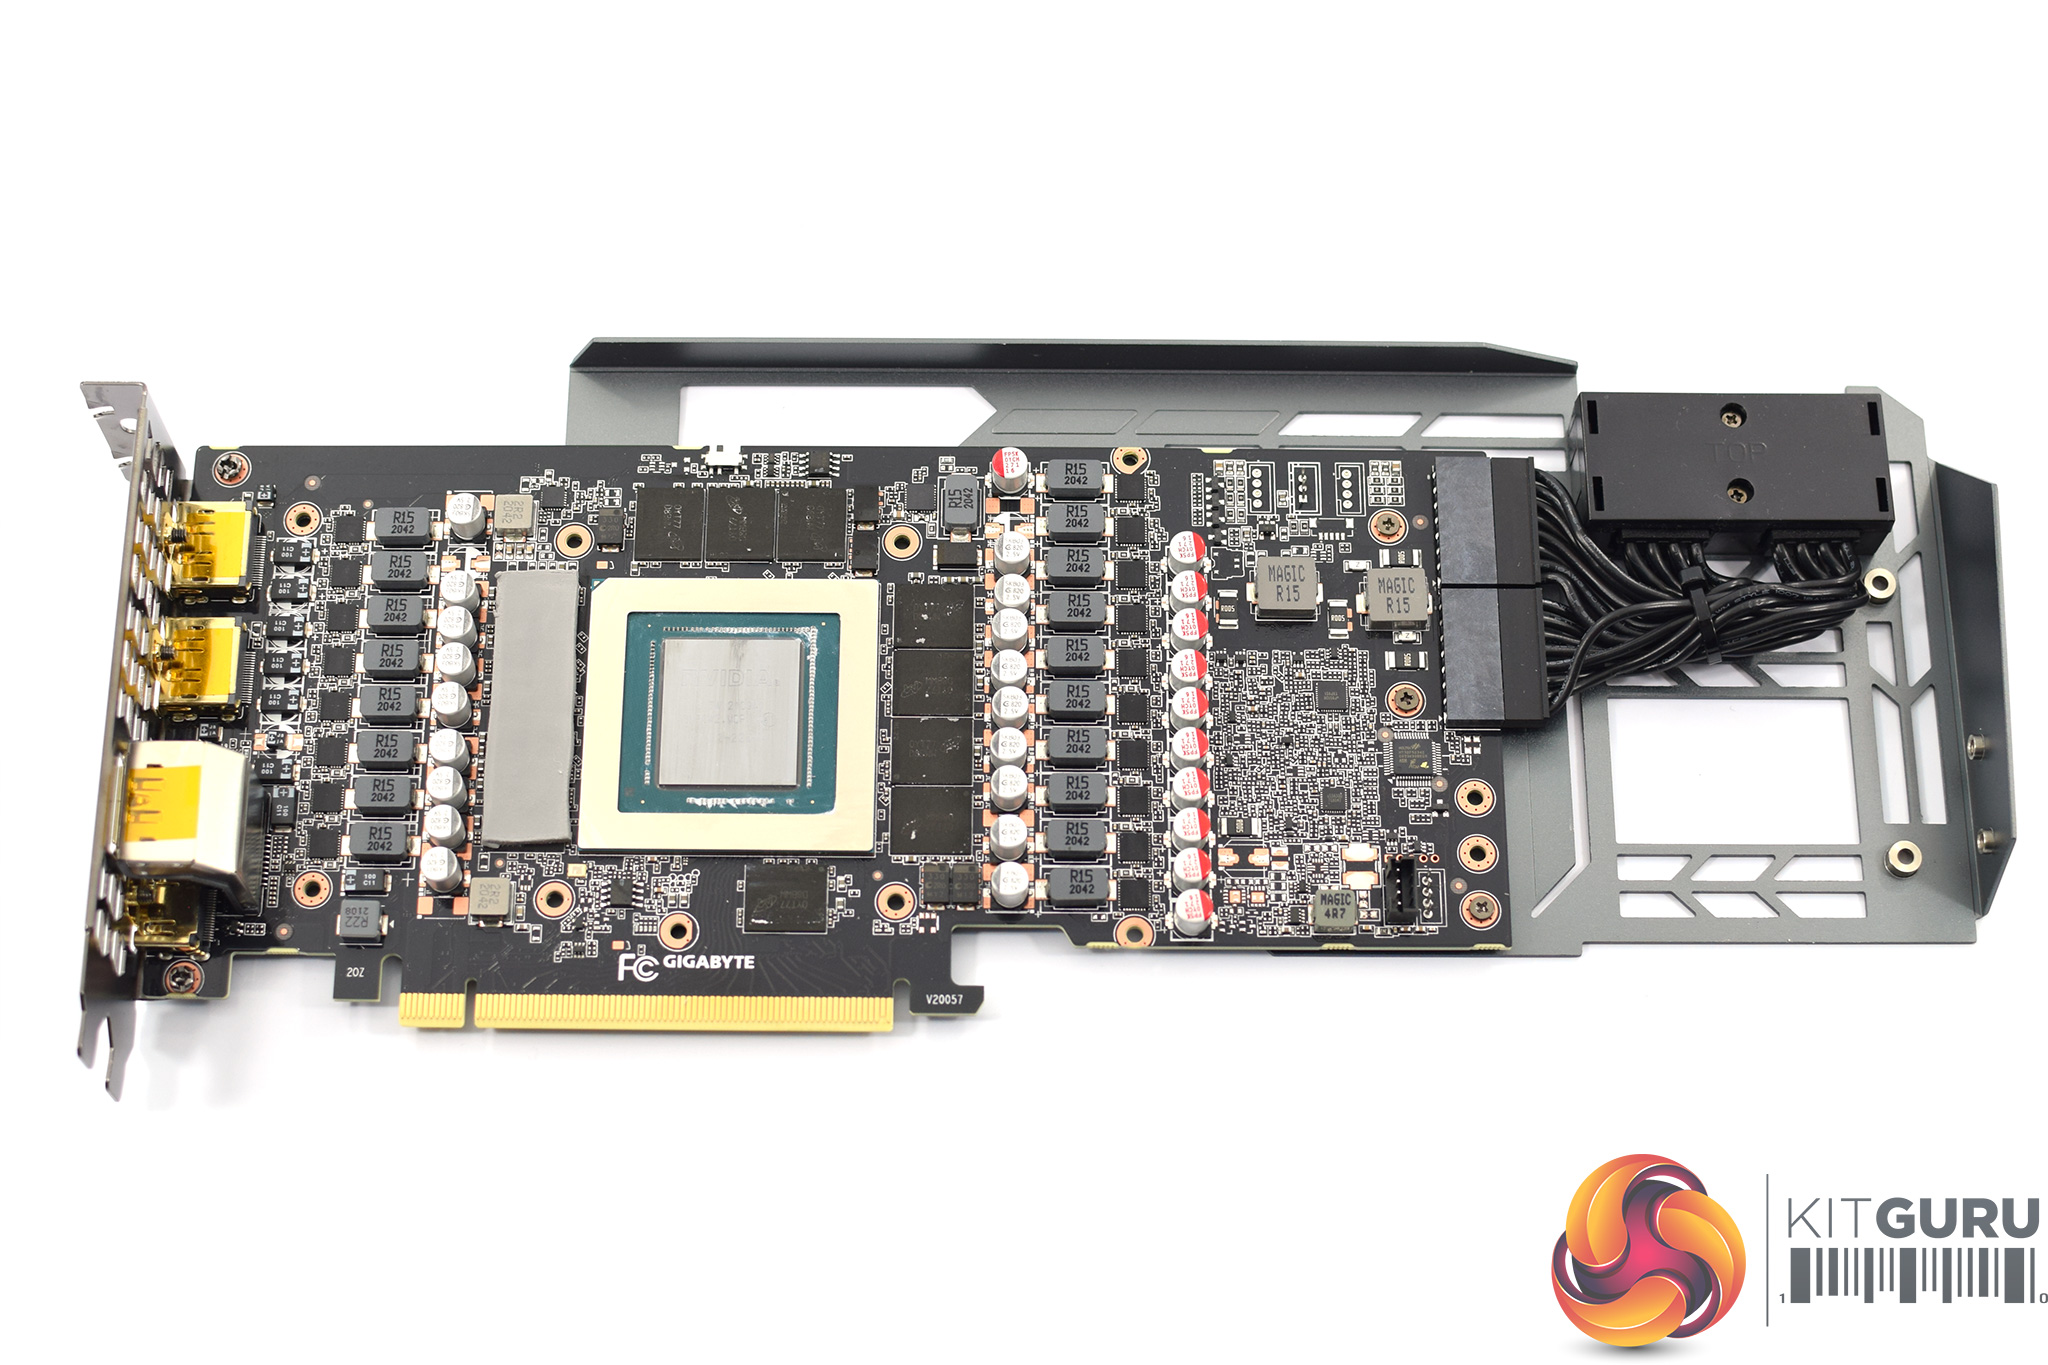
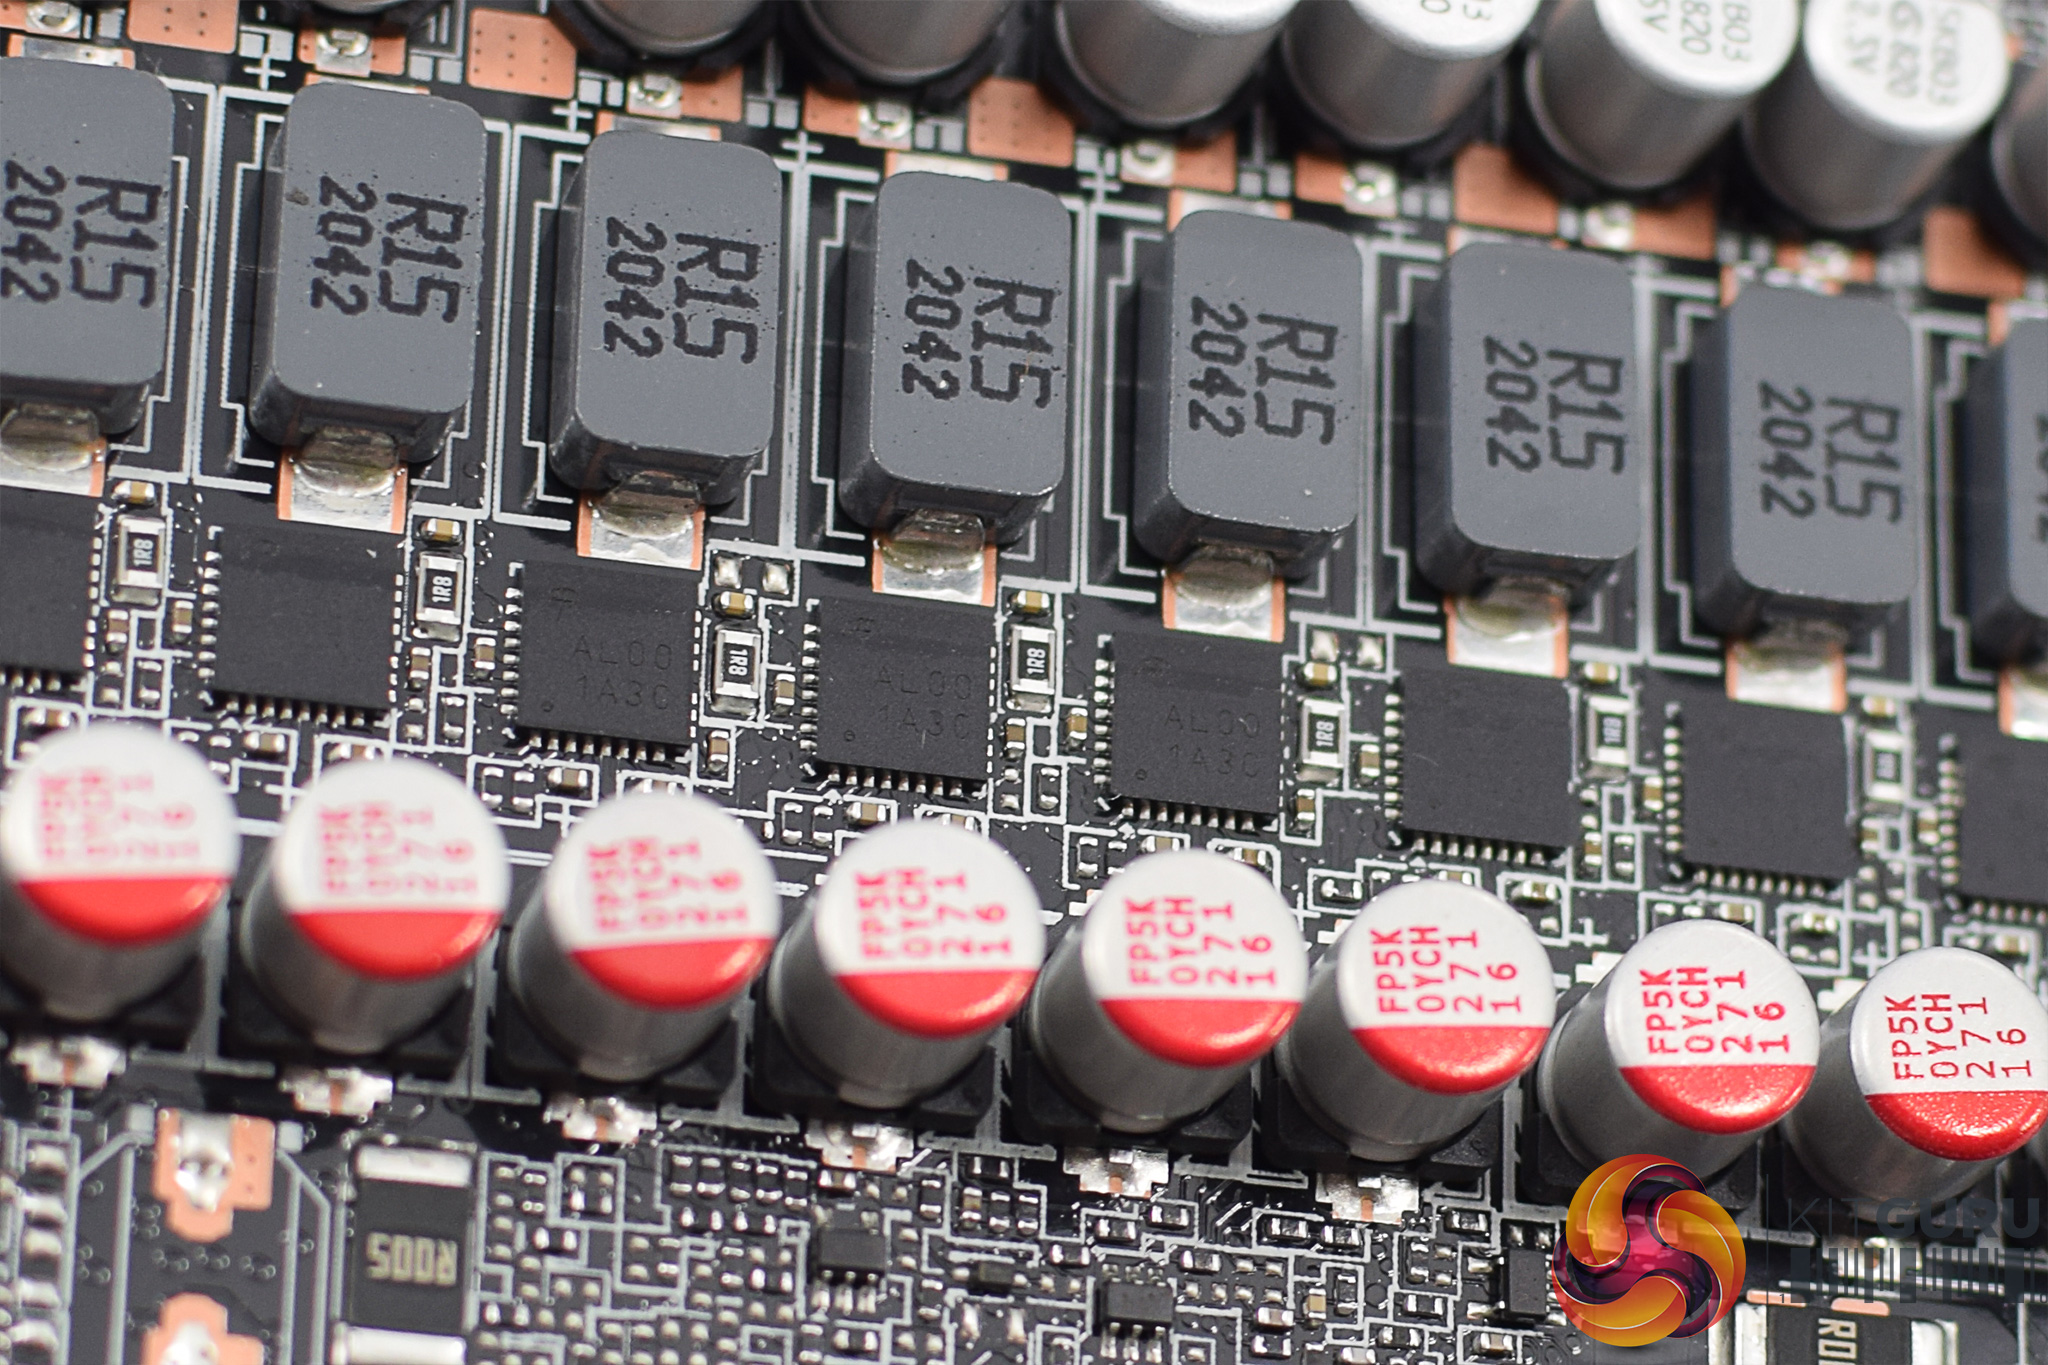
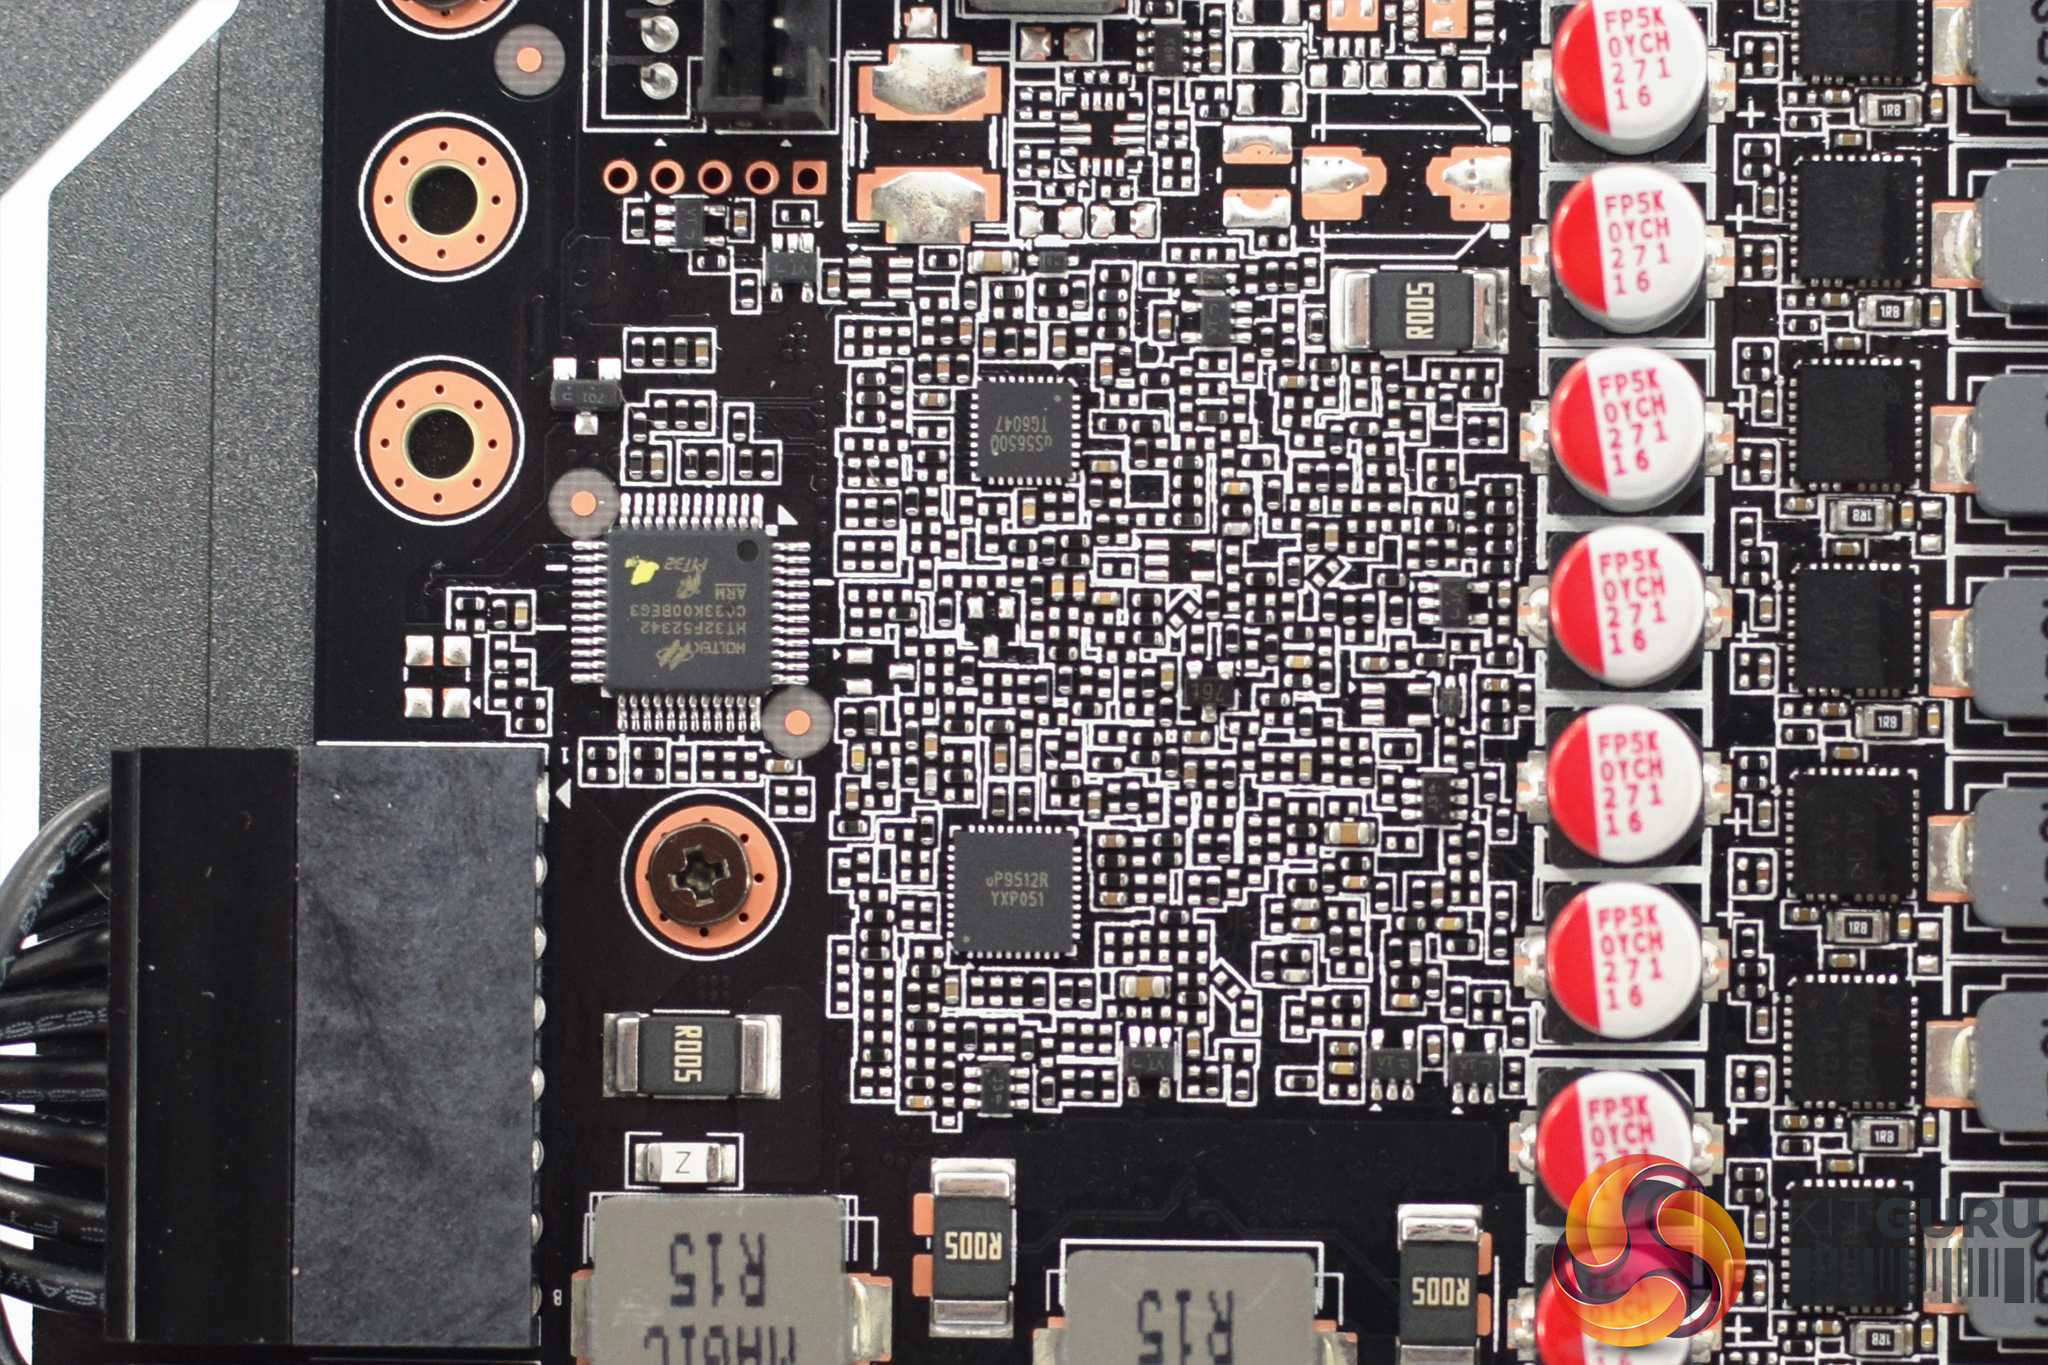
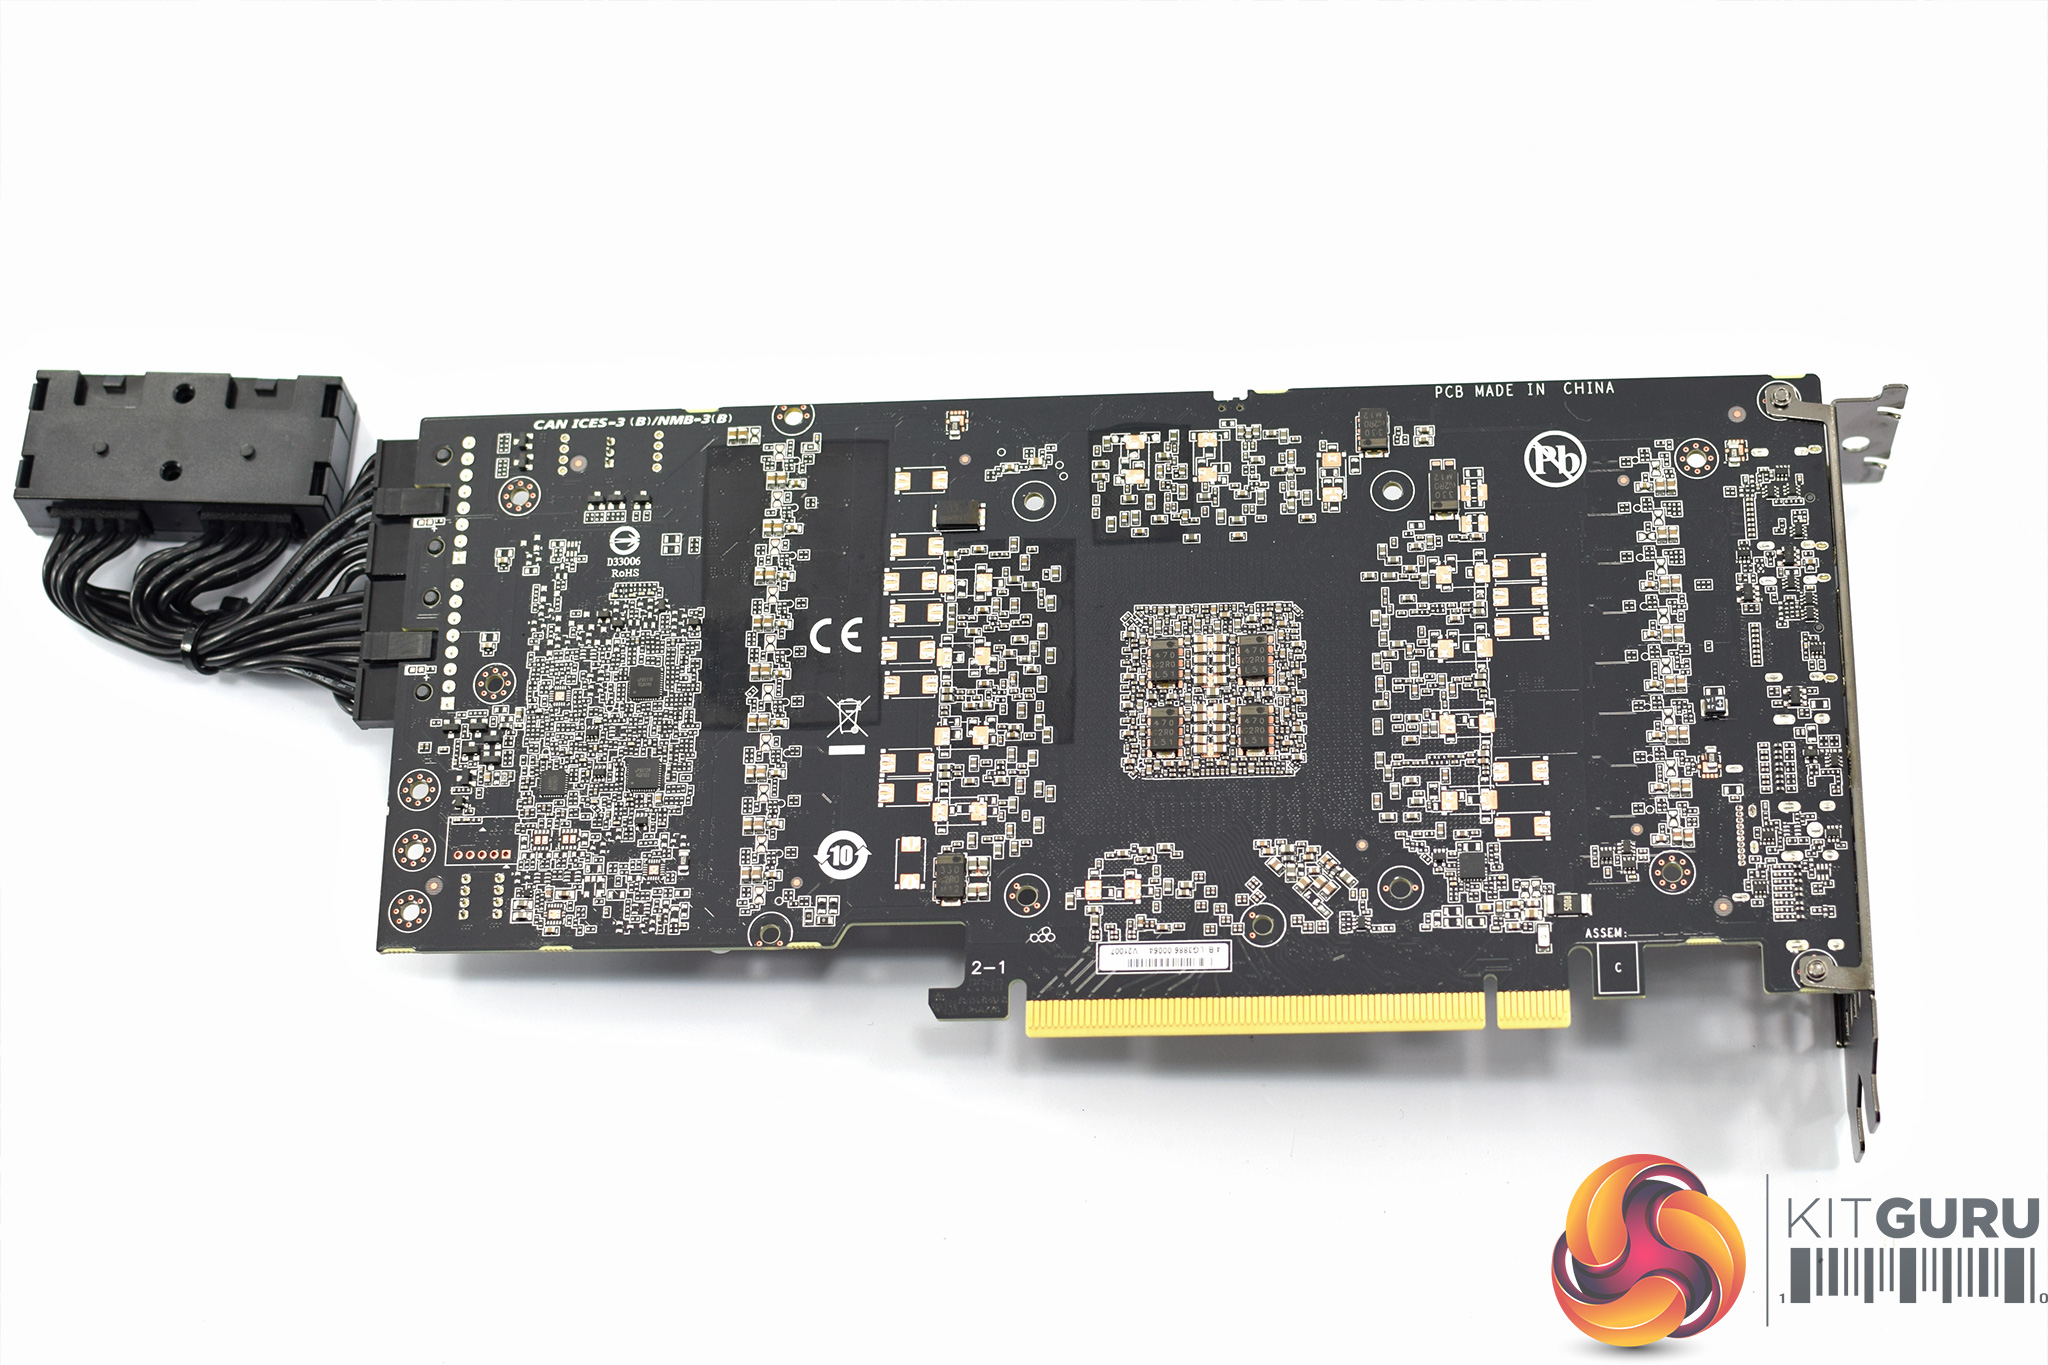
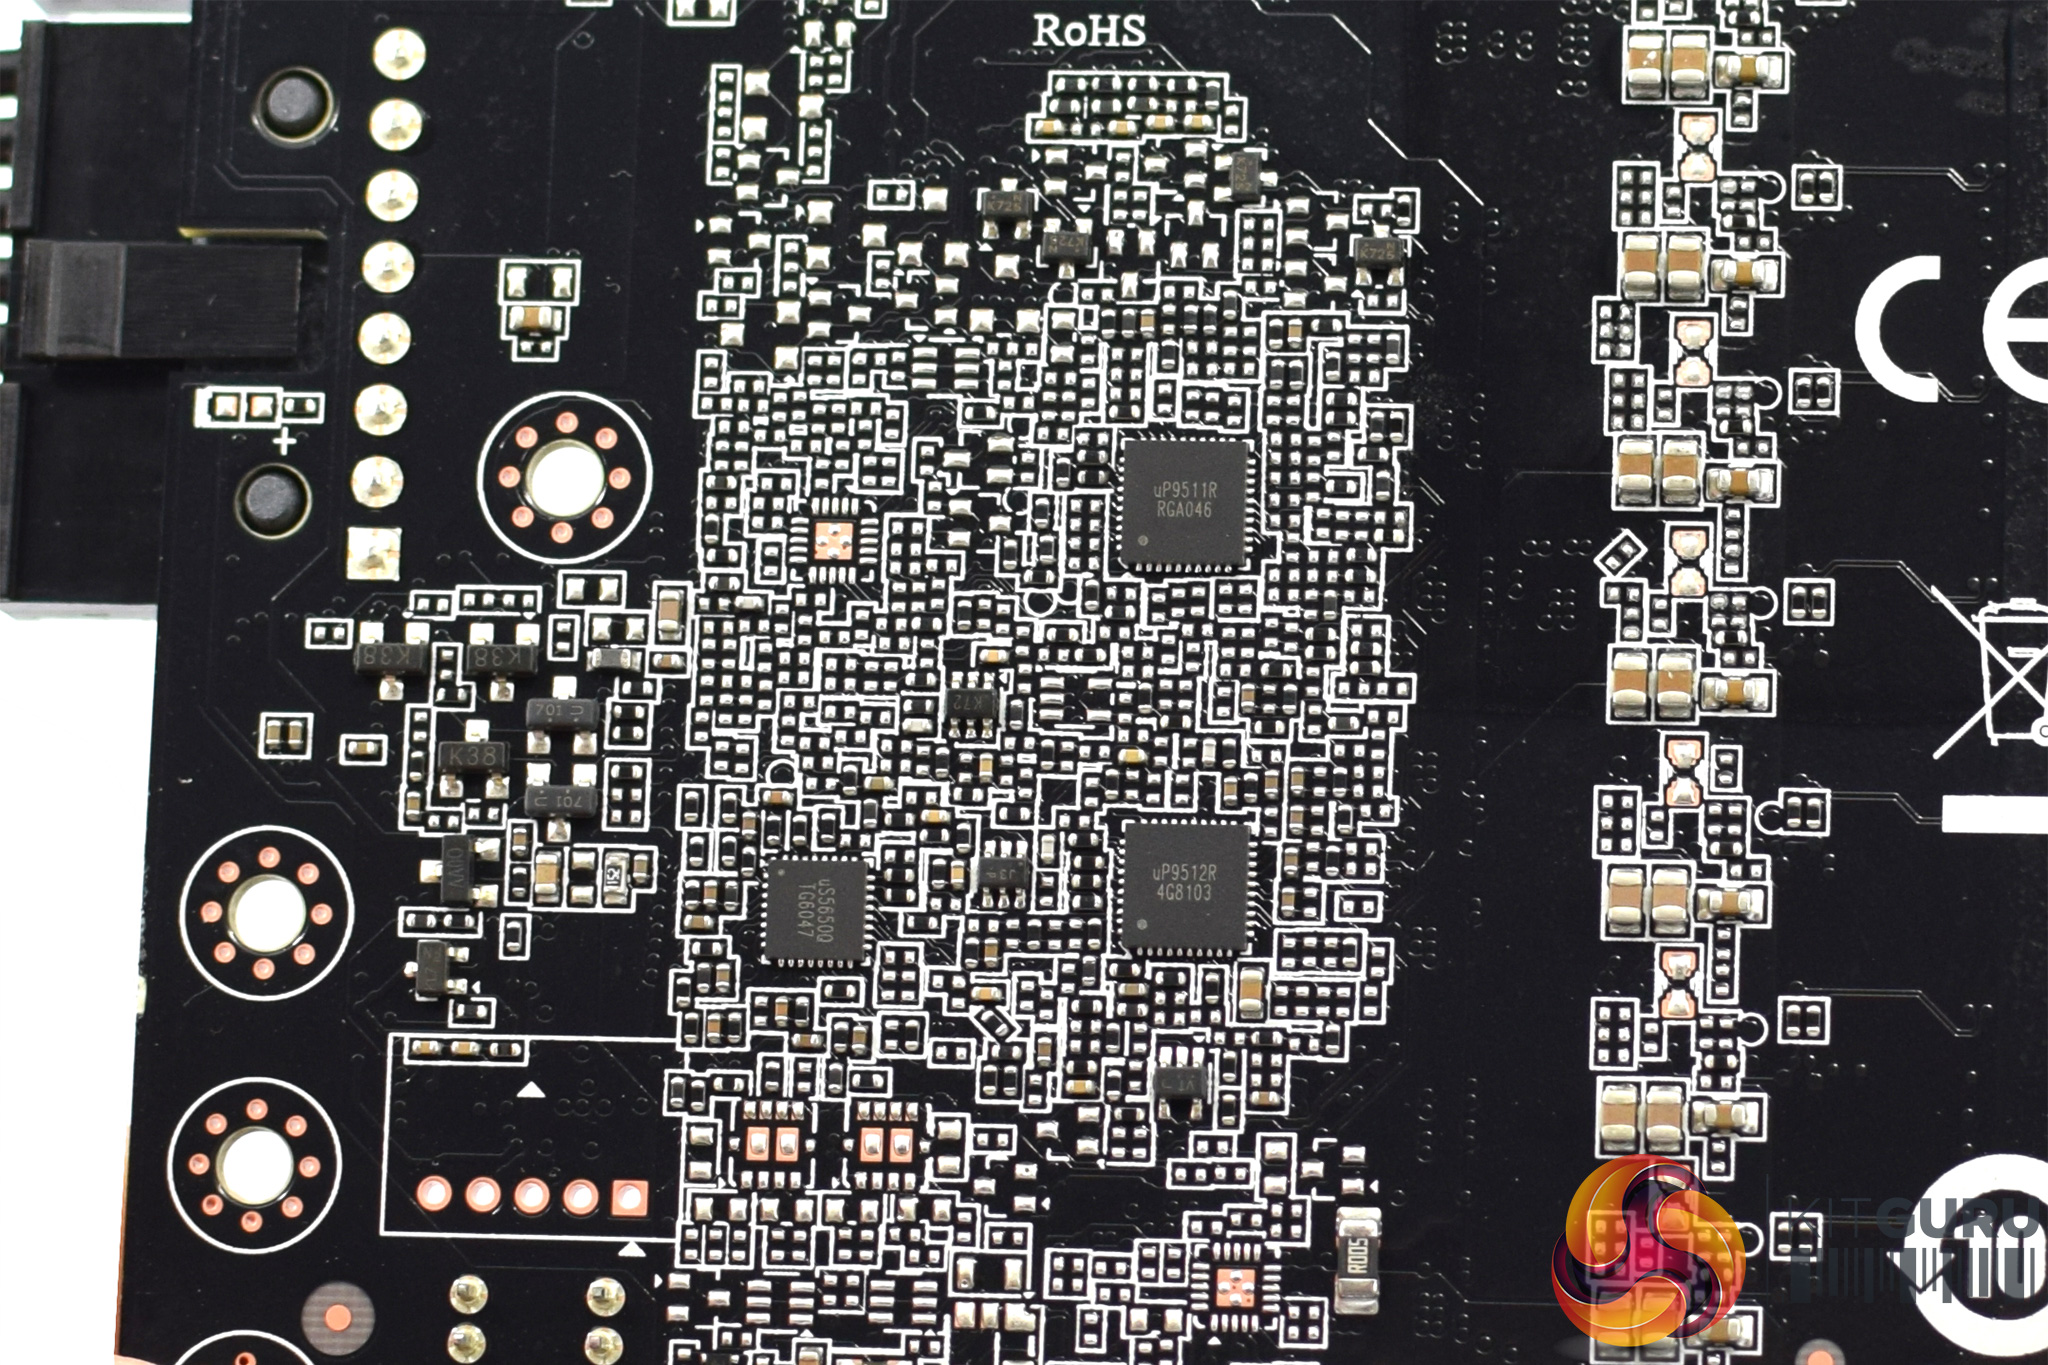
Taking a look at the PCB, Gigabyte is using a total of 19 phases, likely split with 15 for the GPU and 4 for the memory. The MOSFETs used are Alpha & Omega AOZ5332QI, rated for 50A continuous current. We can also note two UPI uP9512R controllers and one UPI uP9511R controller, as well as two UPI uS5650Q controllers.
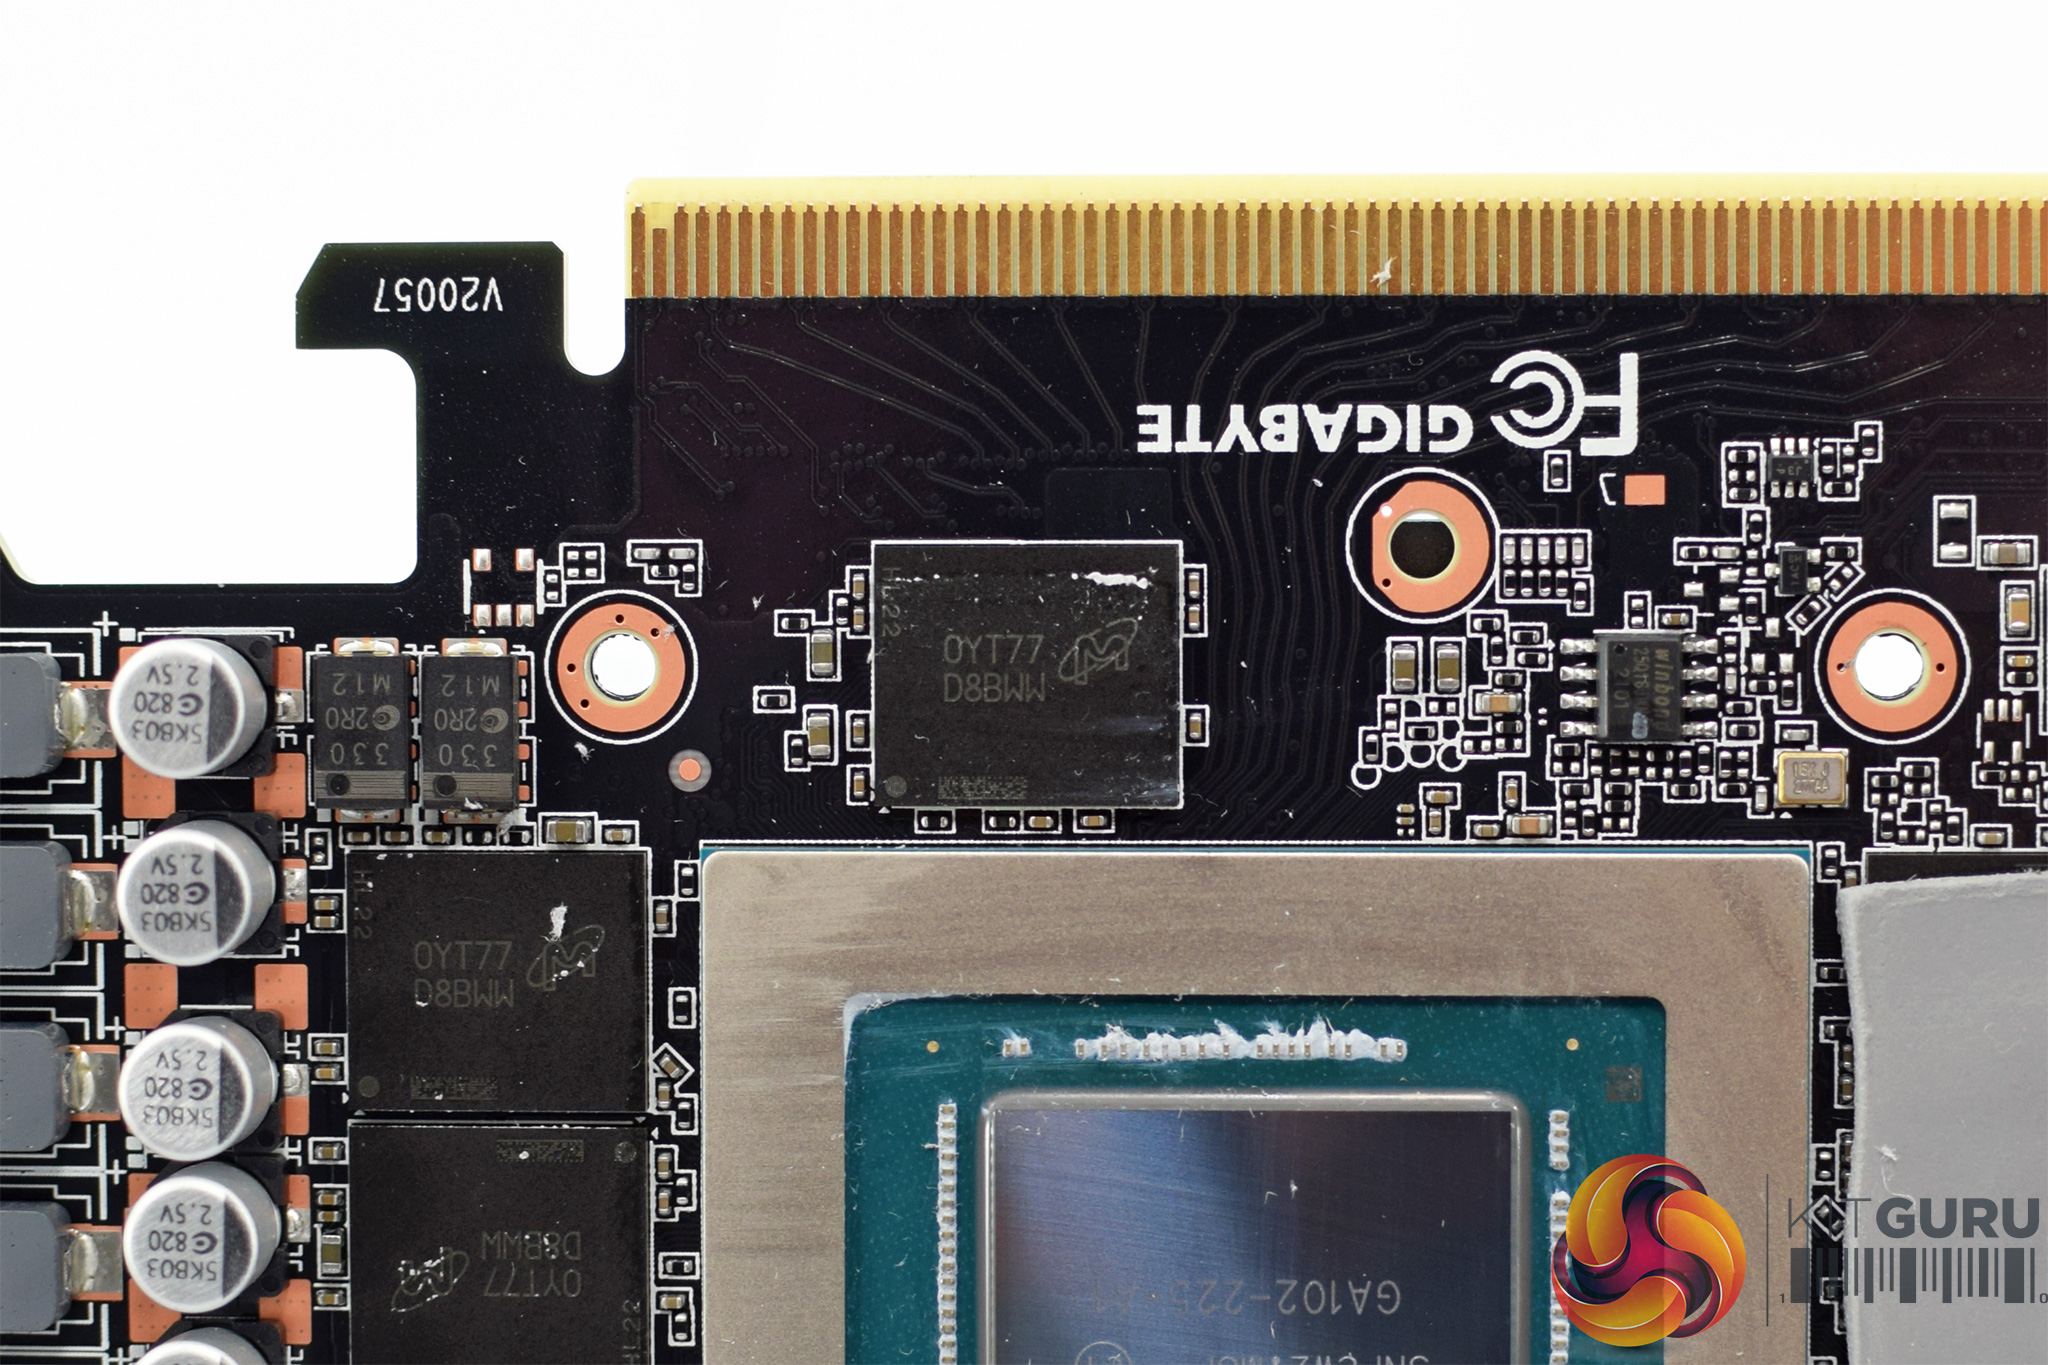
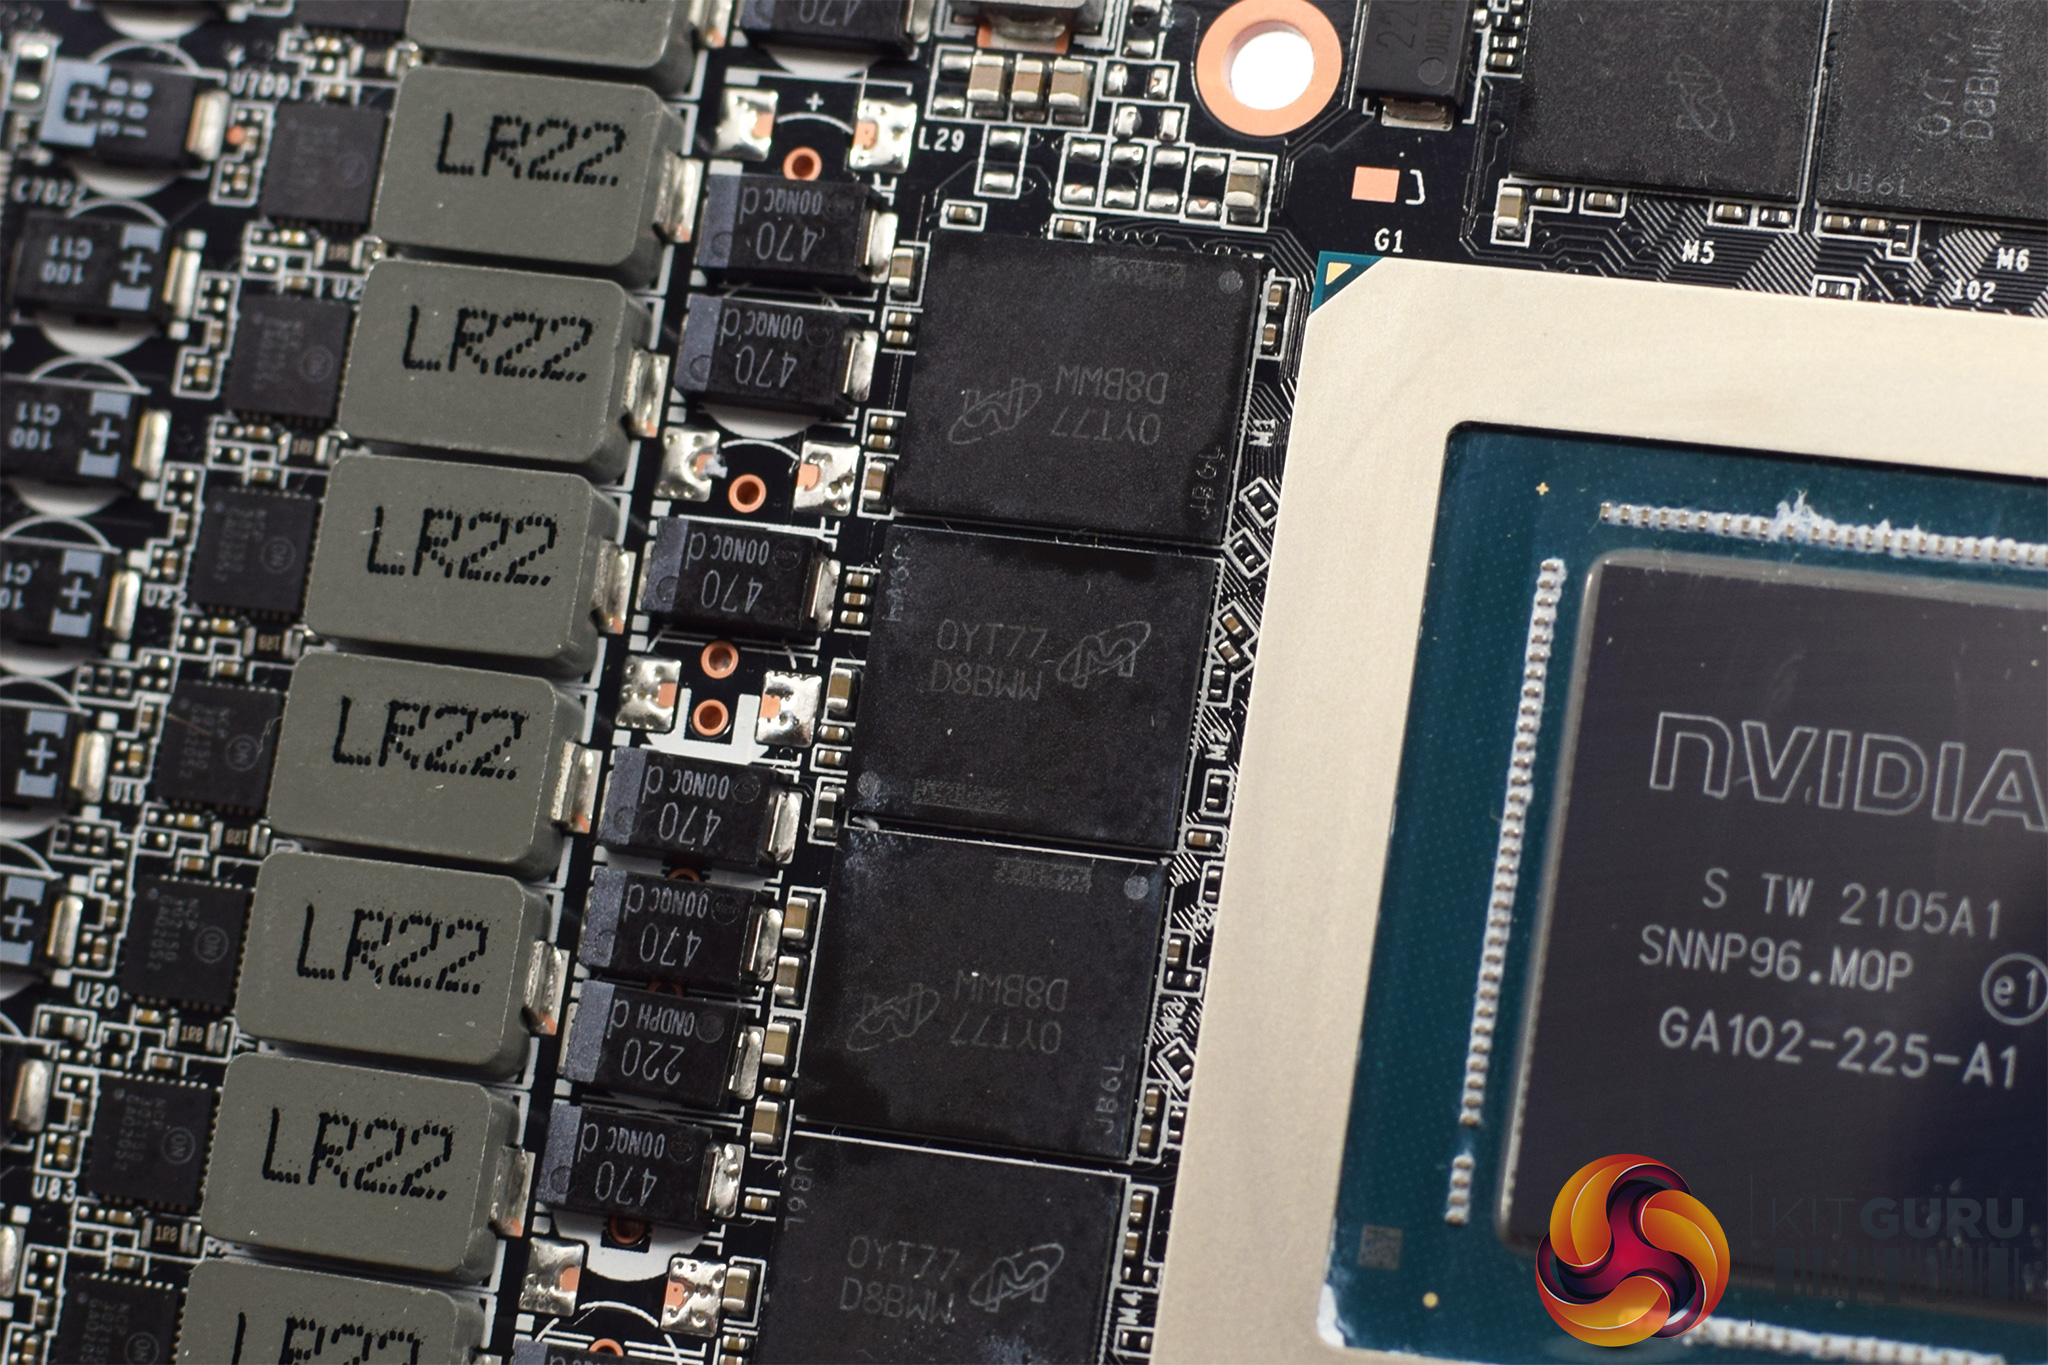
Memory is supplied by Micron, with the model code 0YT77D8BWW.
As for the cooler, Gigabyte uses two finstacks which are connected by a total of six copper heatpipes. A central copper baseplate is used to make contract with both the GPU and the memory, while some additional plates contact with the VRM via thermal pads.
The backplate does also use thermal pads to contact with the back of the PCB, which can help reduce heat slightly.
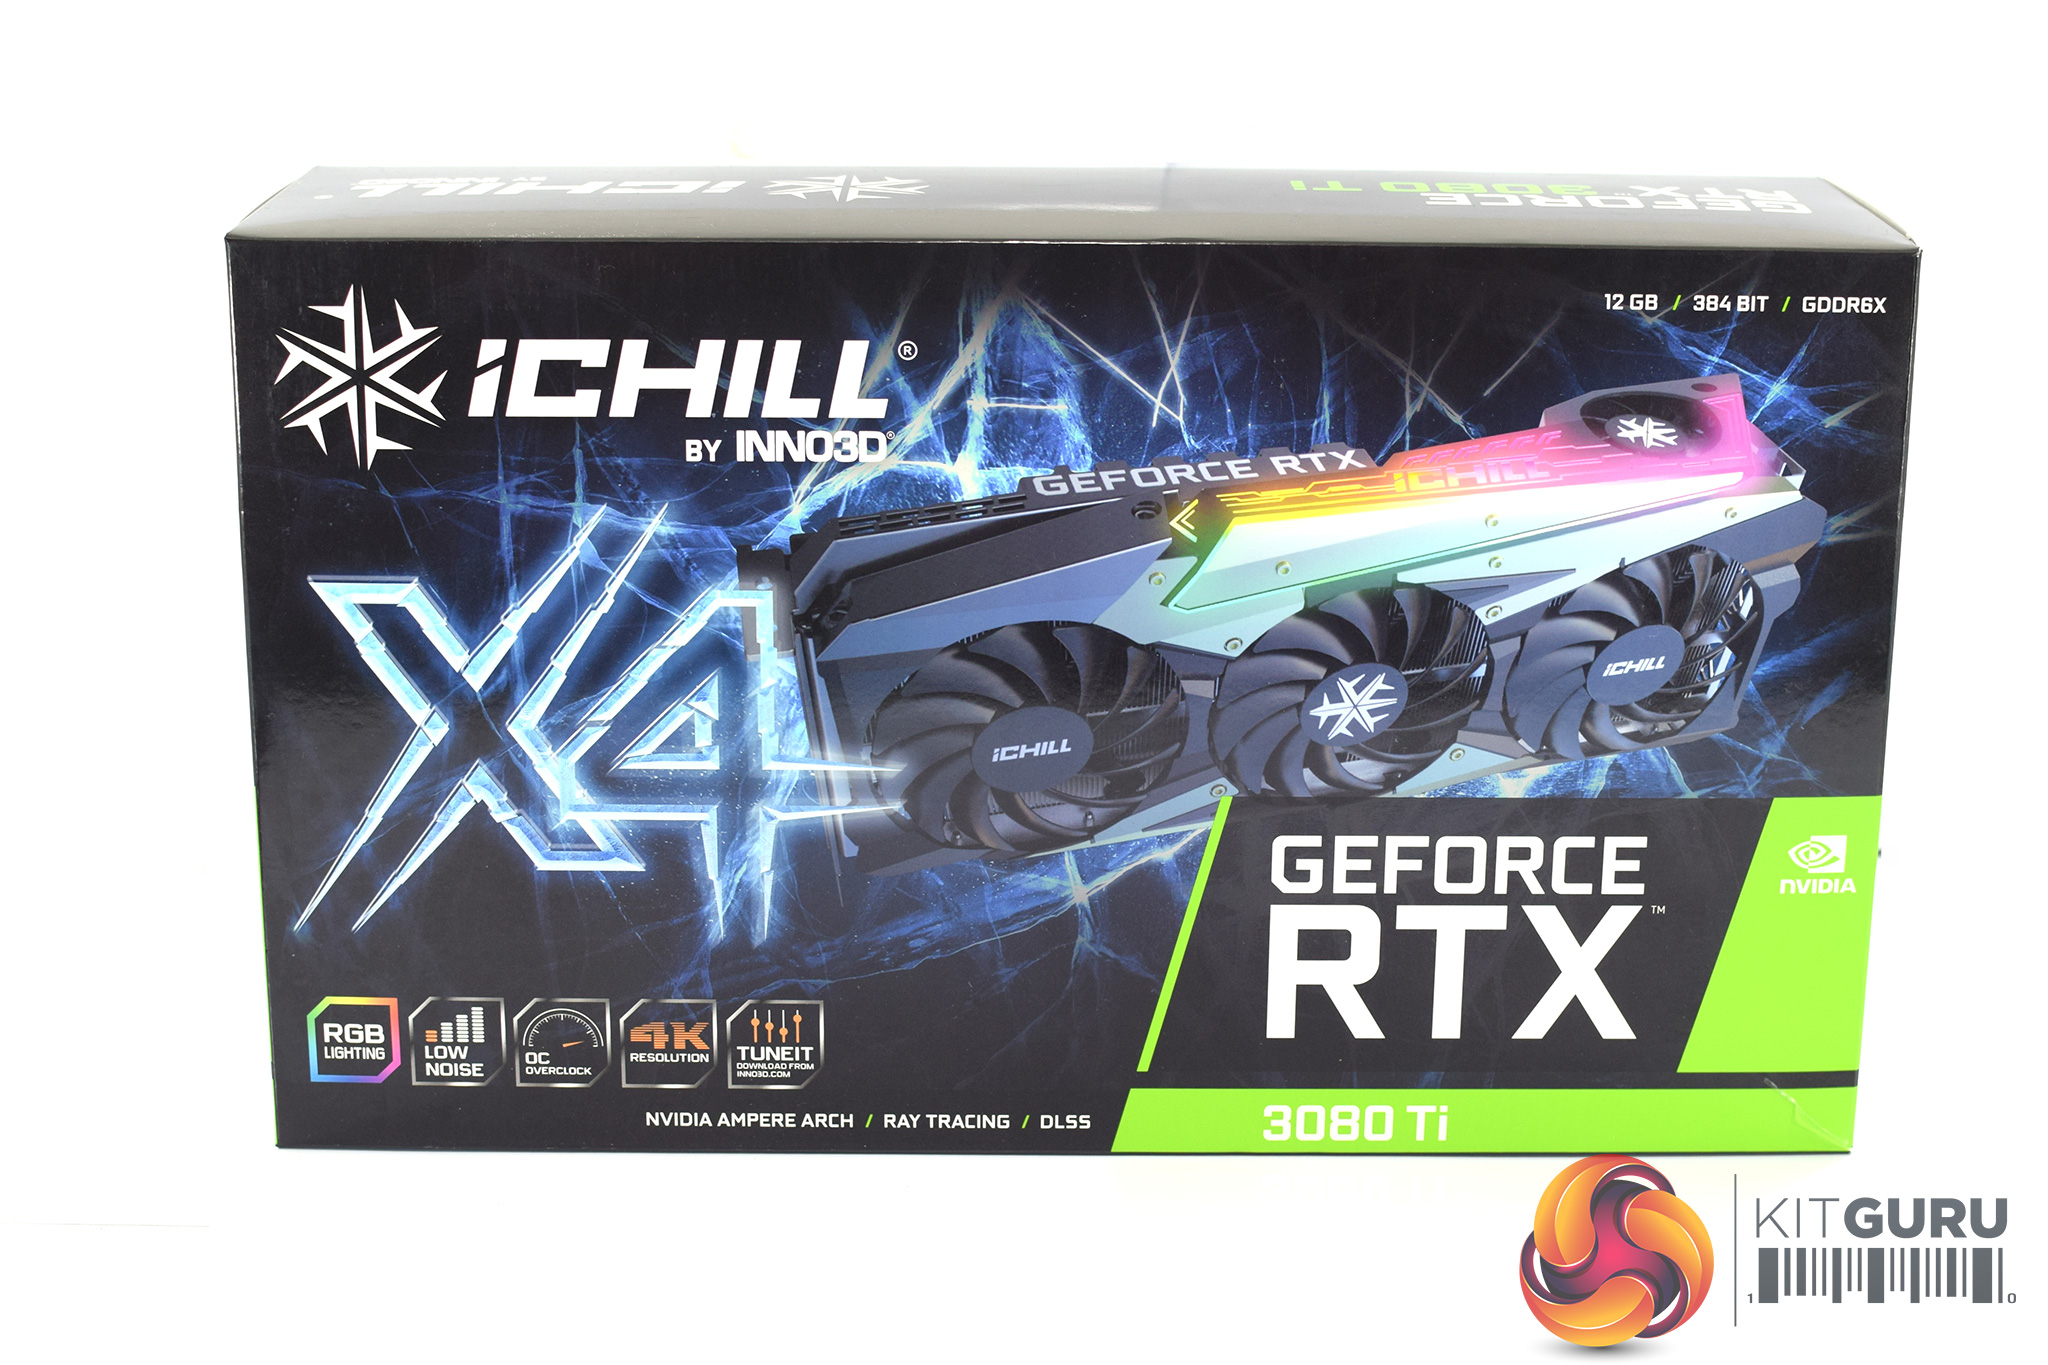

As for the Inno3D RTX 3080 Ti iChill X4, this ships in an eye-catching box, with a large image of the card visible next to the X4 branding.
Inside we find the usual array of documentation, but also two RGB cables which can be used to connect the card to your motherboard (or other RGB device) to control the lighting that way.
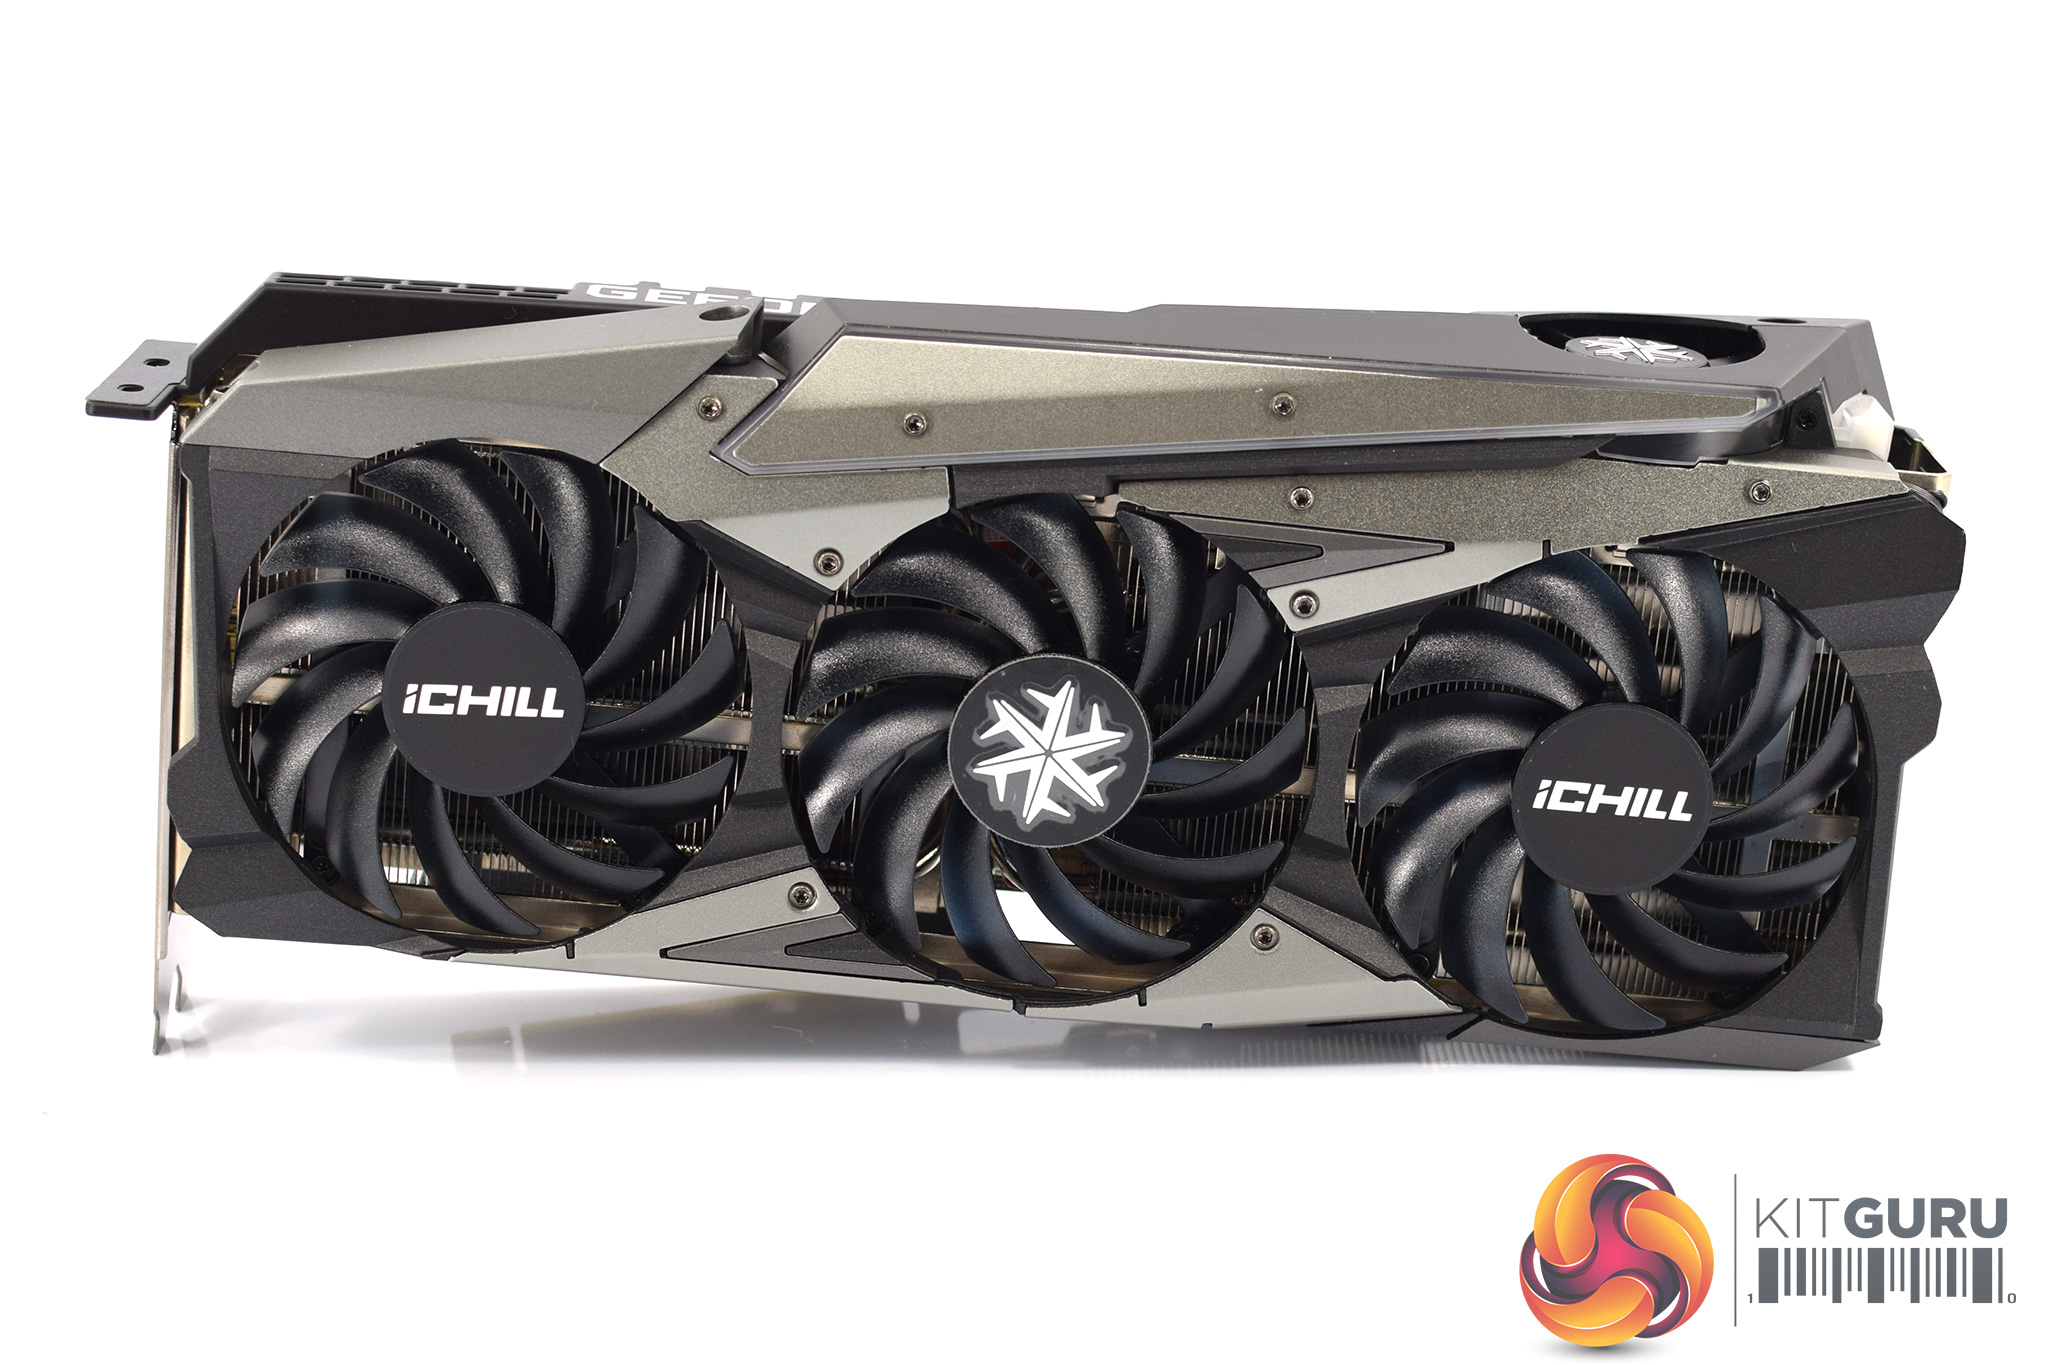
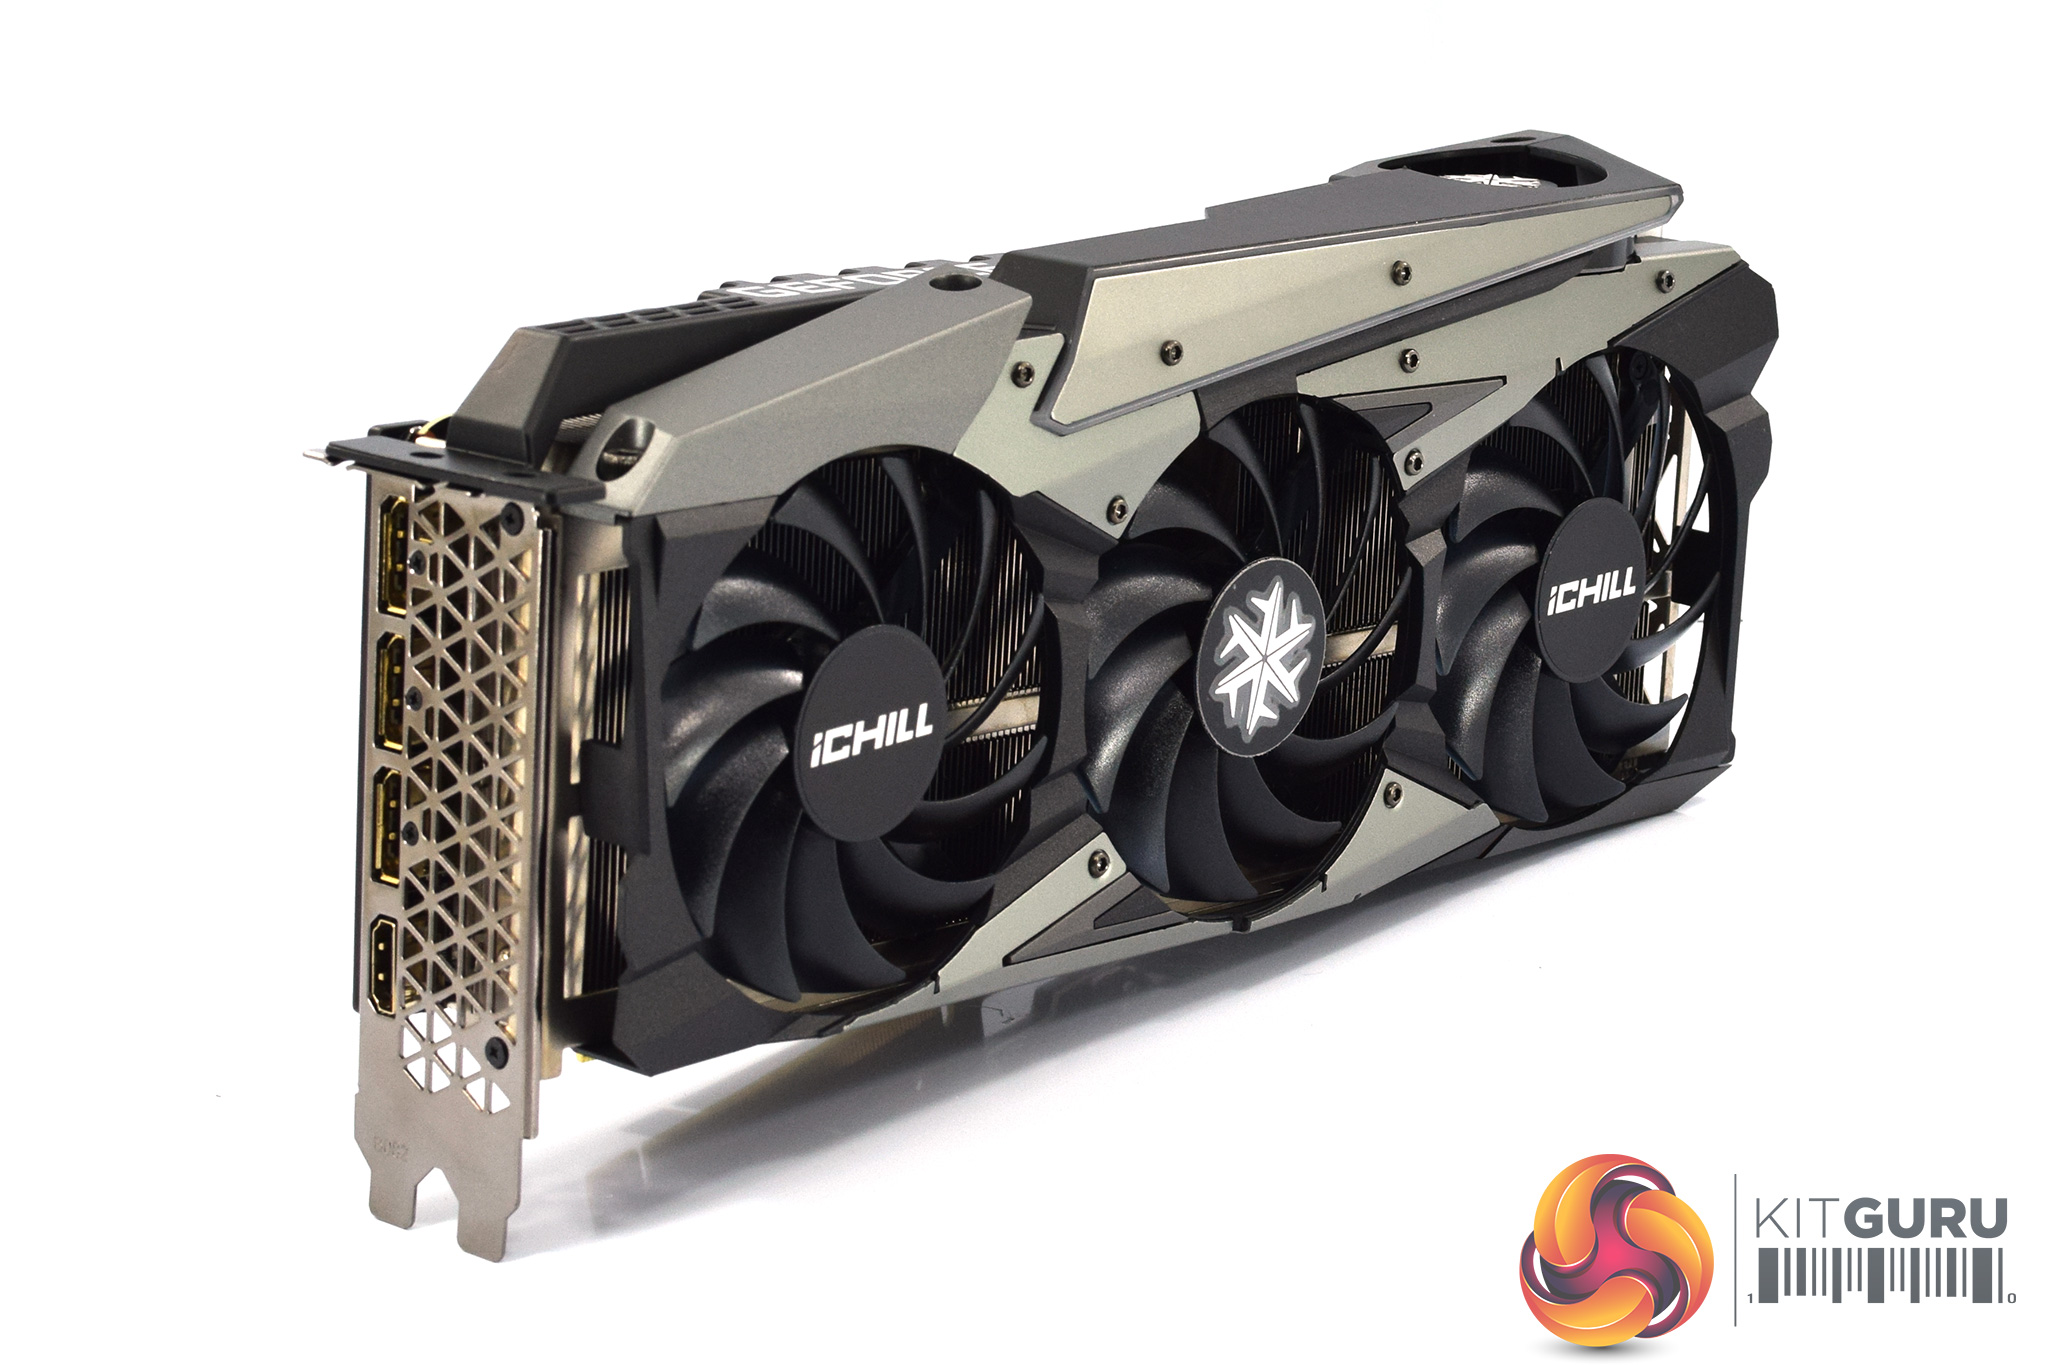
The card itself is certainly not for the faint of heart. It sports a very aggressive design, using a combination of metal and plastic, with plenty of angles and sharp edges. It's certainly not a subtle design!
We can also note three 90mm fans used, but the iChill X4 has a party trick – it actually has a fourth fan placed on the front side of the card, used to provide extra cooling for the VRM. It's quite unique.
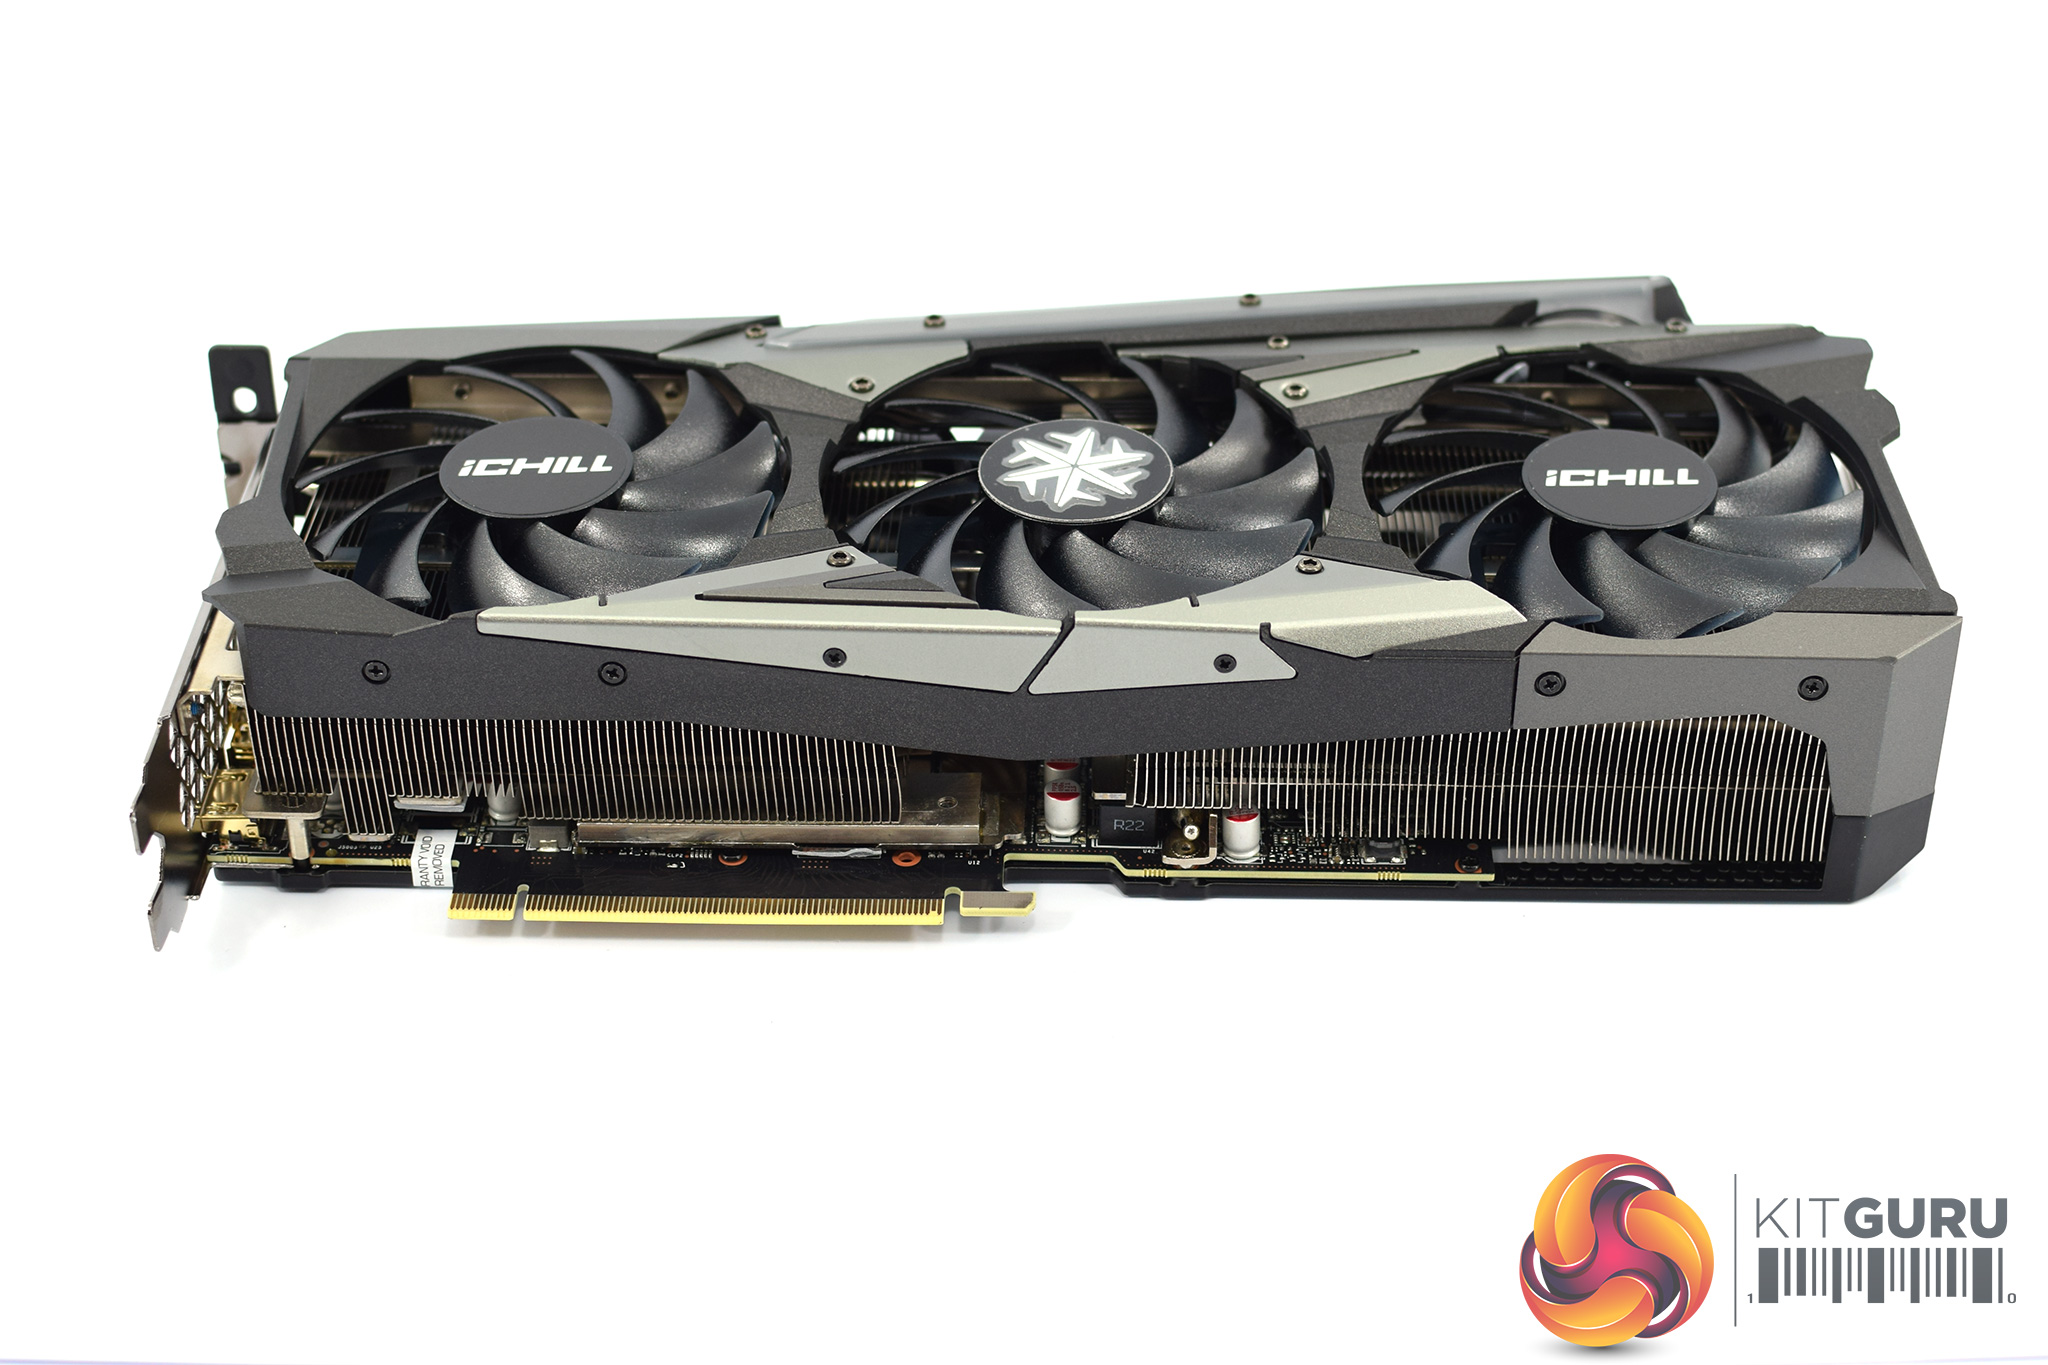

As for sizing, the X4 measures 300 x 135mm, while it's approximately 58mm thick, so again you will need three free expansion slots.
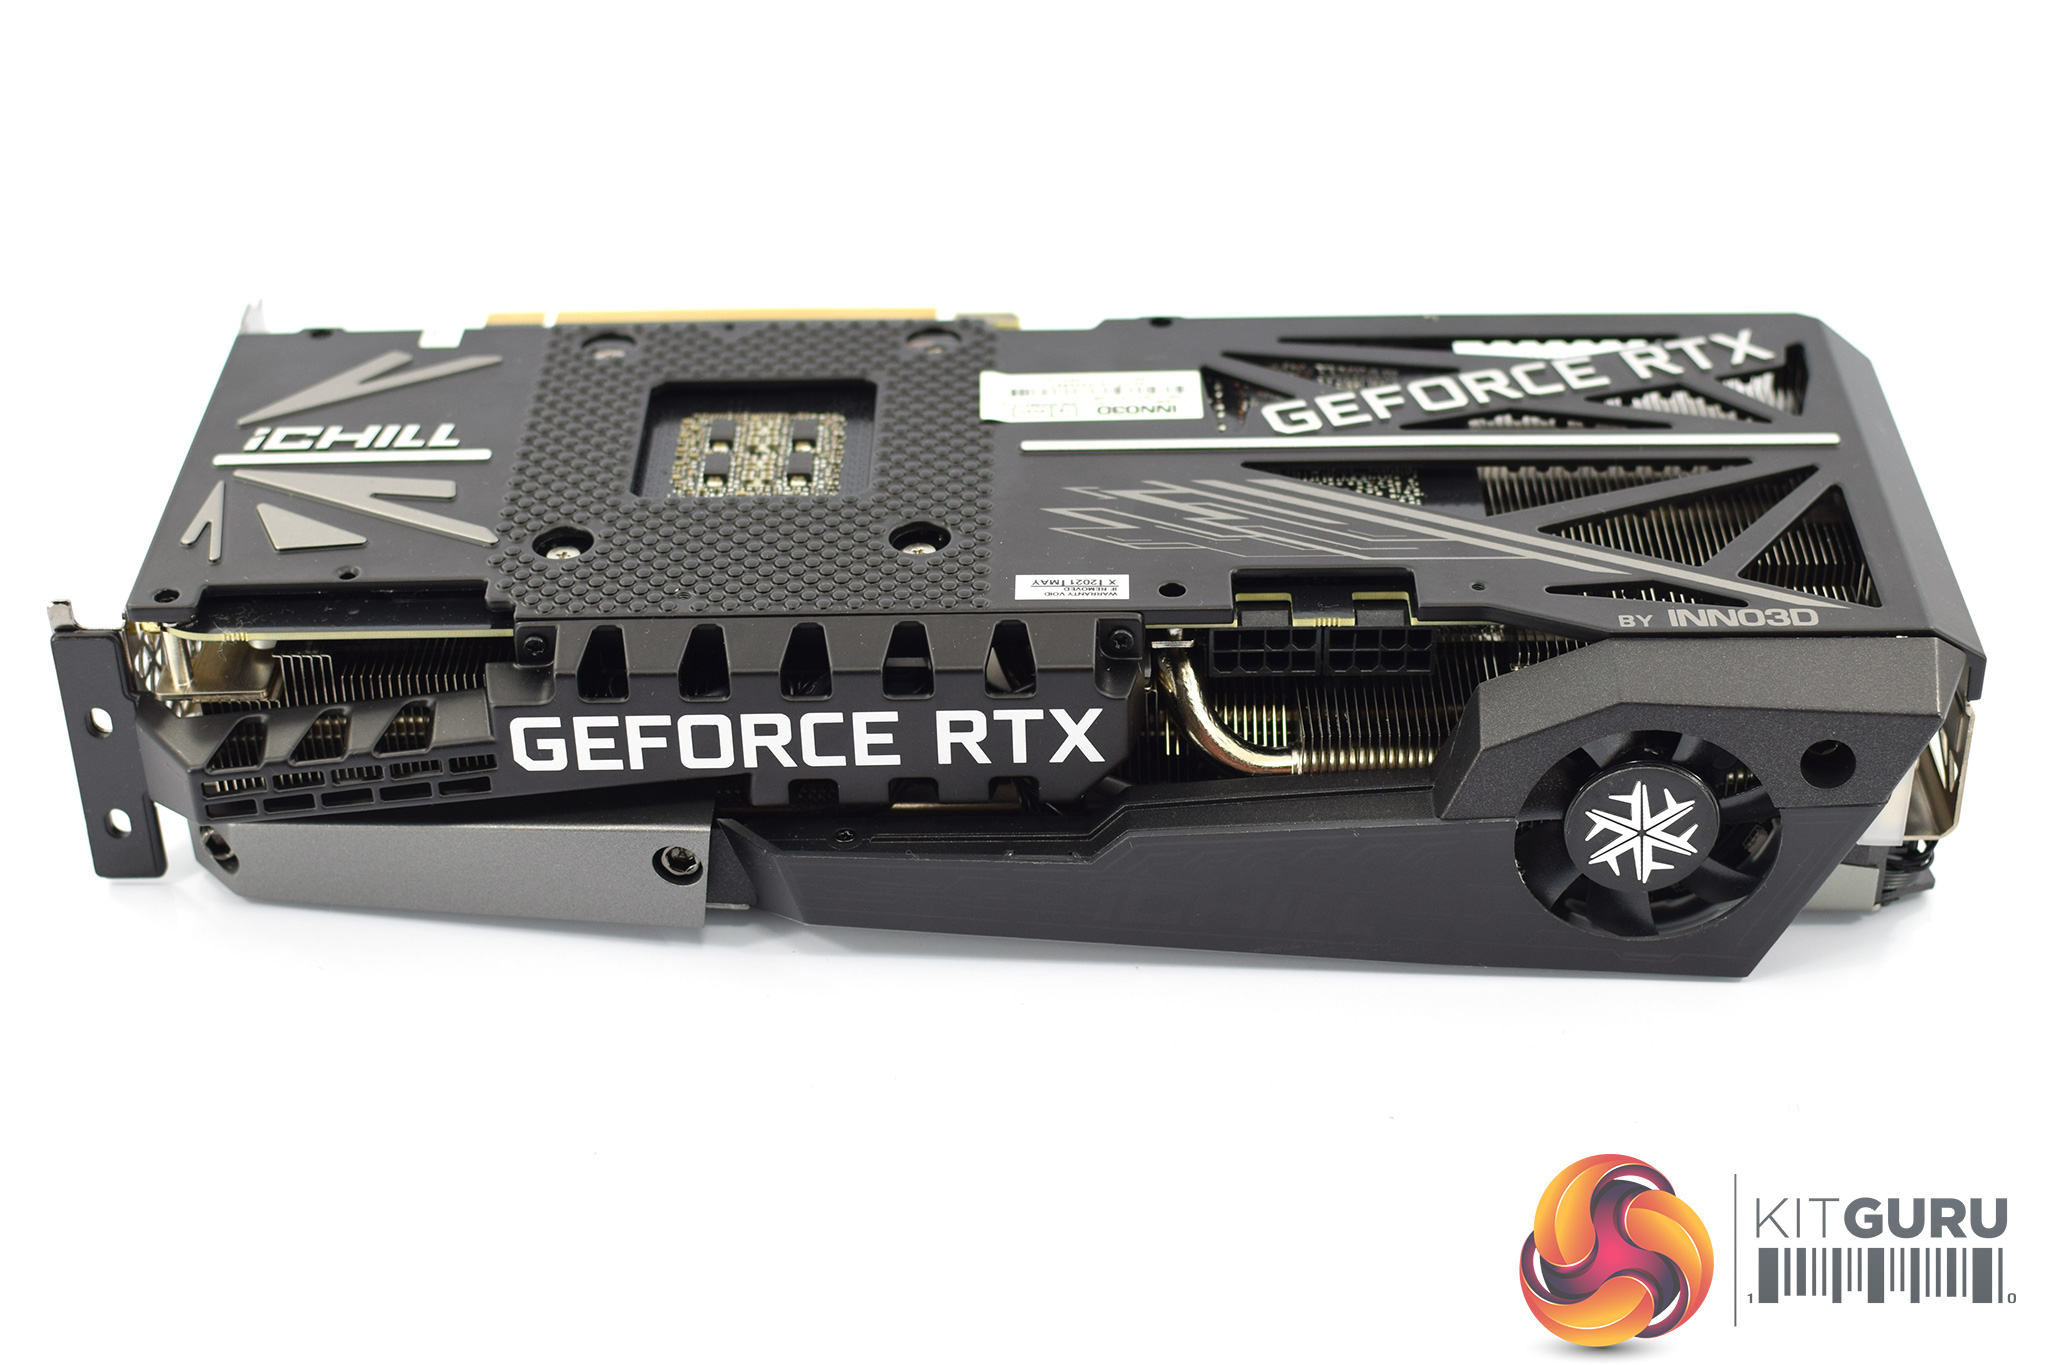
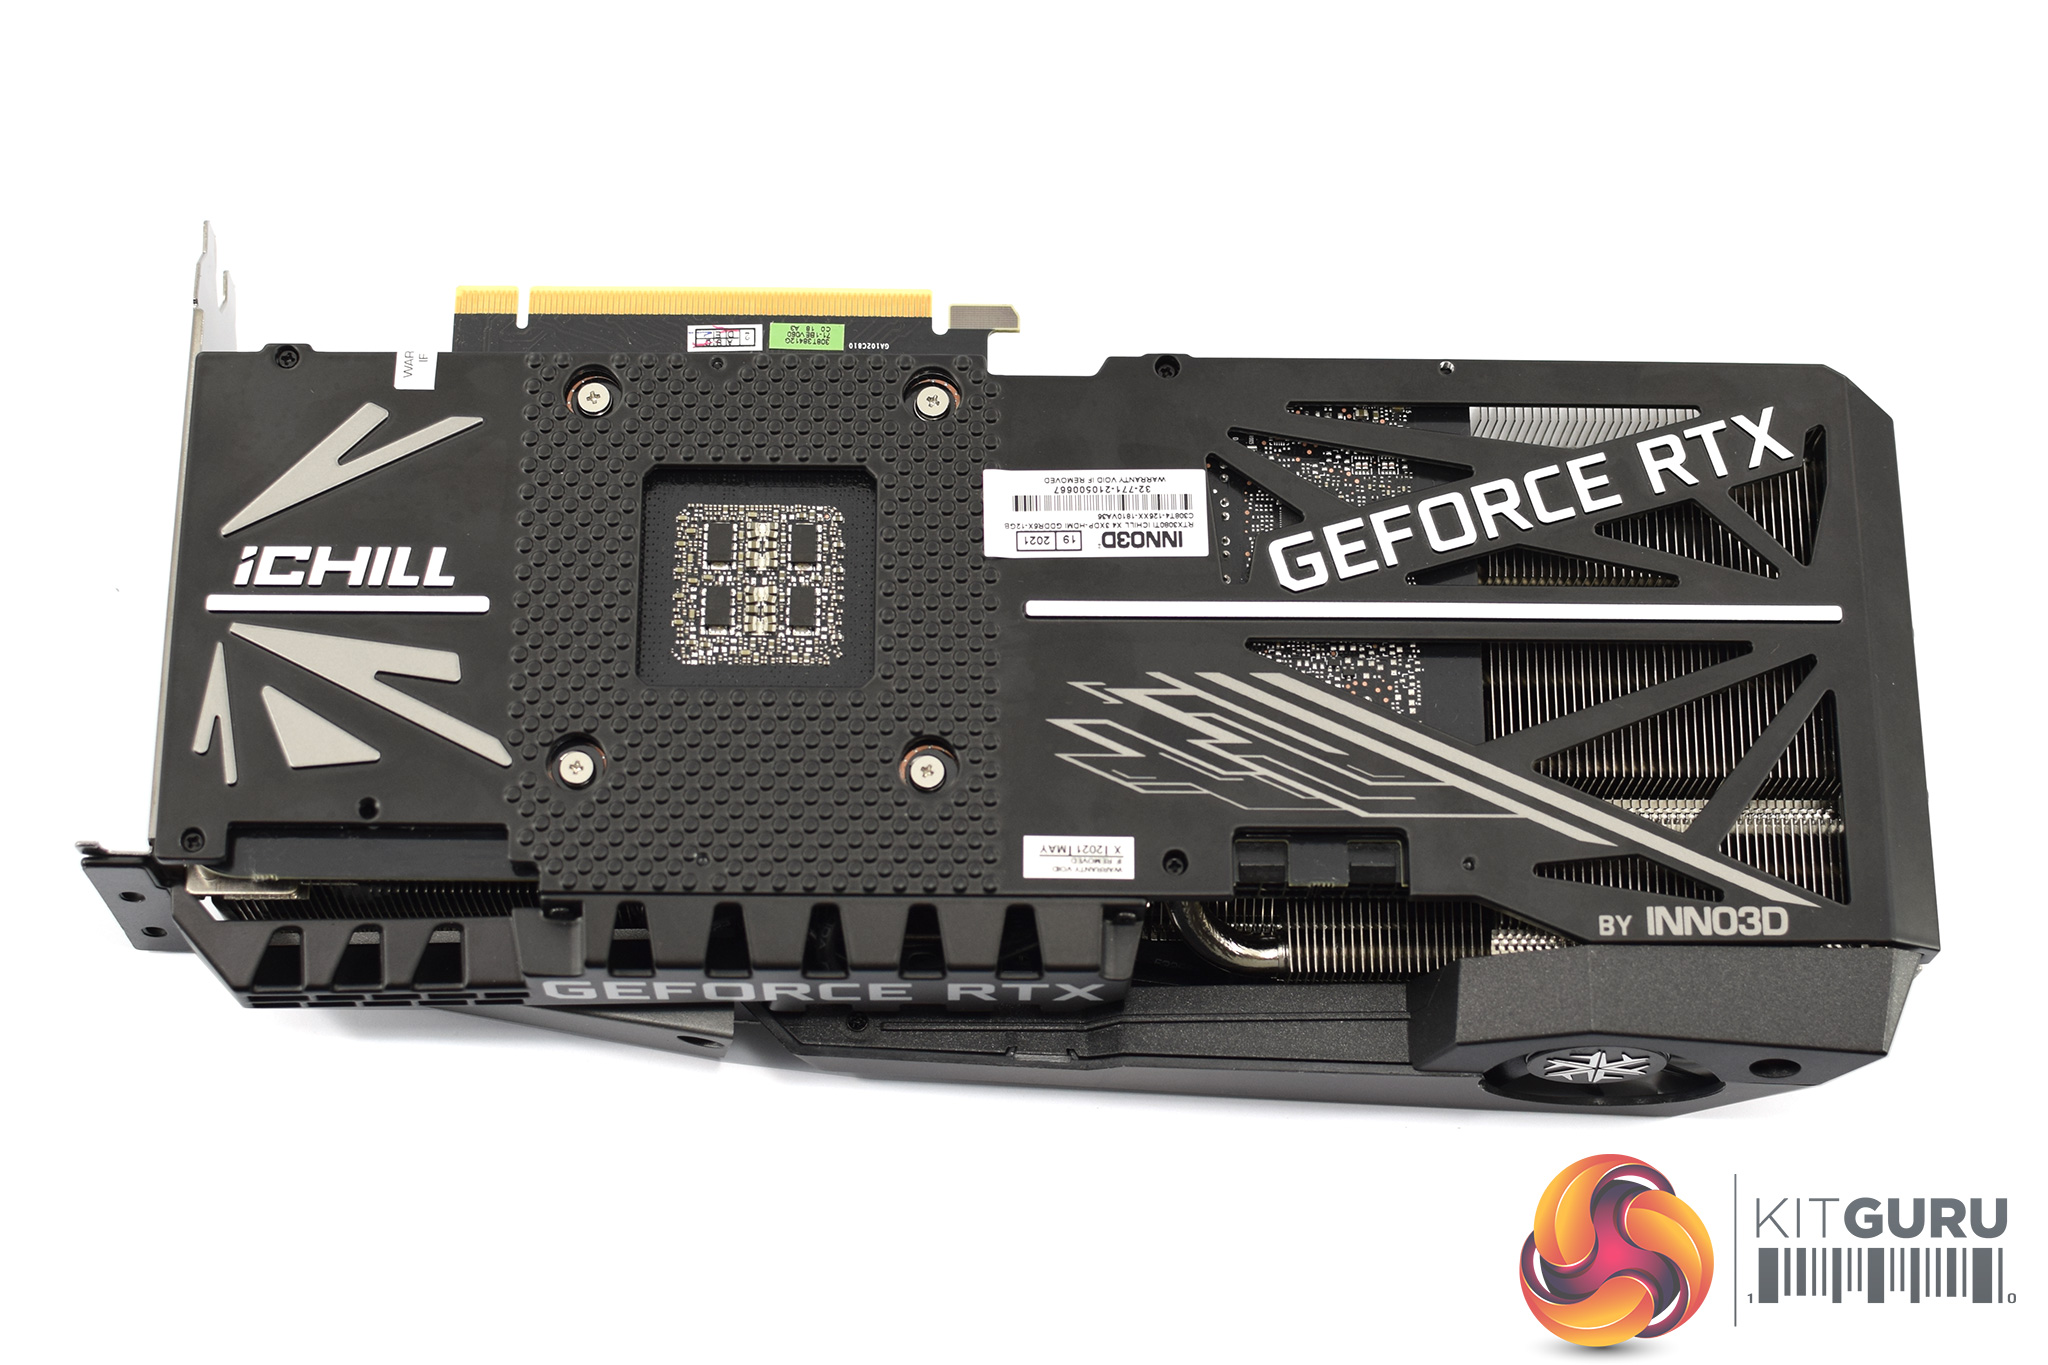
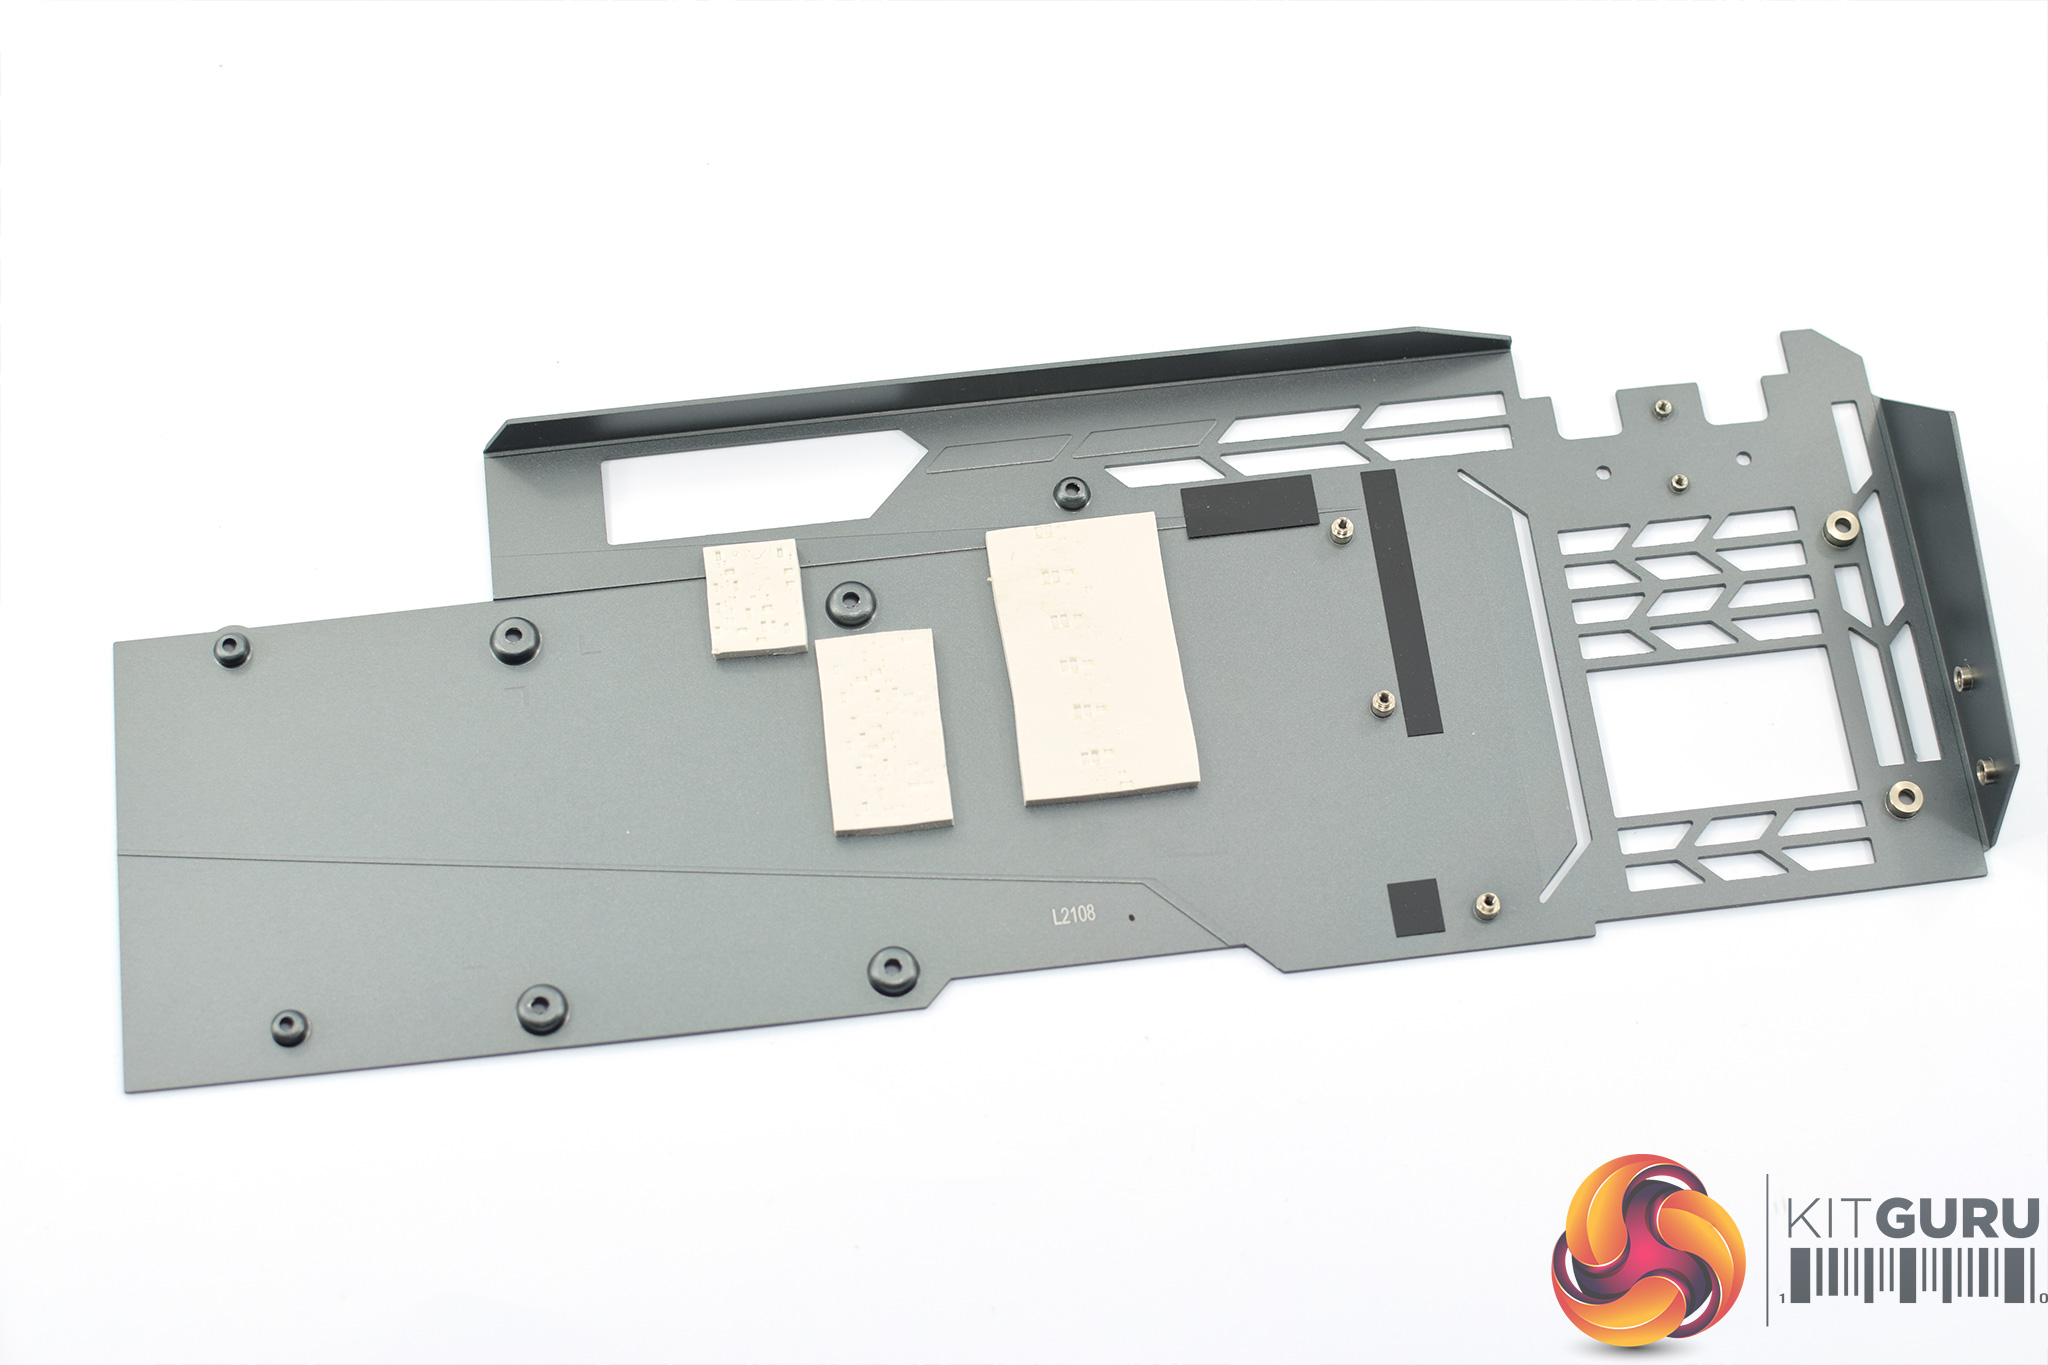
Looking at the backplate, it's keeping in trend with a rather eye-catching design – Inno3D is certainly not playing things ‘safe' here, but I do quite admire that!
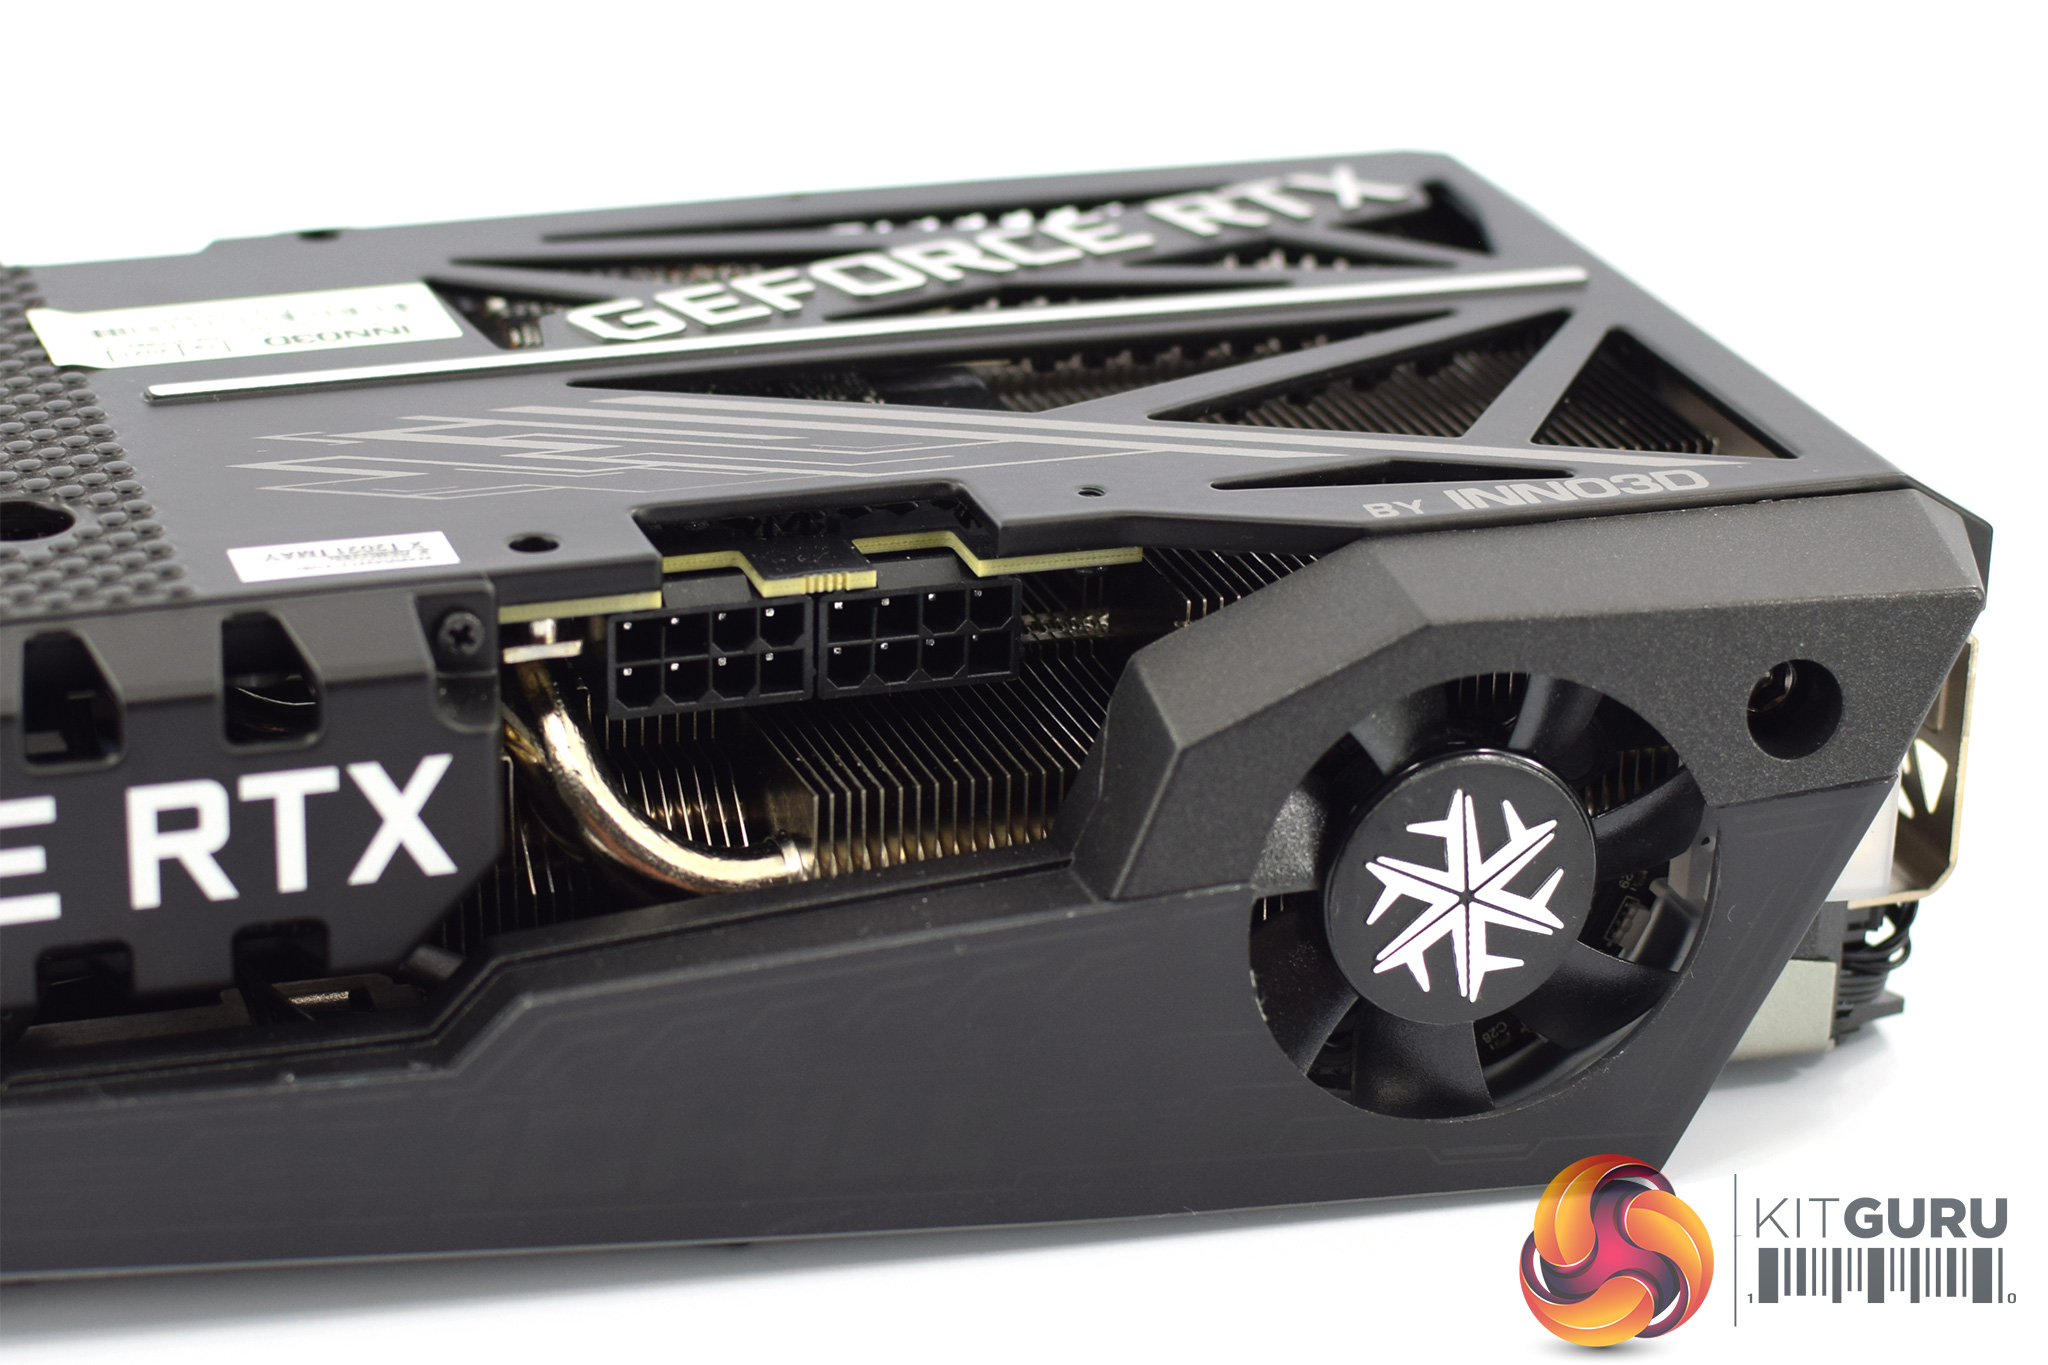
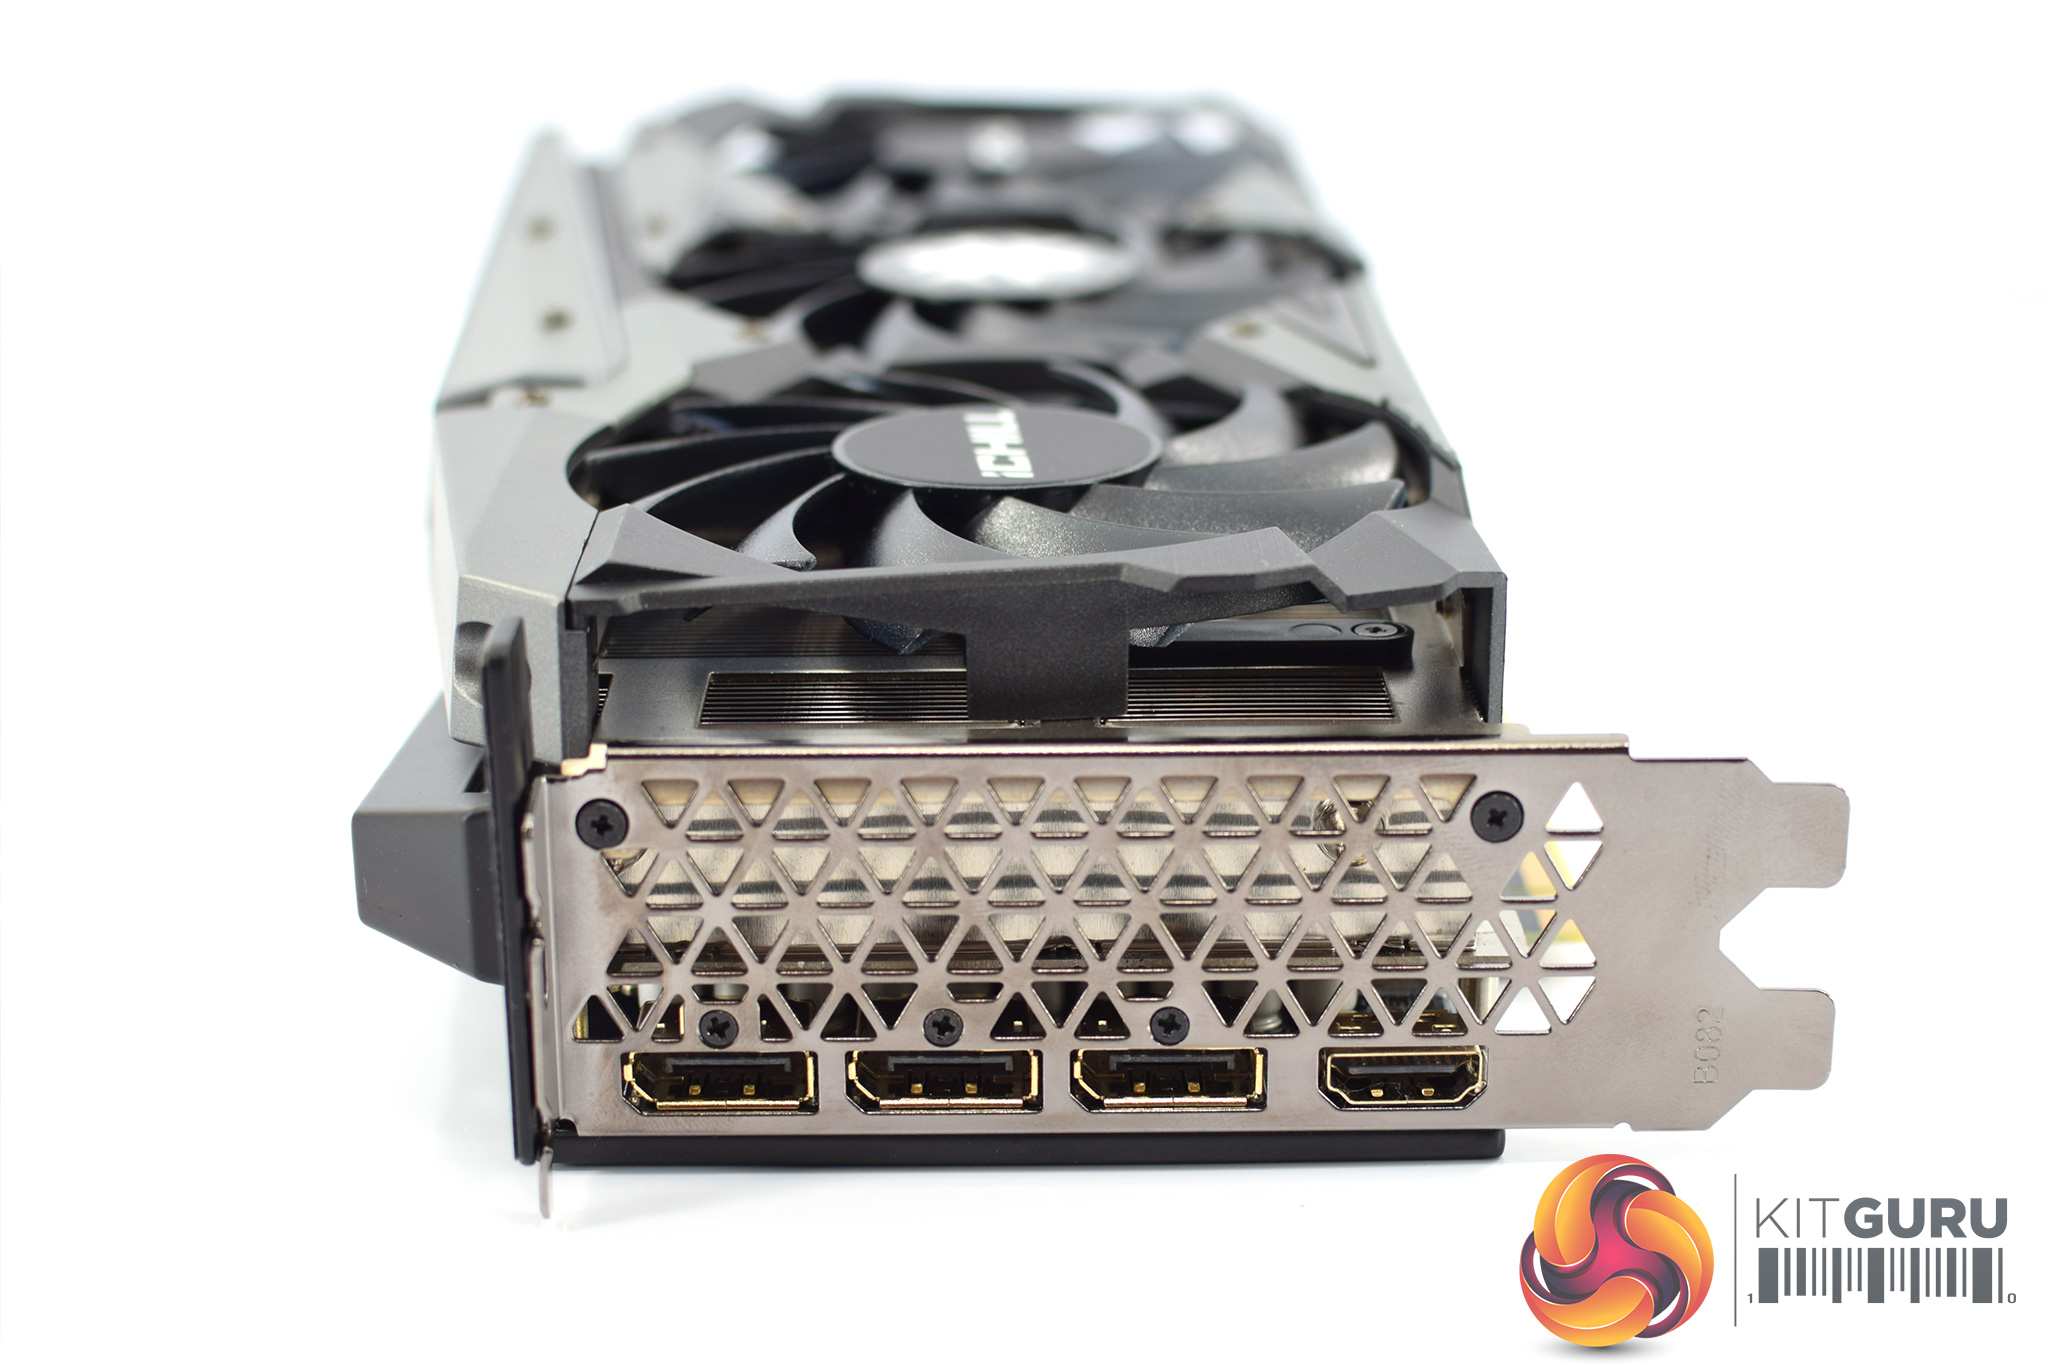
We can also note 2x 8-pin power inputs, while we also get a closer look at the 45mm fan designed to aid VRM cooling. For video outputs, we find 3x DisplayPort 1.4 and 1x HDMI 2.1.
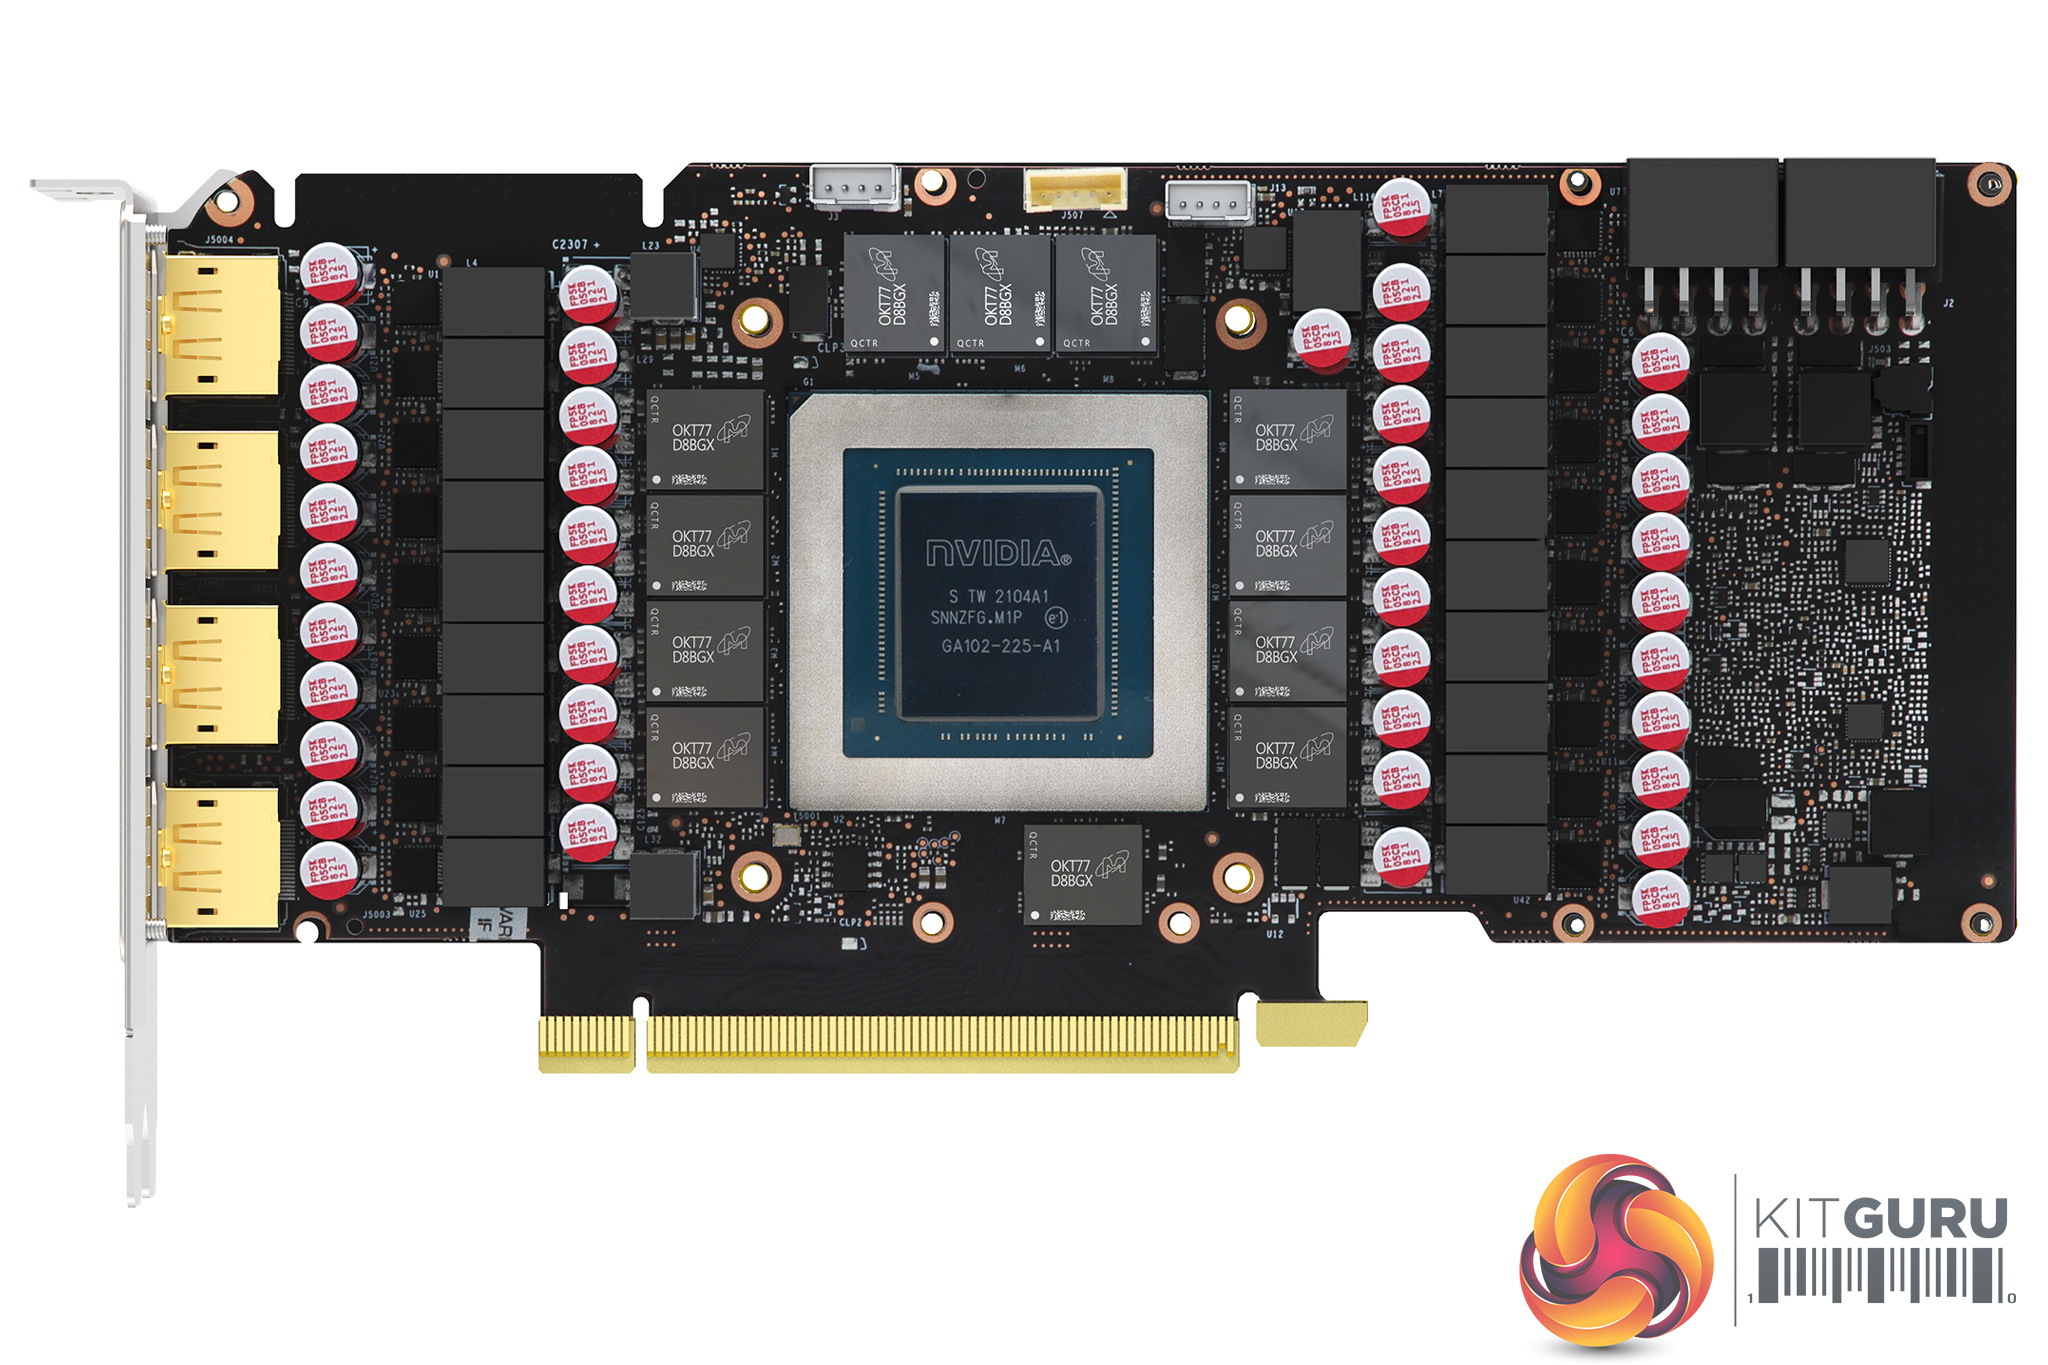
PCB and heatsink images supplied by Inno3D.
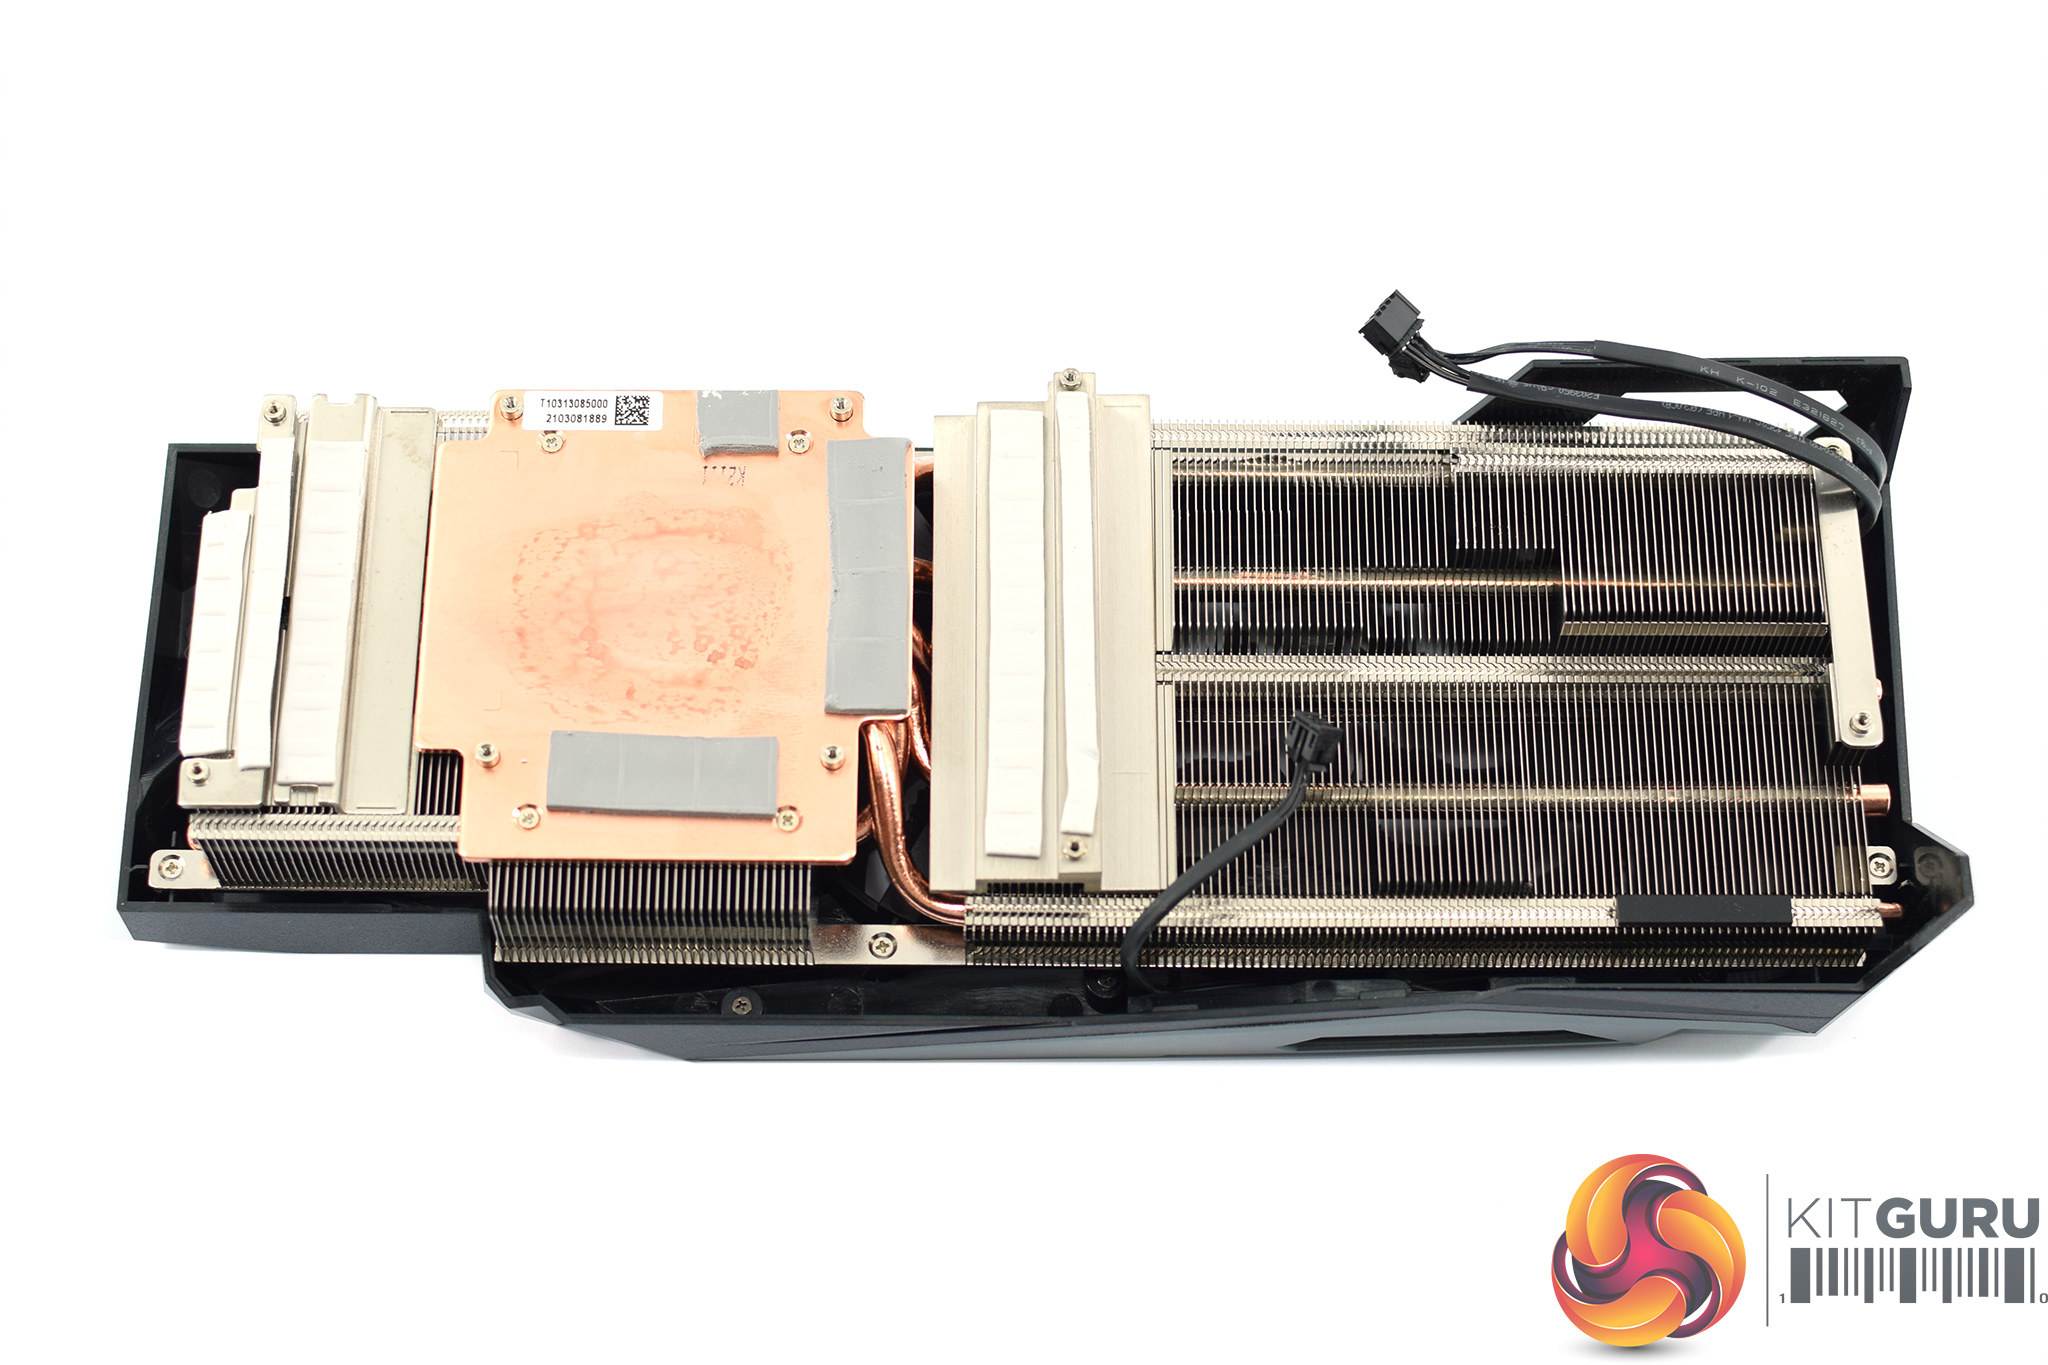
Ahead of this review, Inno3D asked us to not disassemble the card, likely so thermal results aren't affected for any future testing. The company did, however, supply us with render images of the PCB and cooler.
While we can't say for certain based on the renders, it appears Inno3D is using the reference design, with a similar layout to the Gigabyte Gaming OC. We can see a total of 19 phases, again likely split with 15 for the GPU and 4 for the memory. Memory is also from Micron, with the model code OKT77D88GX.
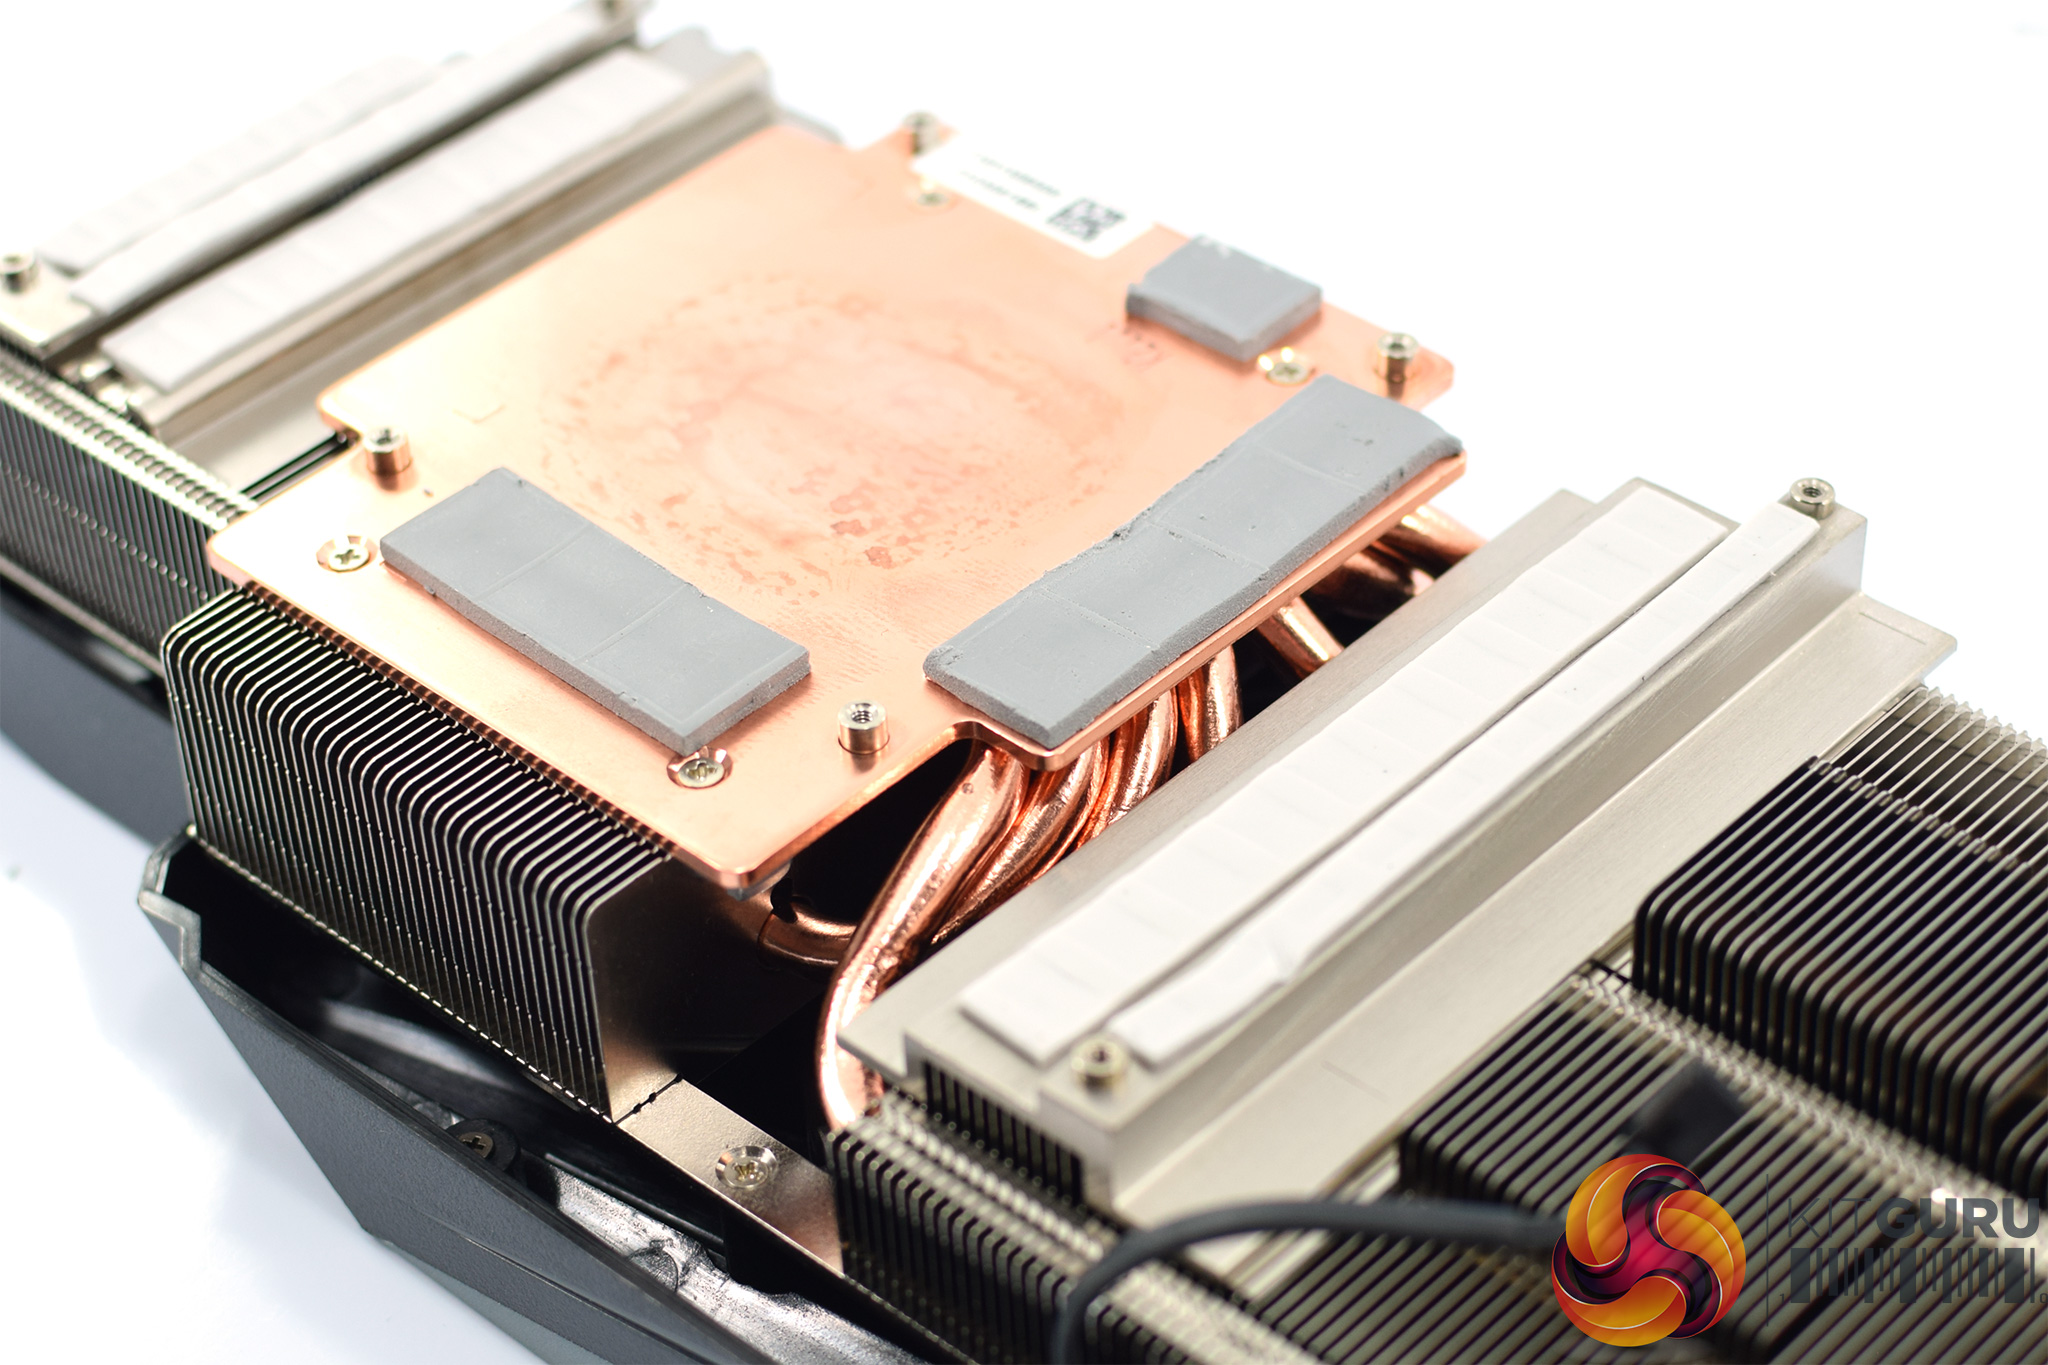
As for the heatsink, this uses a total of eight heatpipes, seven of which make contact with the GPU while the eighth is using for VRM. The memory modules contact with a metal plate section that sits around the central heatpipes.
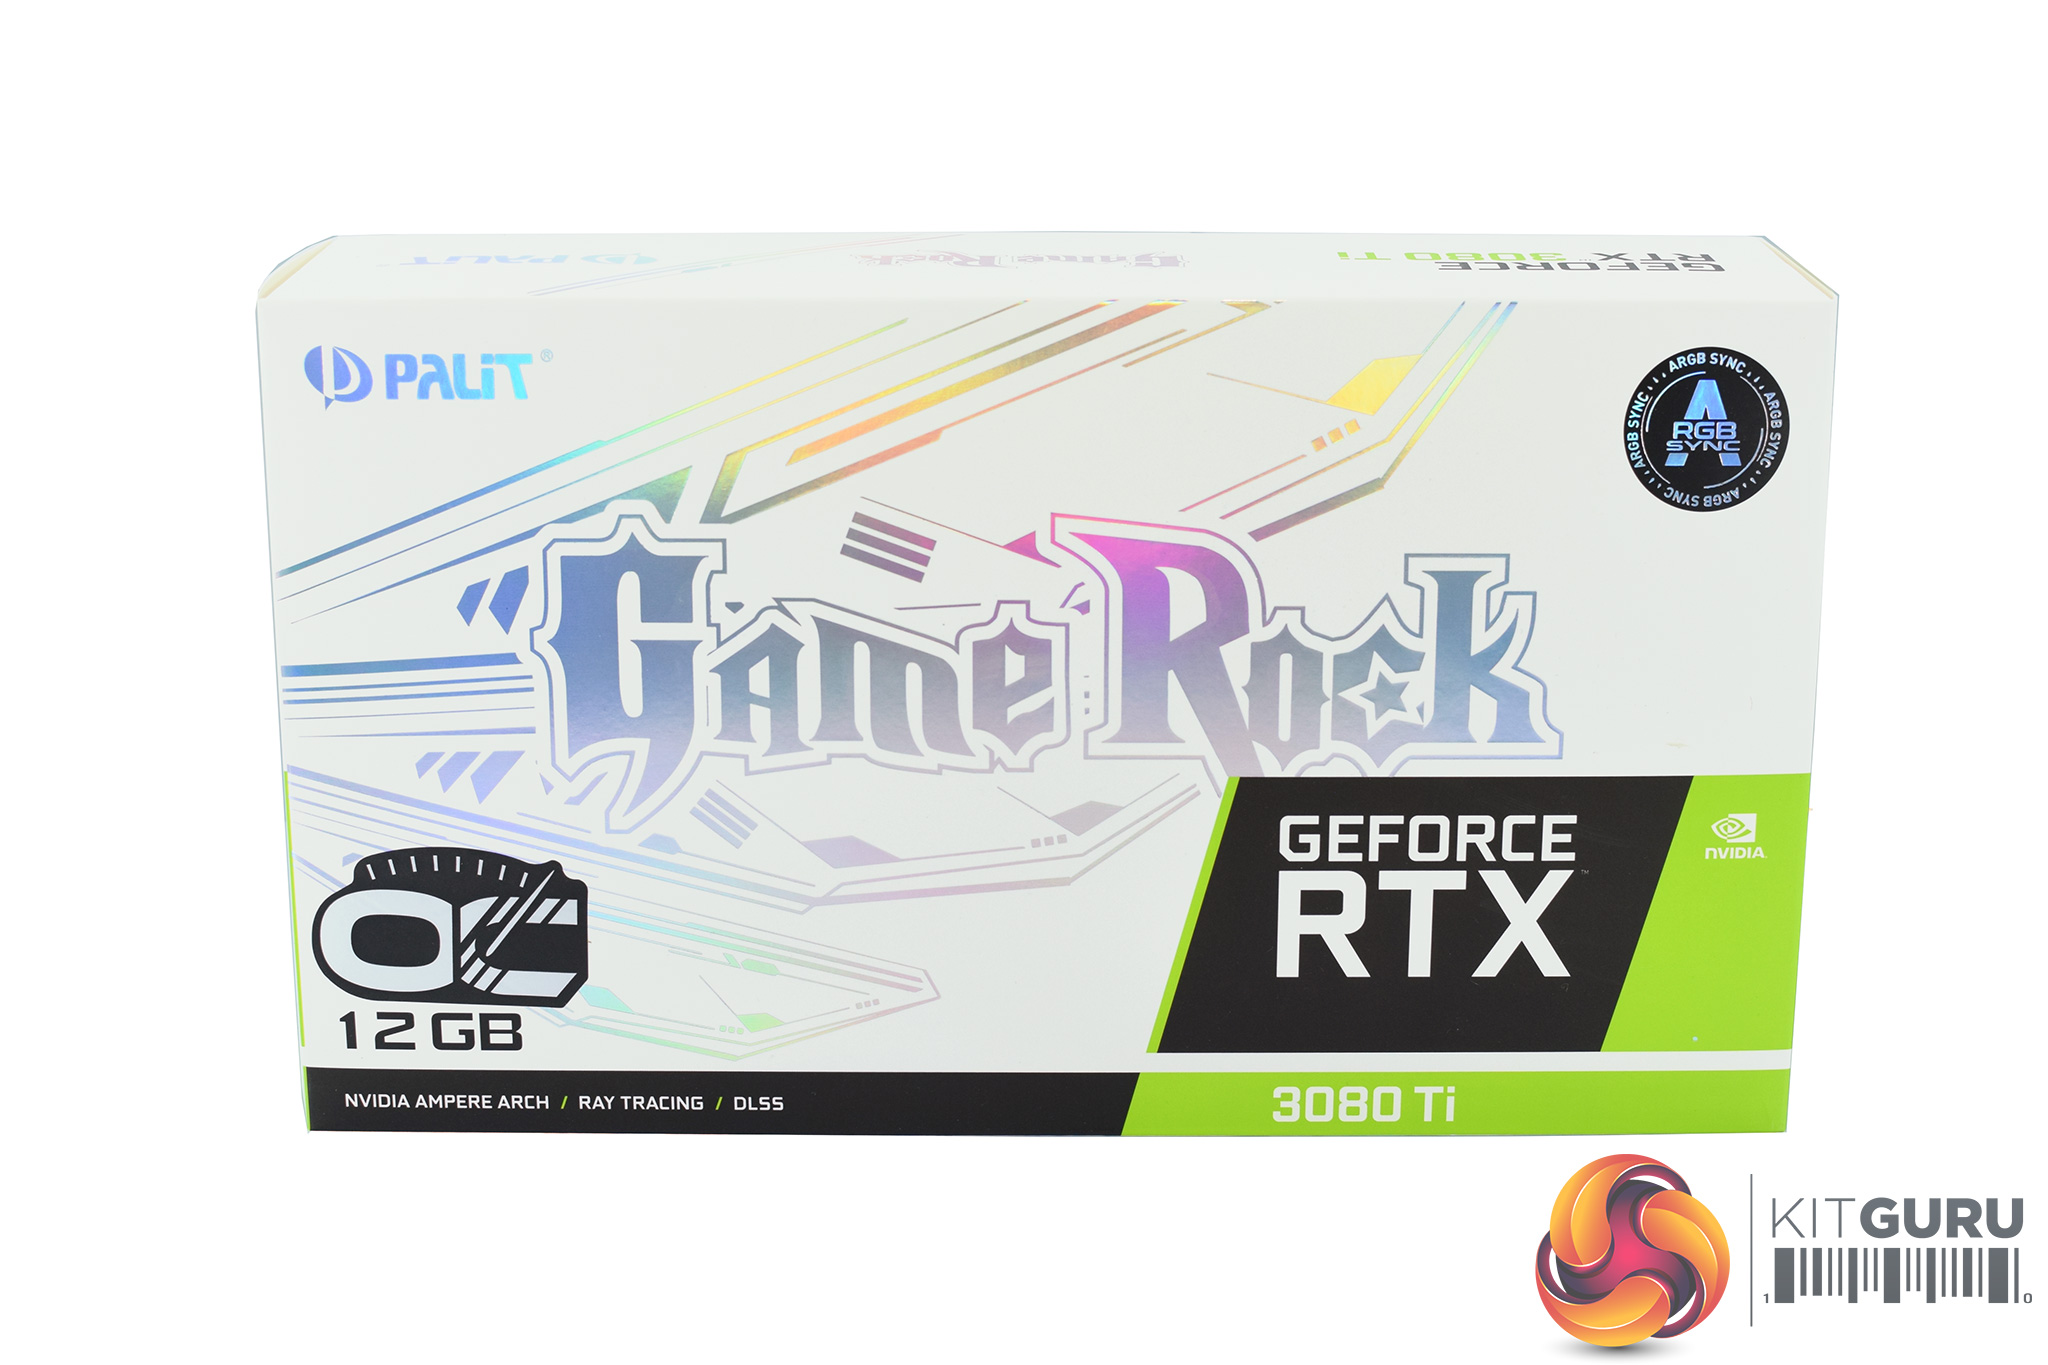
The last card to look at is the Palit RTX 3080 Ti GameRock OC. This ships in a white box, with the GameRock logo taking pride of place on the front.
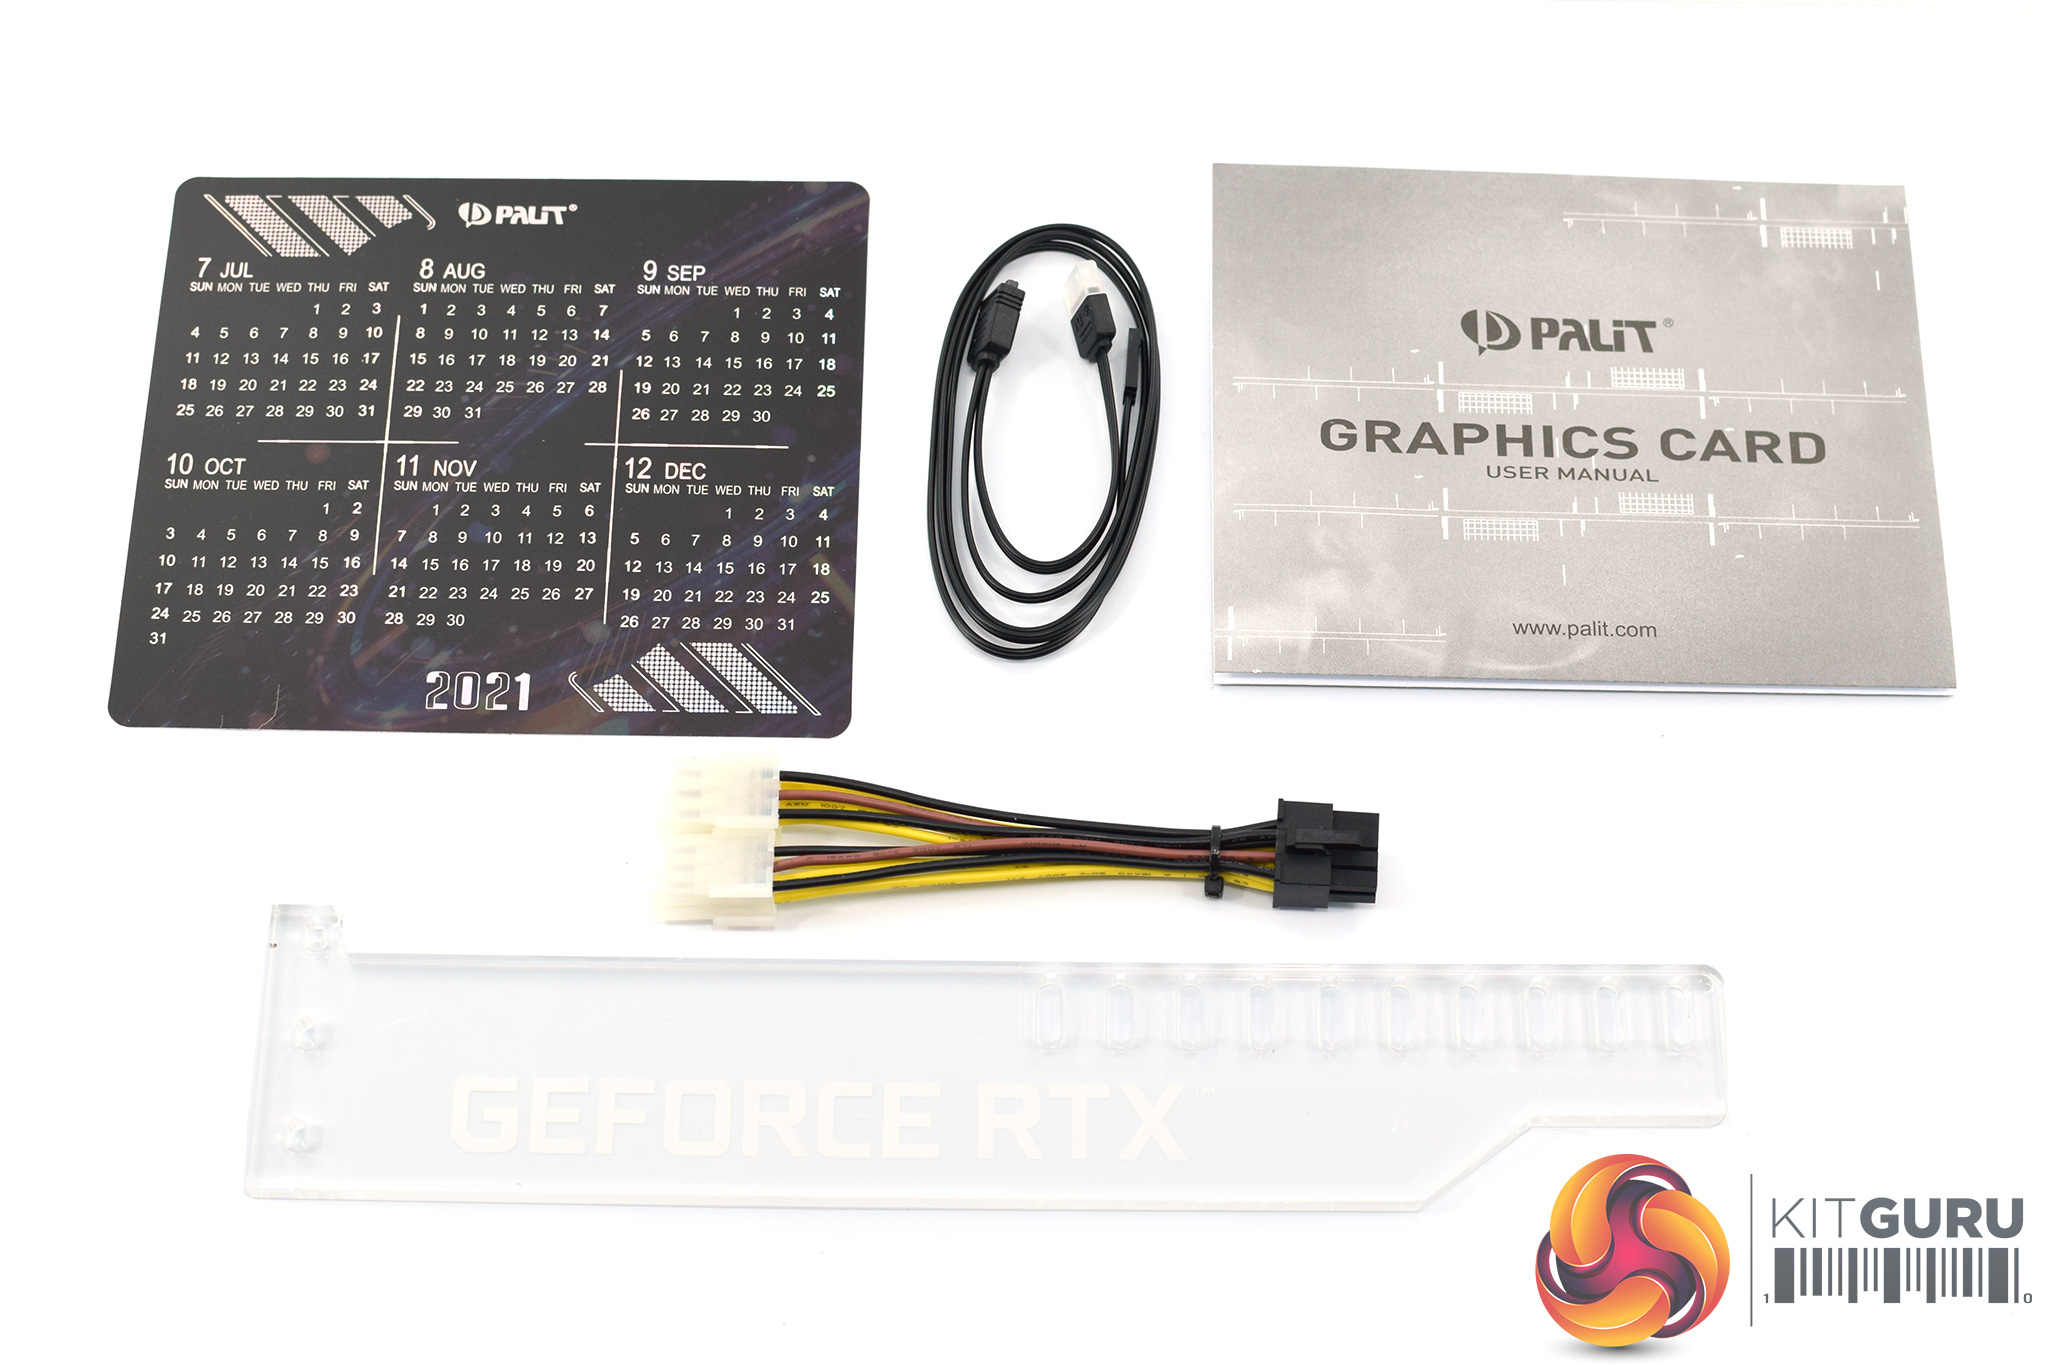
Inside we find a couple of documents, one ARGB cable, one 2x 6-pin to 1x 8-pin power adapter, as well as a plastic support bracket which can be used to help support the graphics card once it's installed.
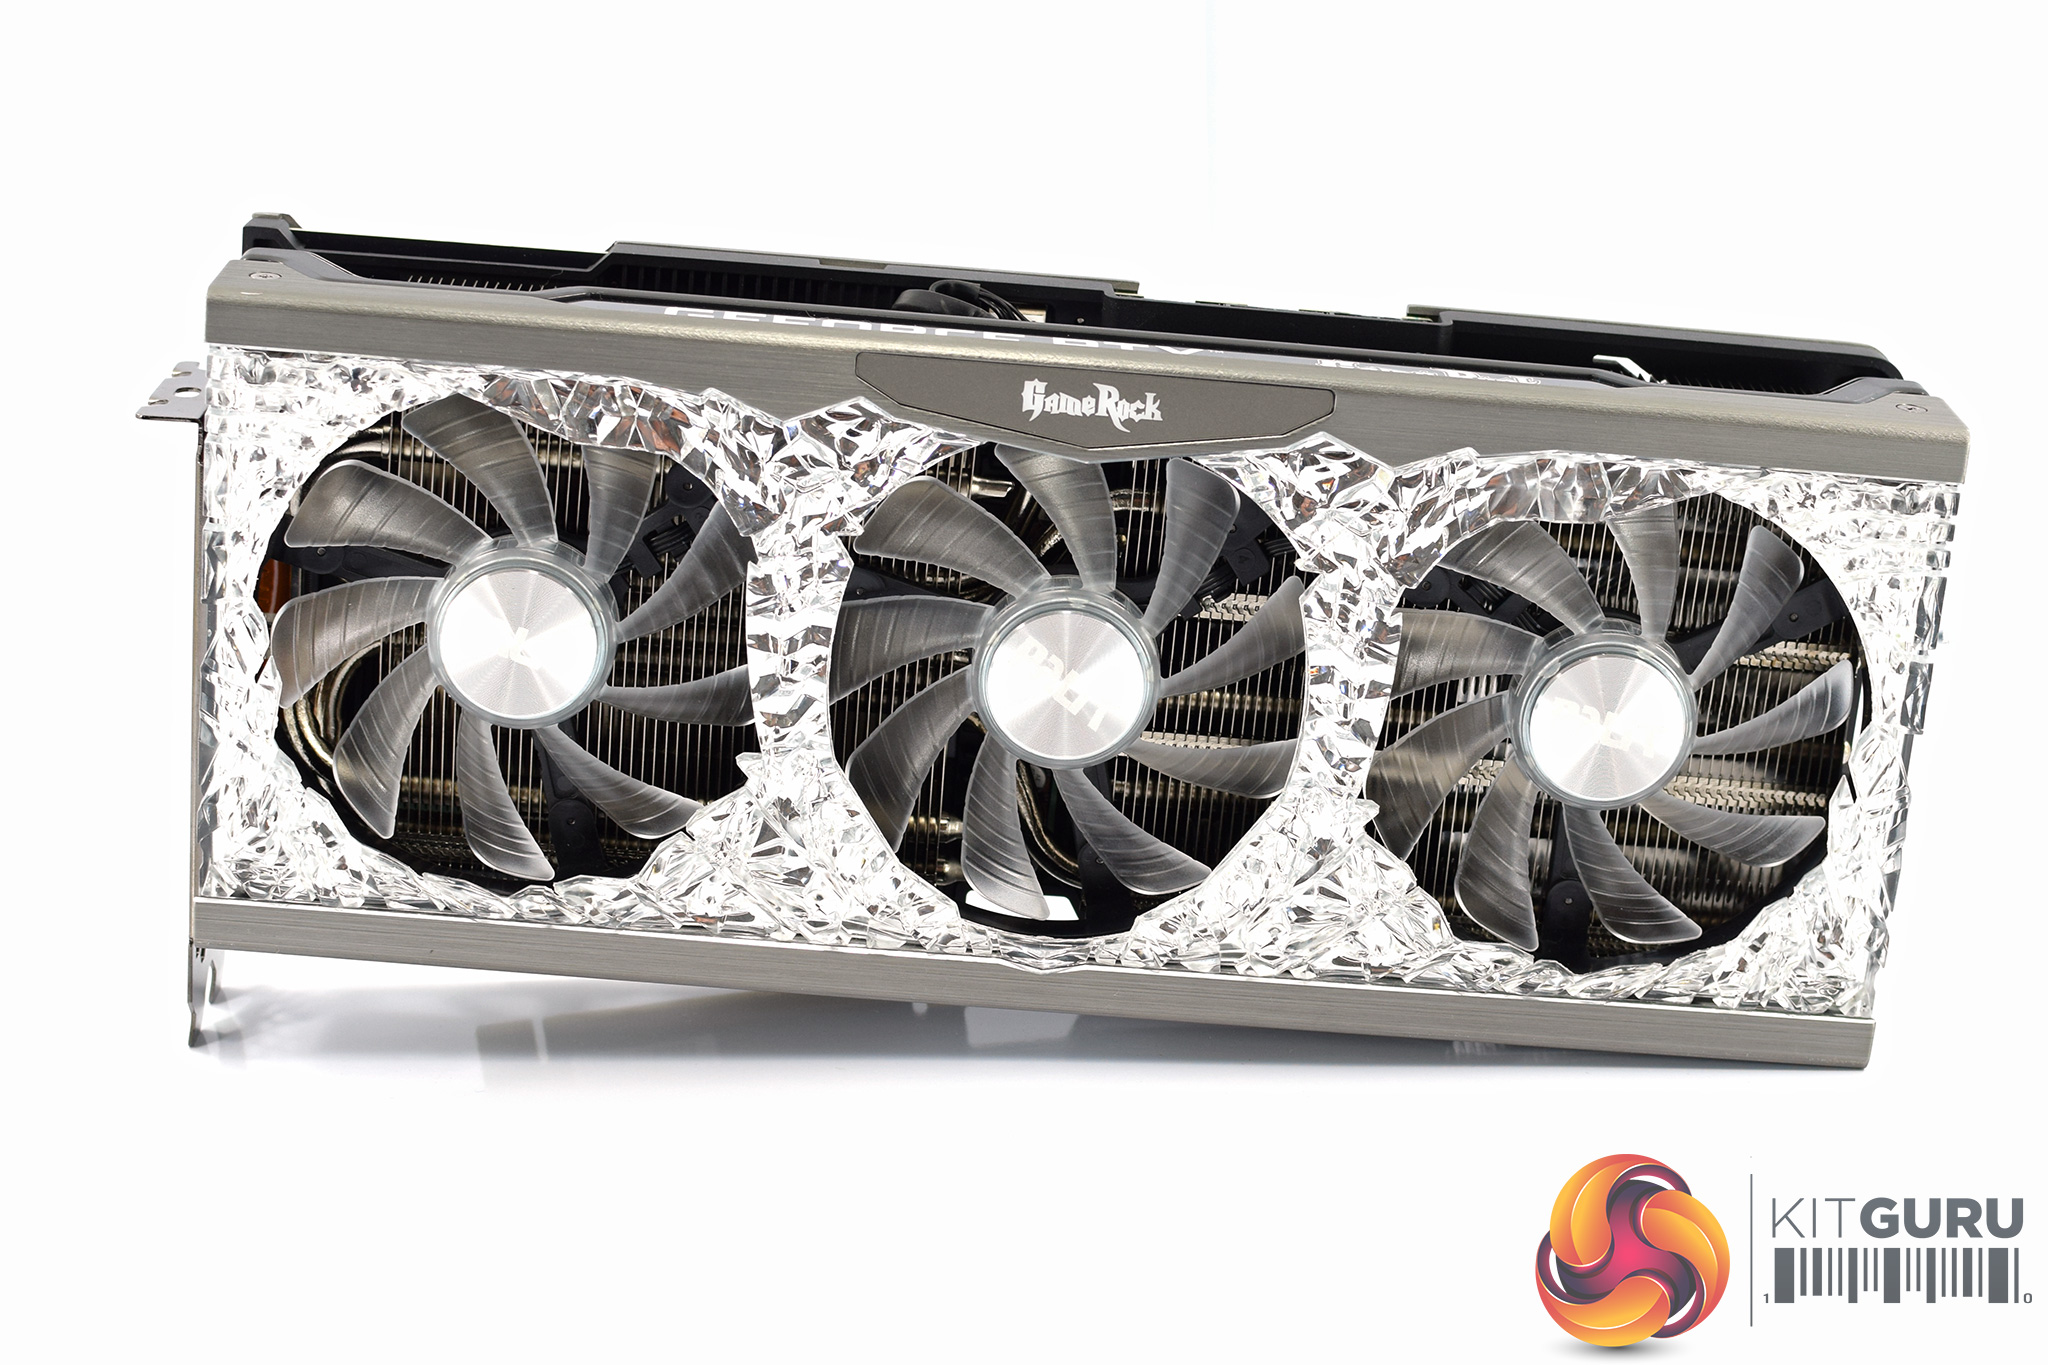
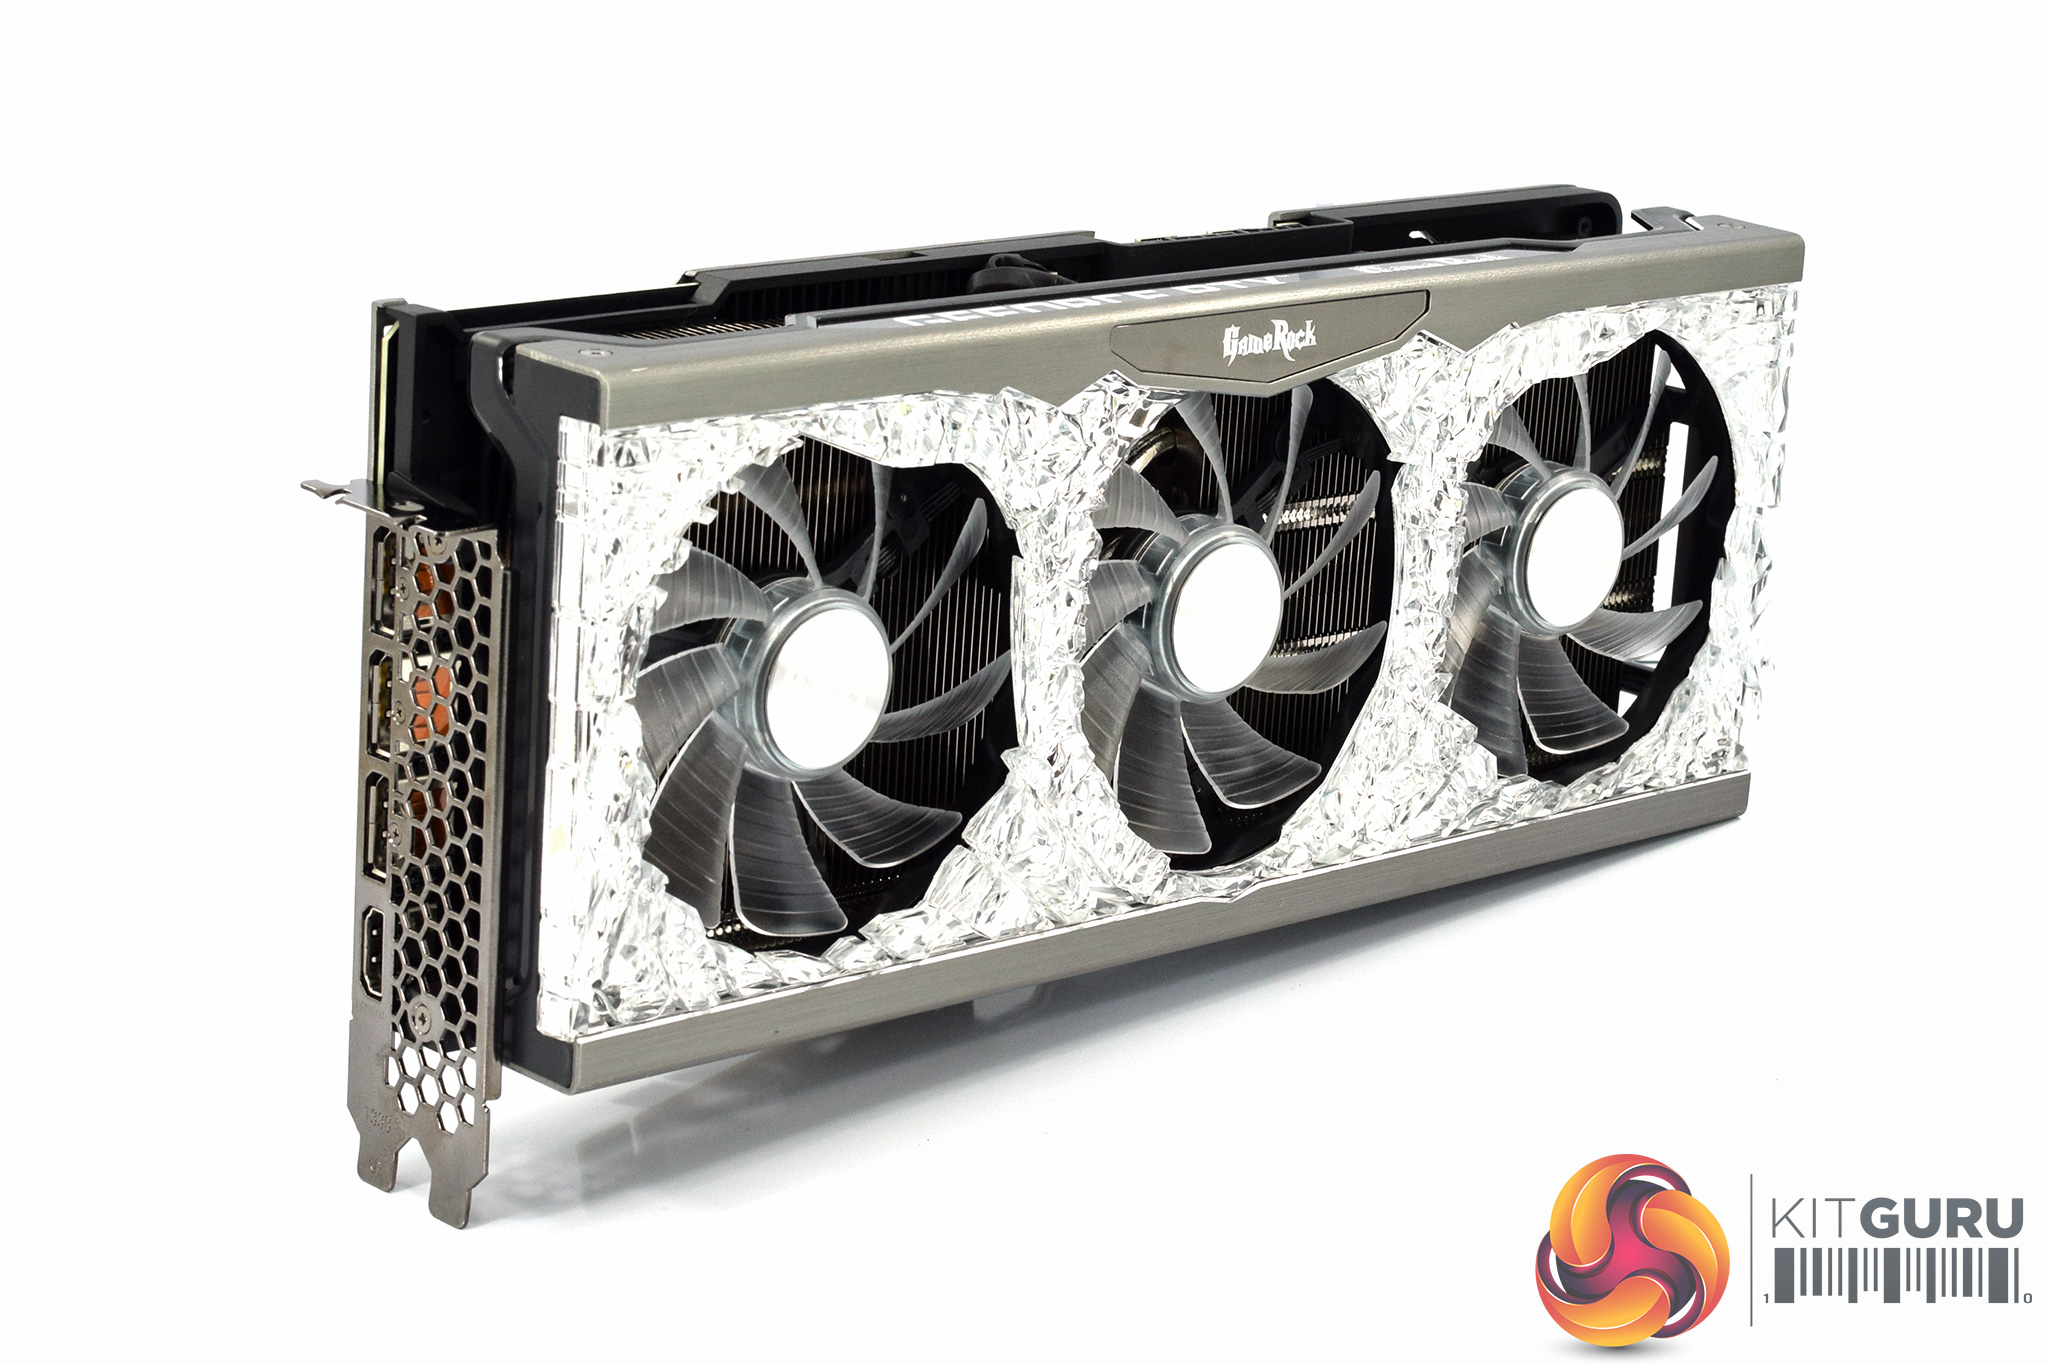
The card itself is identical to the RTX 3090 GameRock OC we reviewed earlier this year, which of course makes a lot of sense. It's another striking design, with lots of crystal-like plastic visible on the shroud. As shown in our video, this acts as a giant diffuser for the RGB lighting, which is certainly an impressive visual touch.
We can also note three 90mm fans, with translucent fan blades also designed to aid with the RGB lightshow.
In terms of sizing, this is another big graphics card. It measures in at 304 x 136 x 60mmm so you will again need three free expansion slots in your chassis.
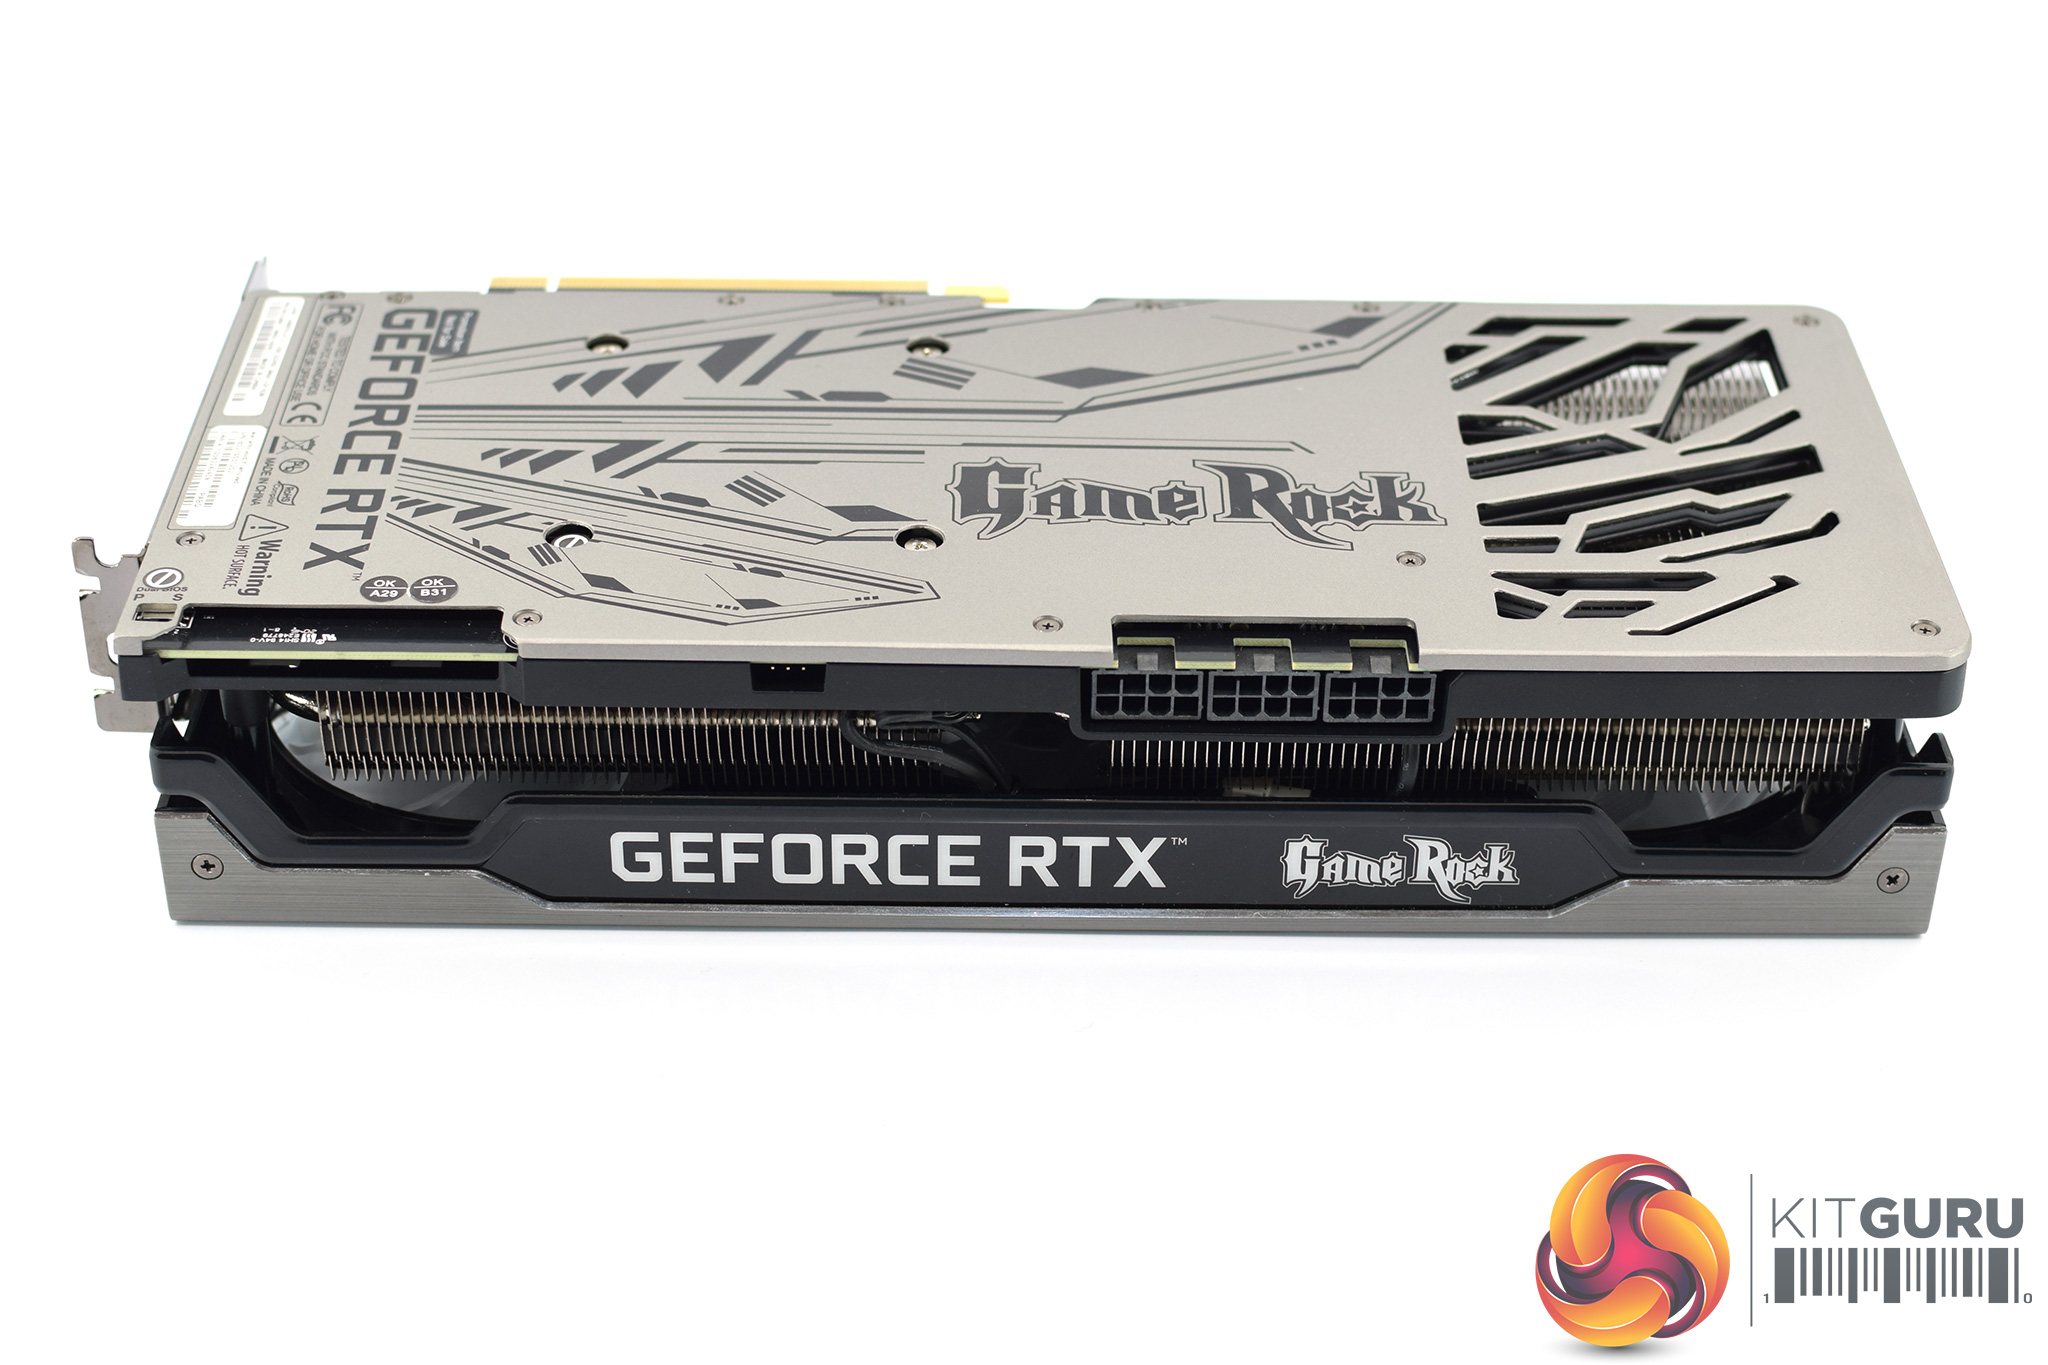
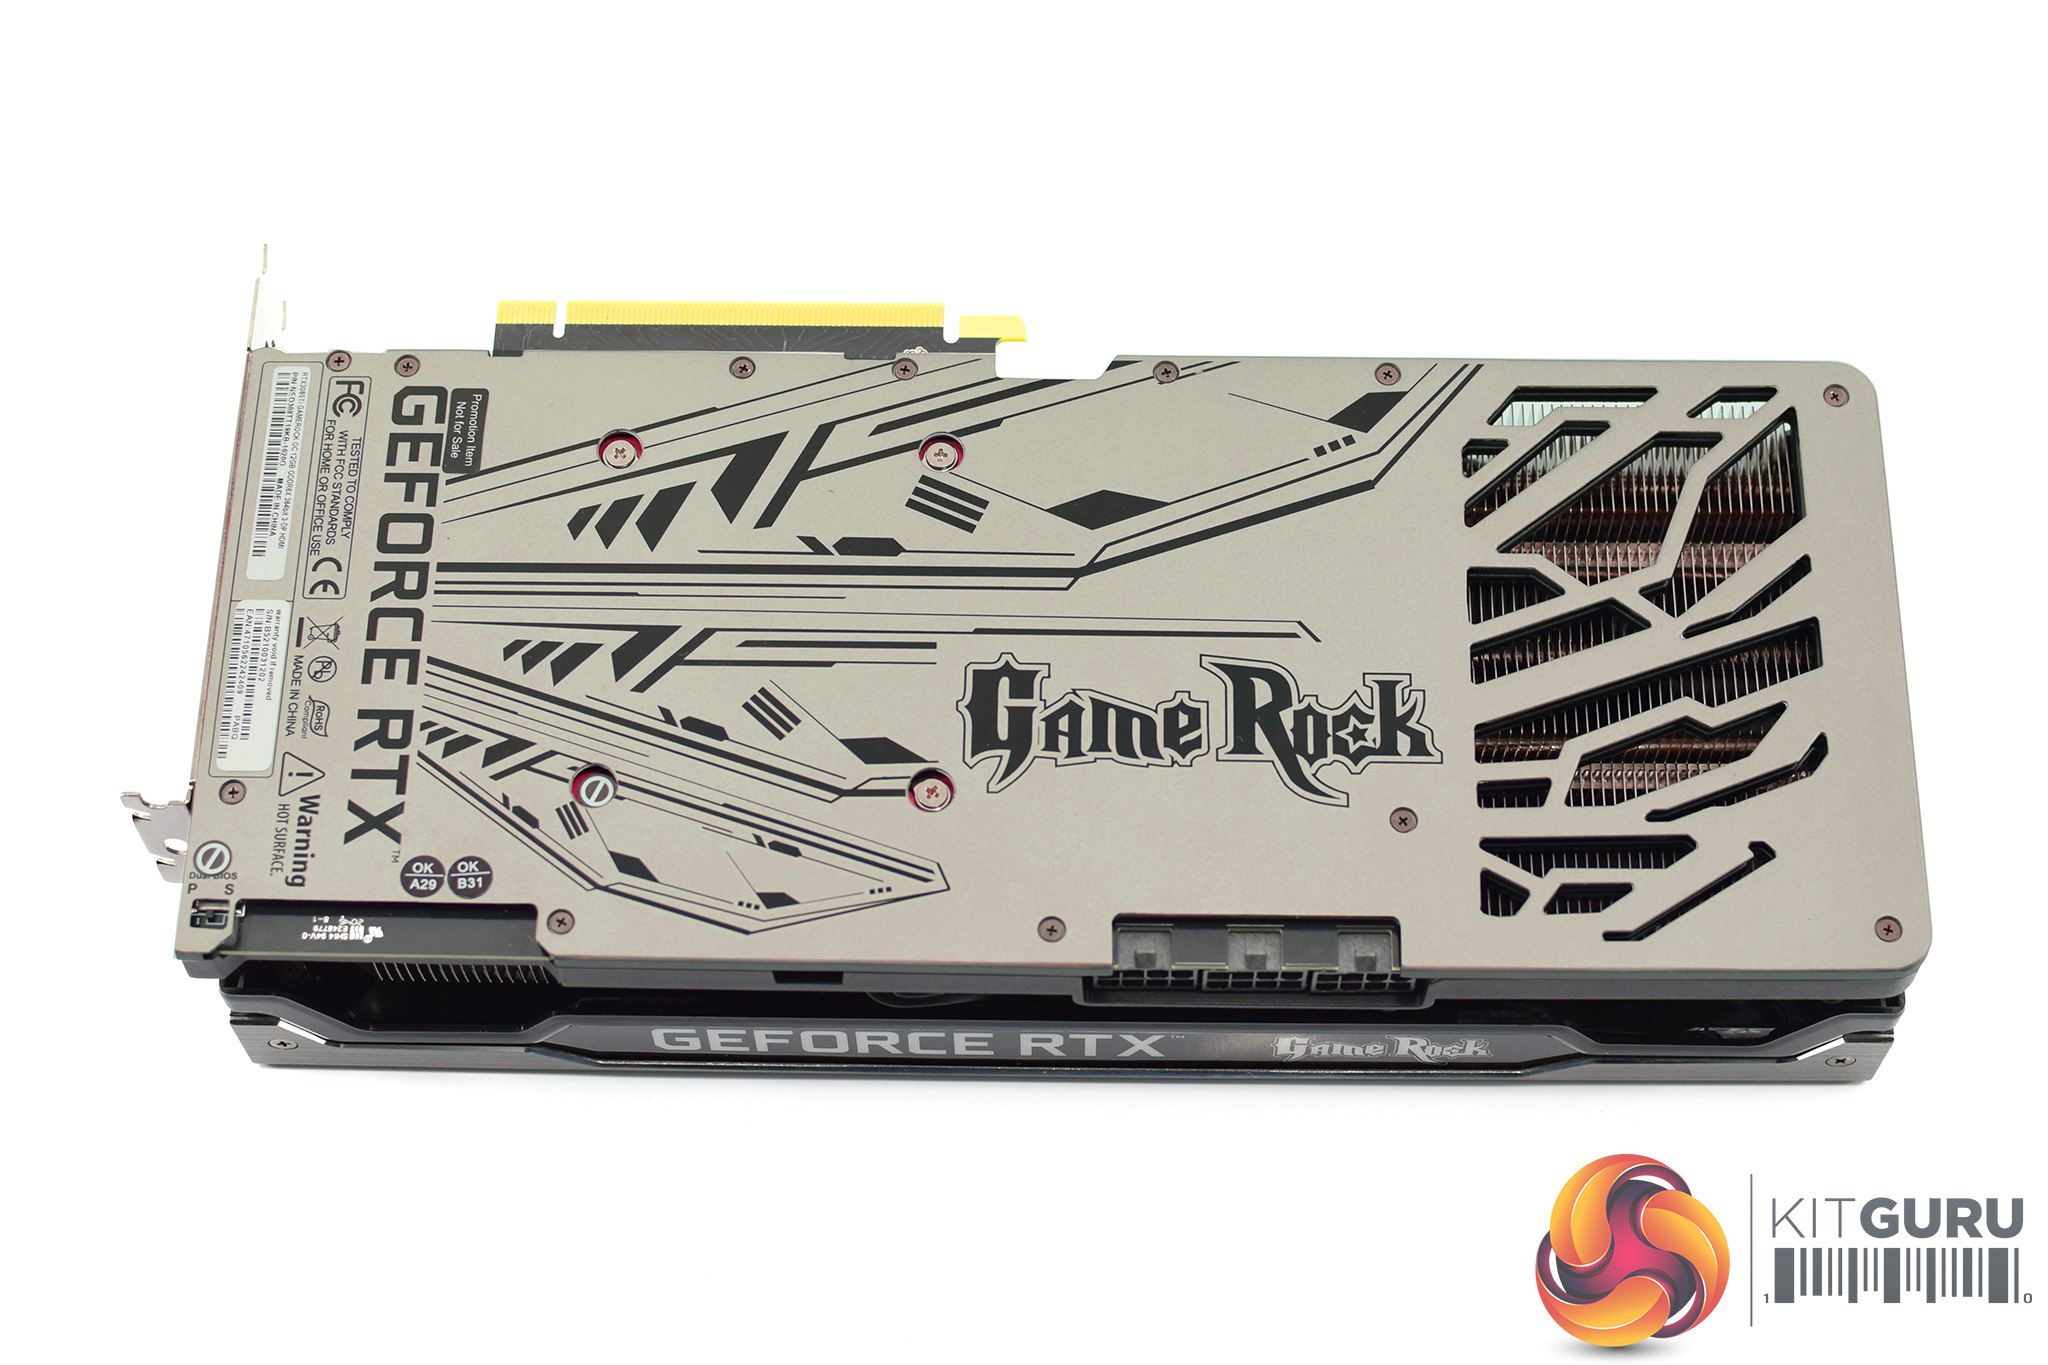
As for the backplate, this is quite a striking design, with the GameRock logo positioned in the middle. It’s a hefty slab of metal, with a few cut-outs toward the end to allow airflow through the heatsink.
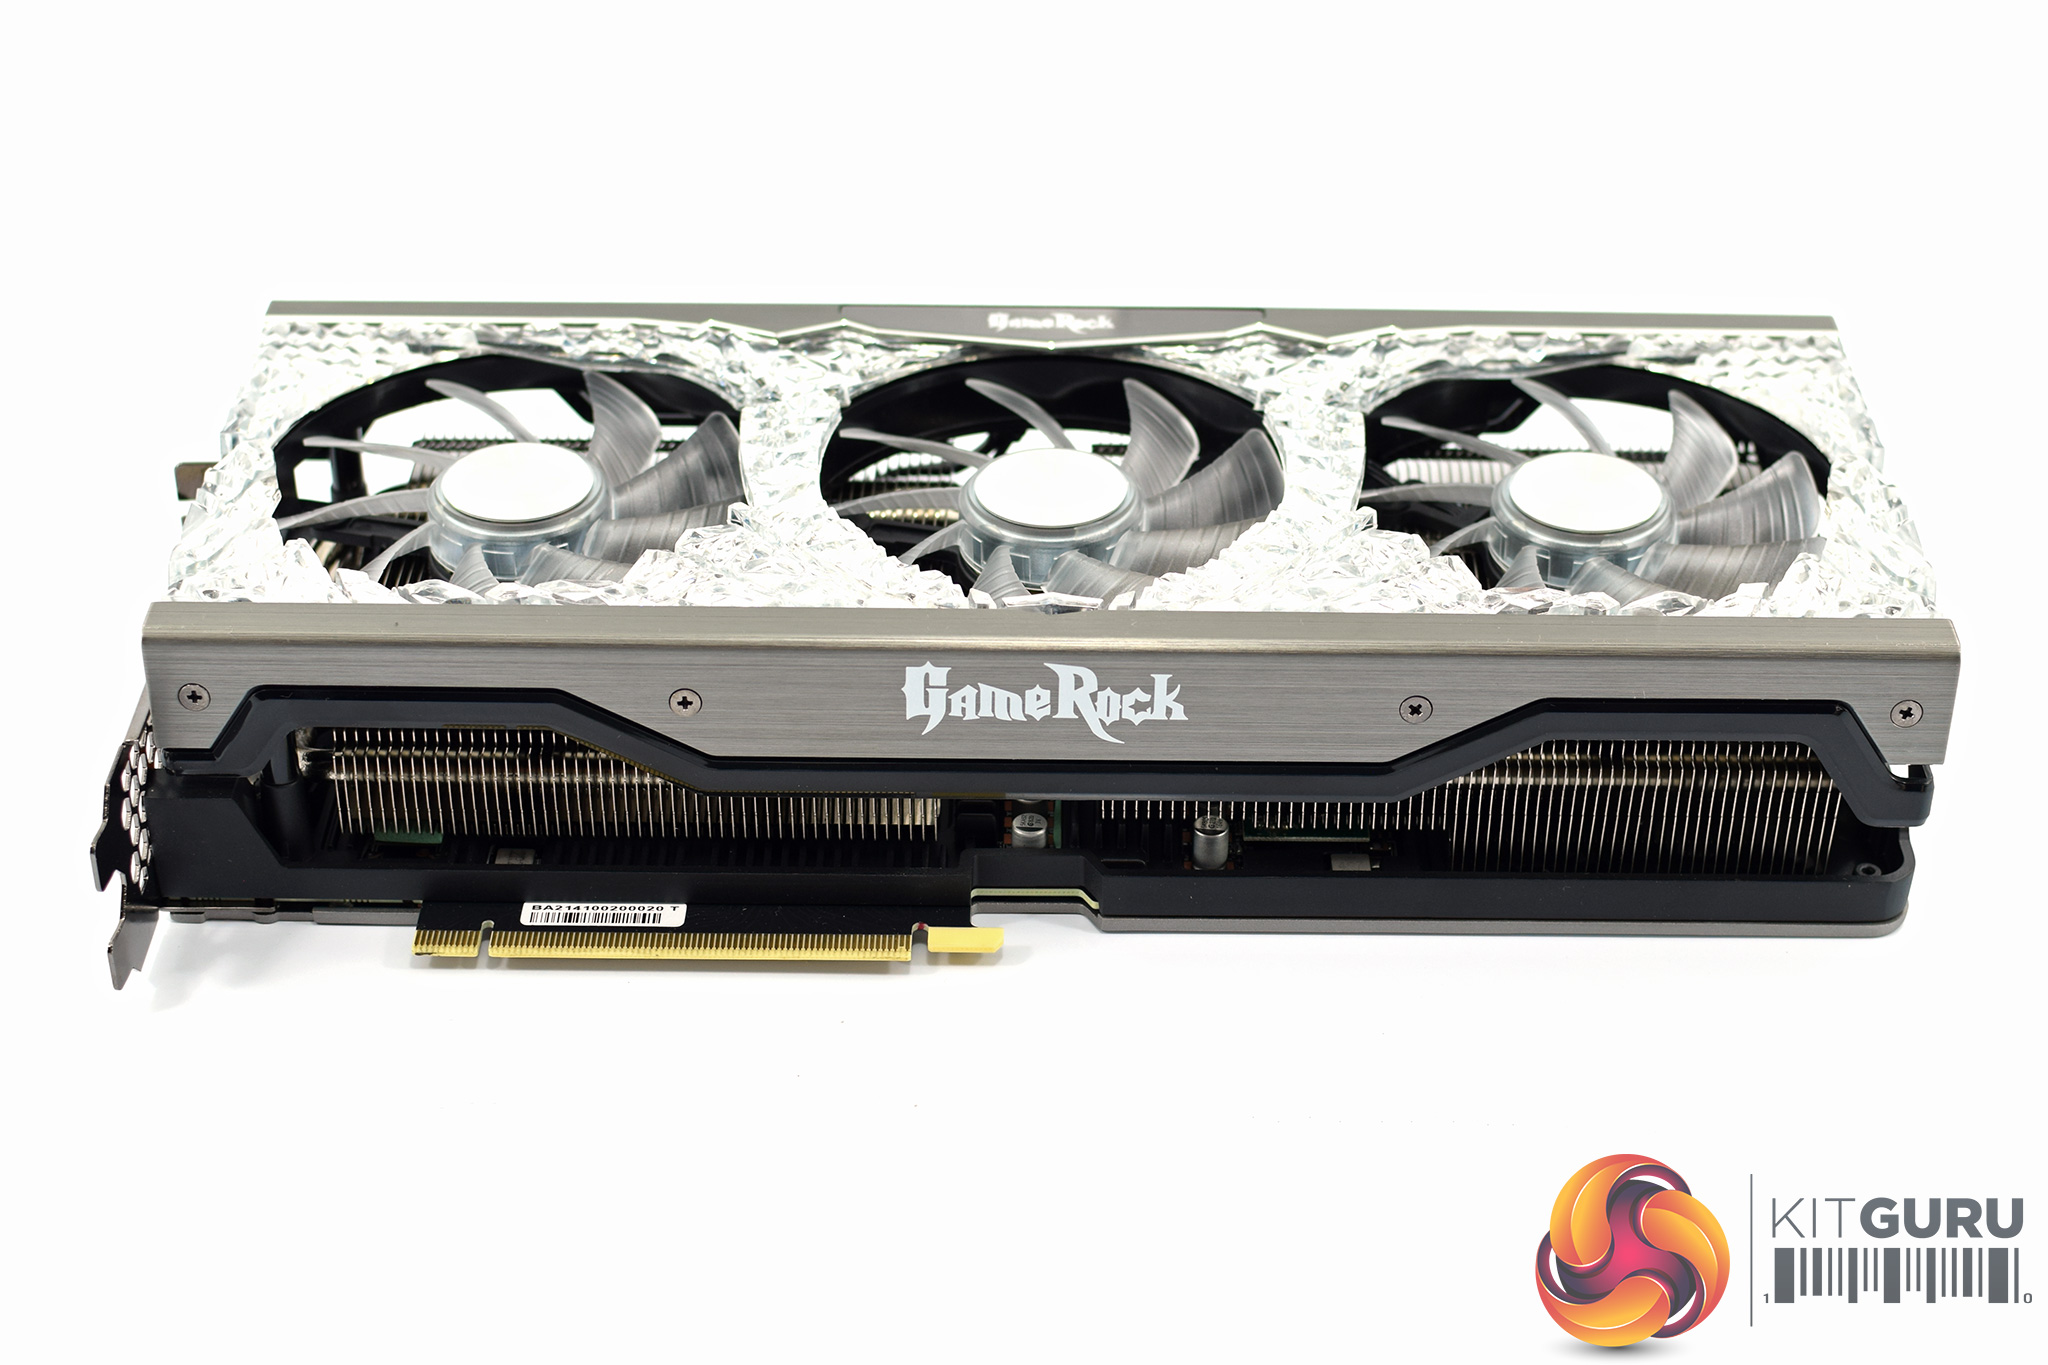
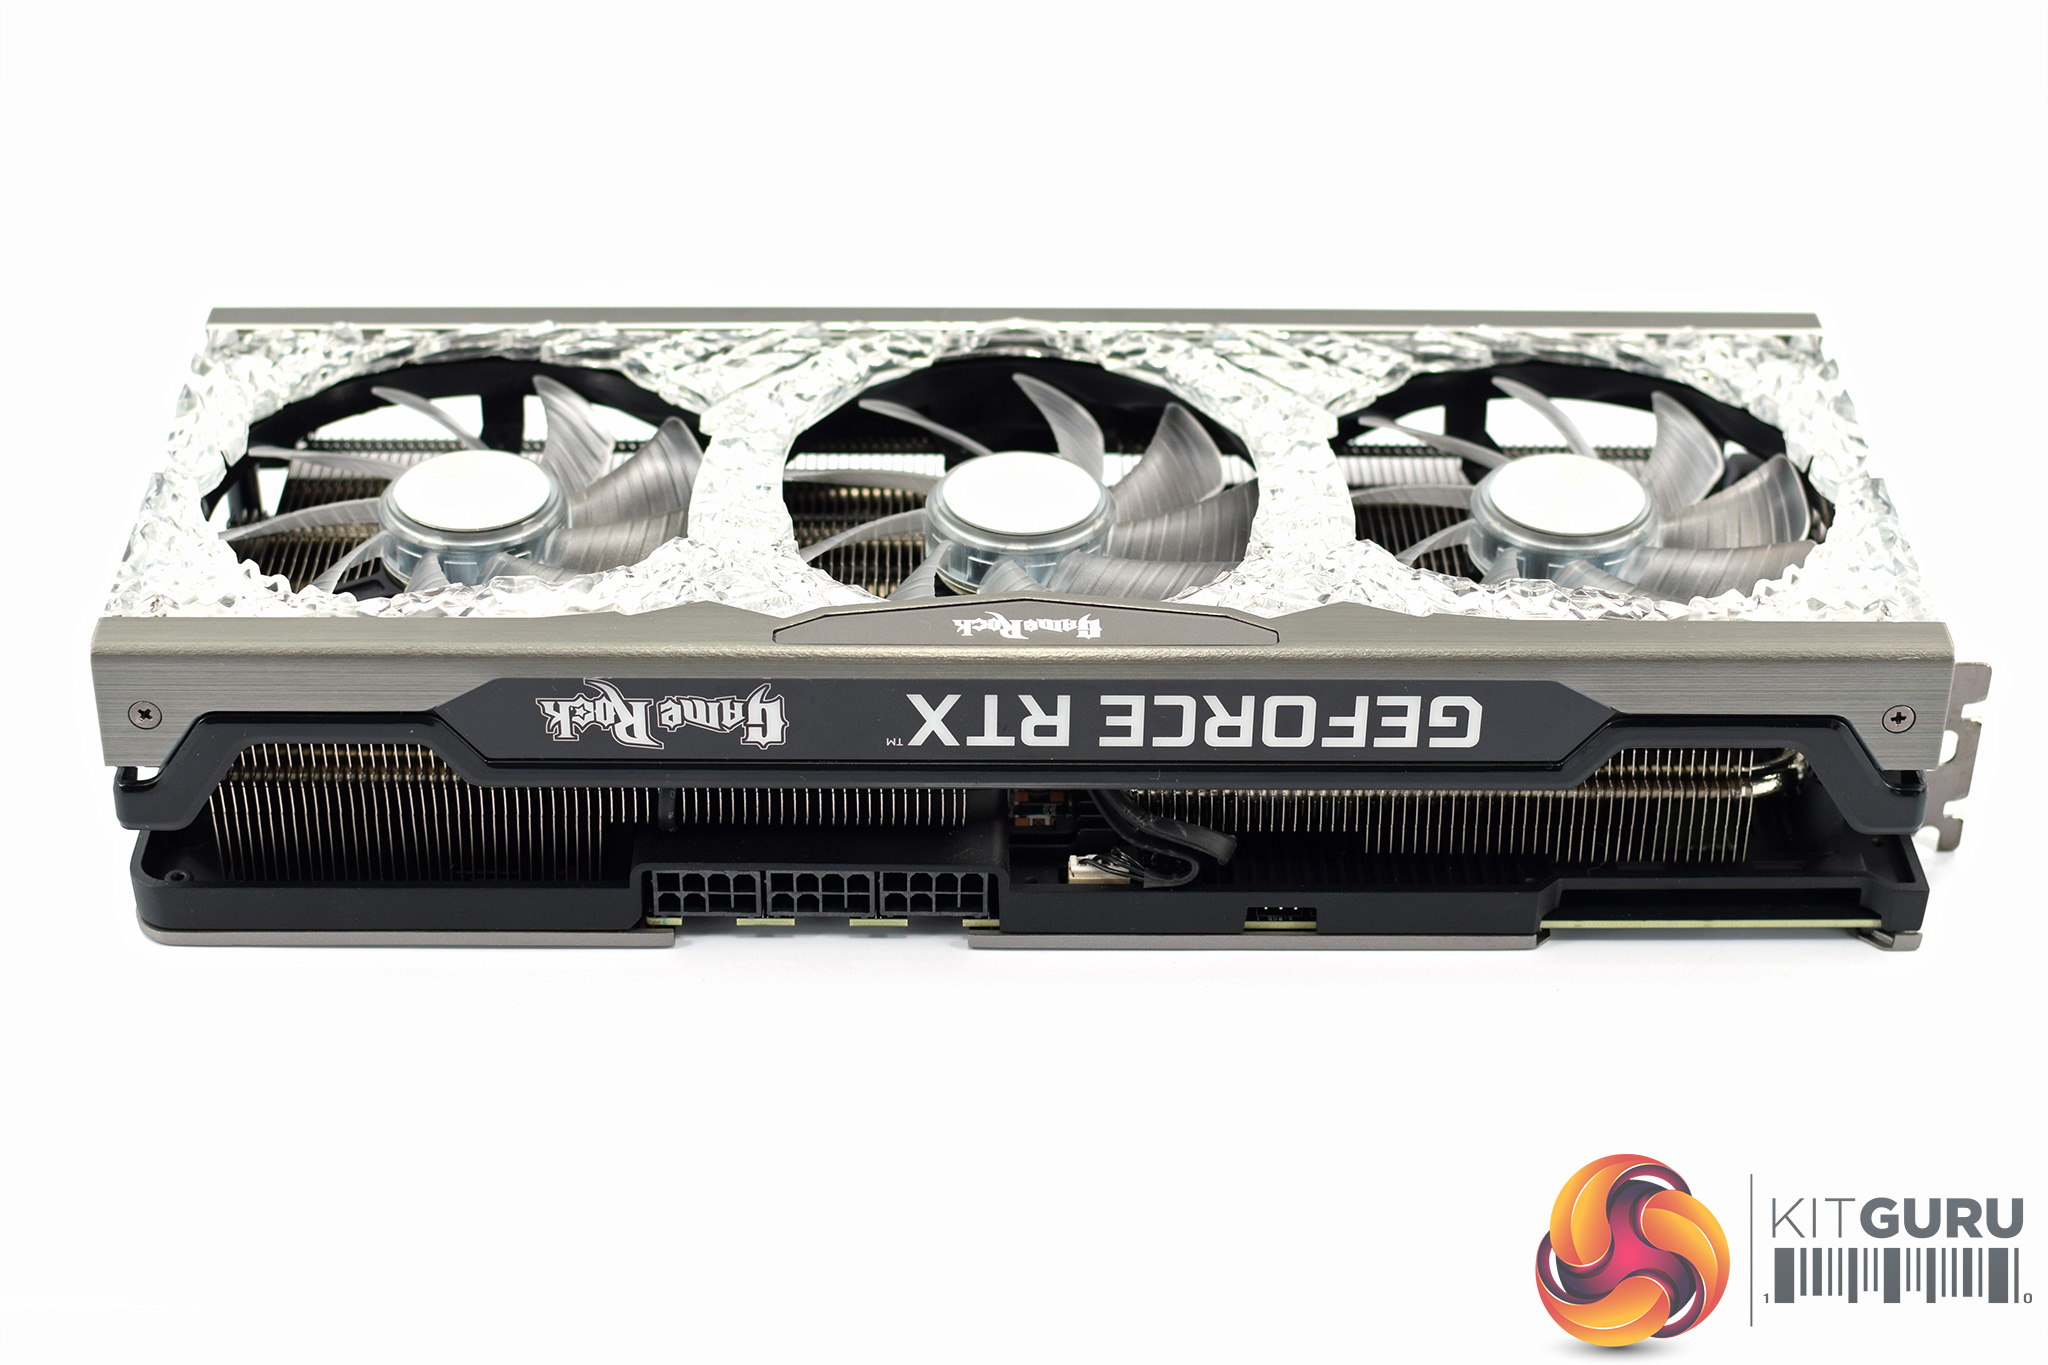
We can also note a dual-BIOS switch positioned on the front edge of the card, with a choice between the Performance BIOS (400W power limit) and the Silent BIOS (370W power limit).
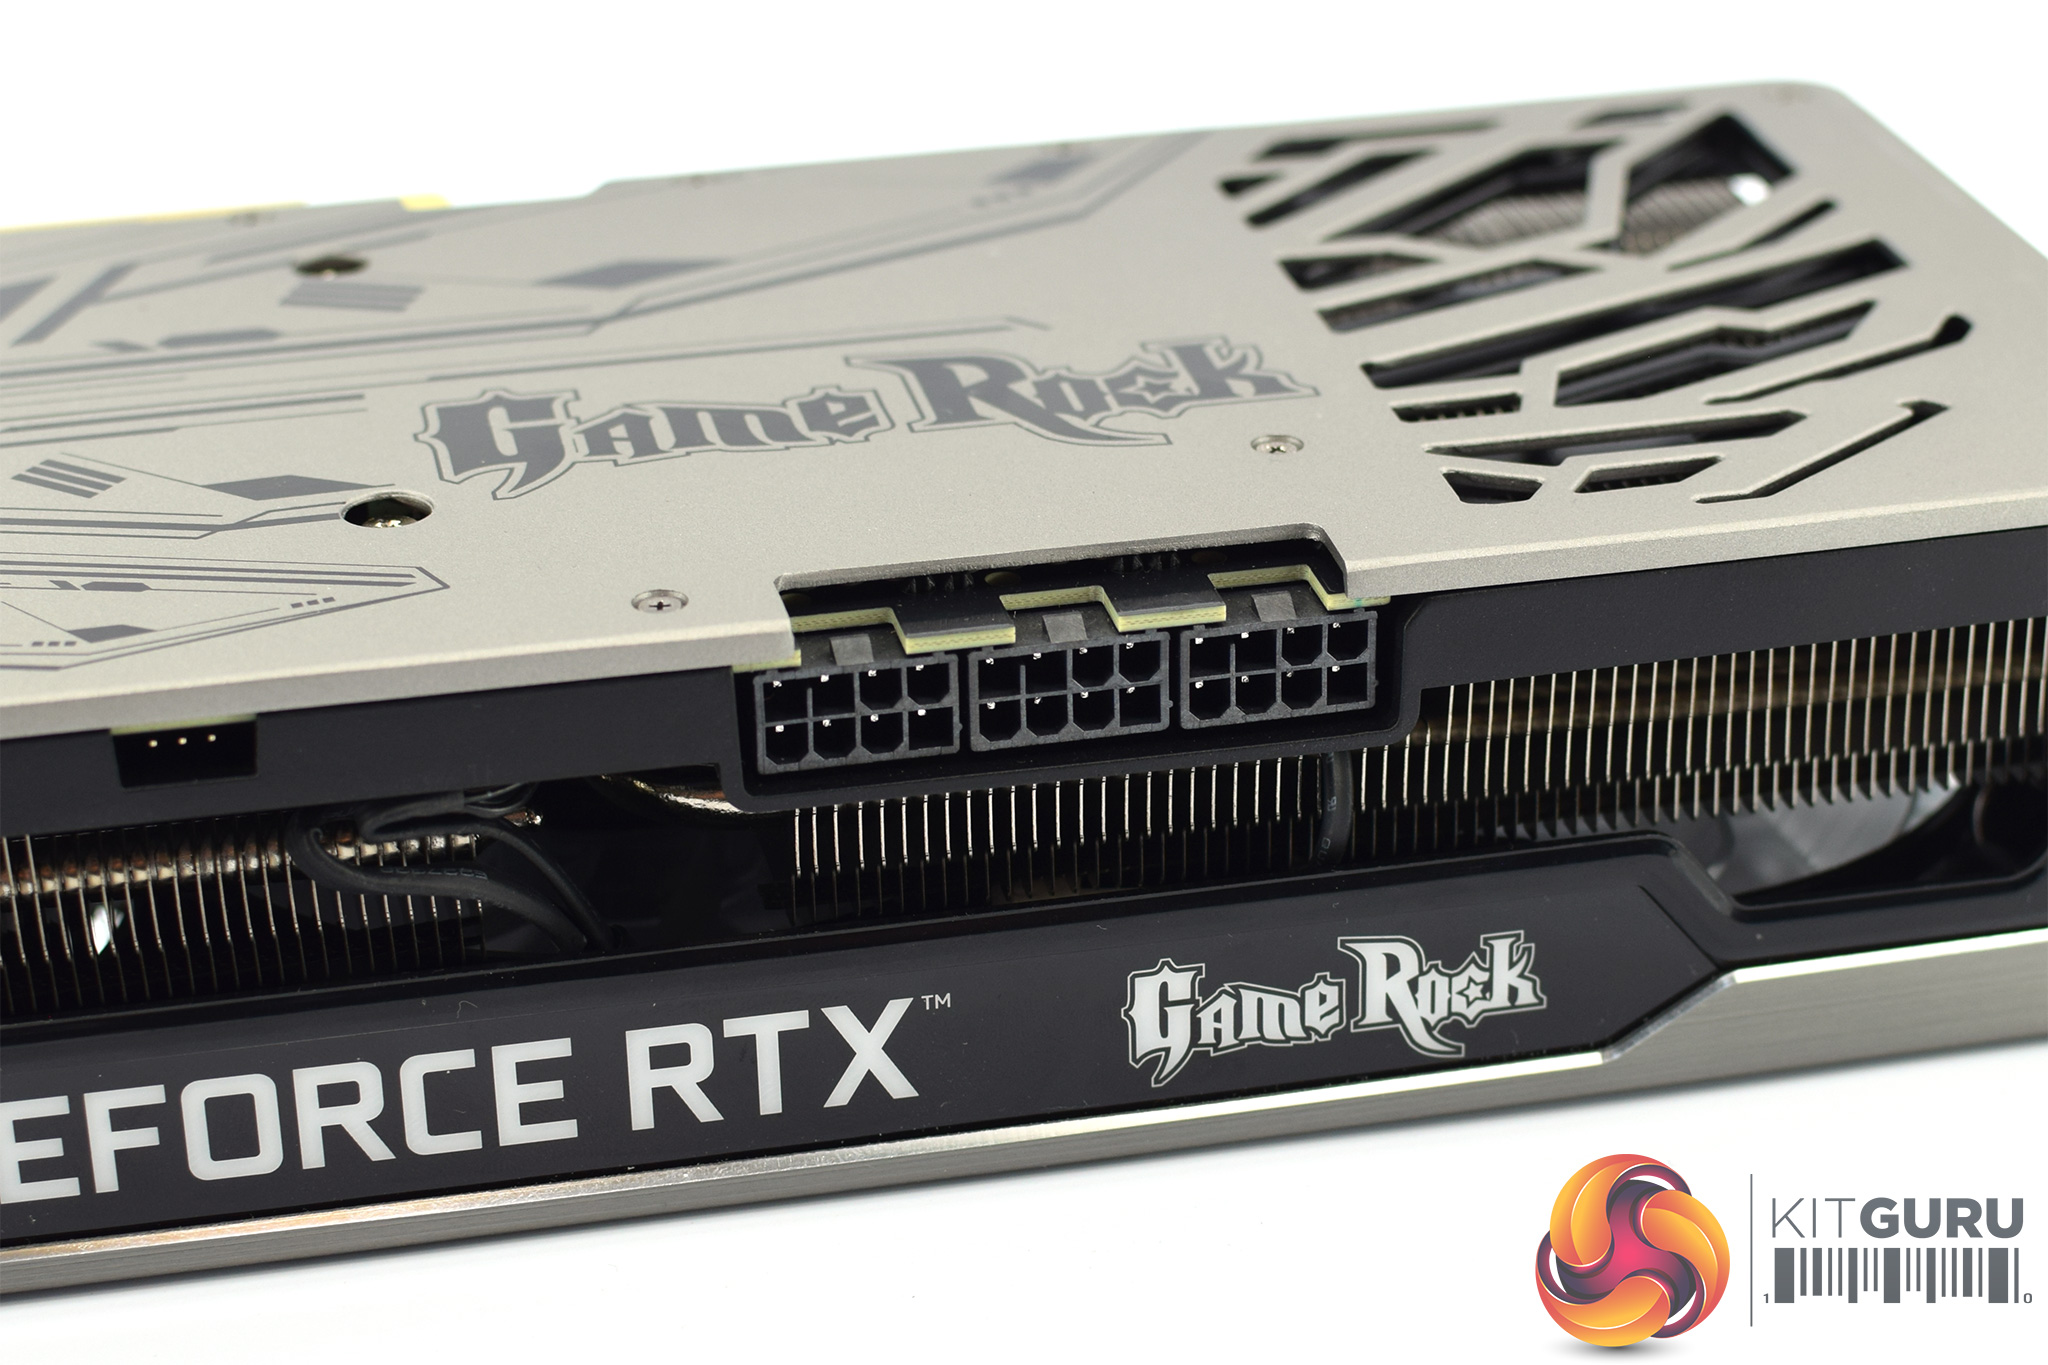
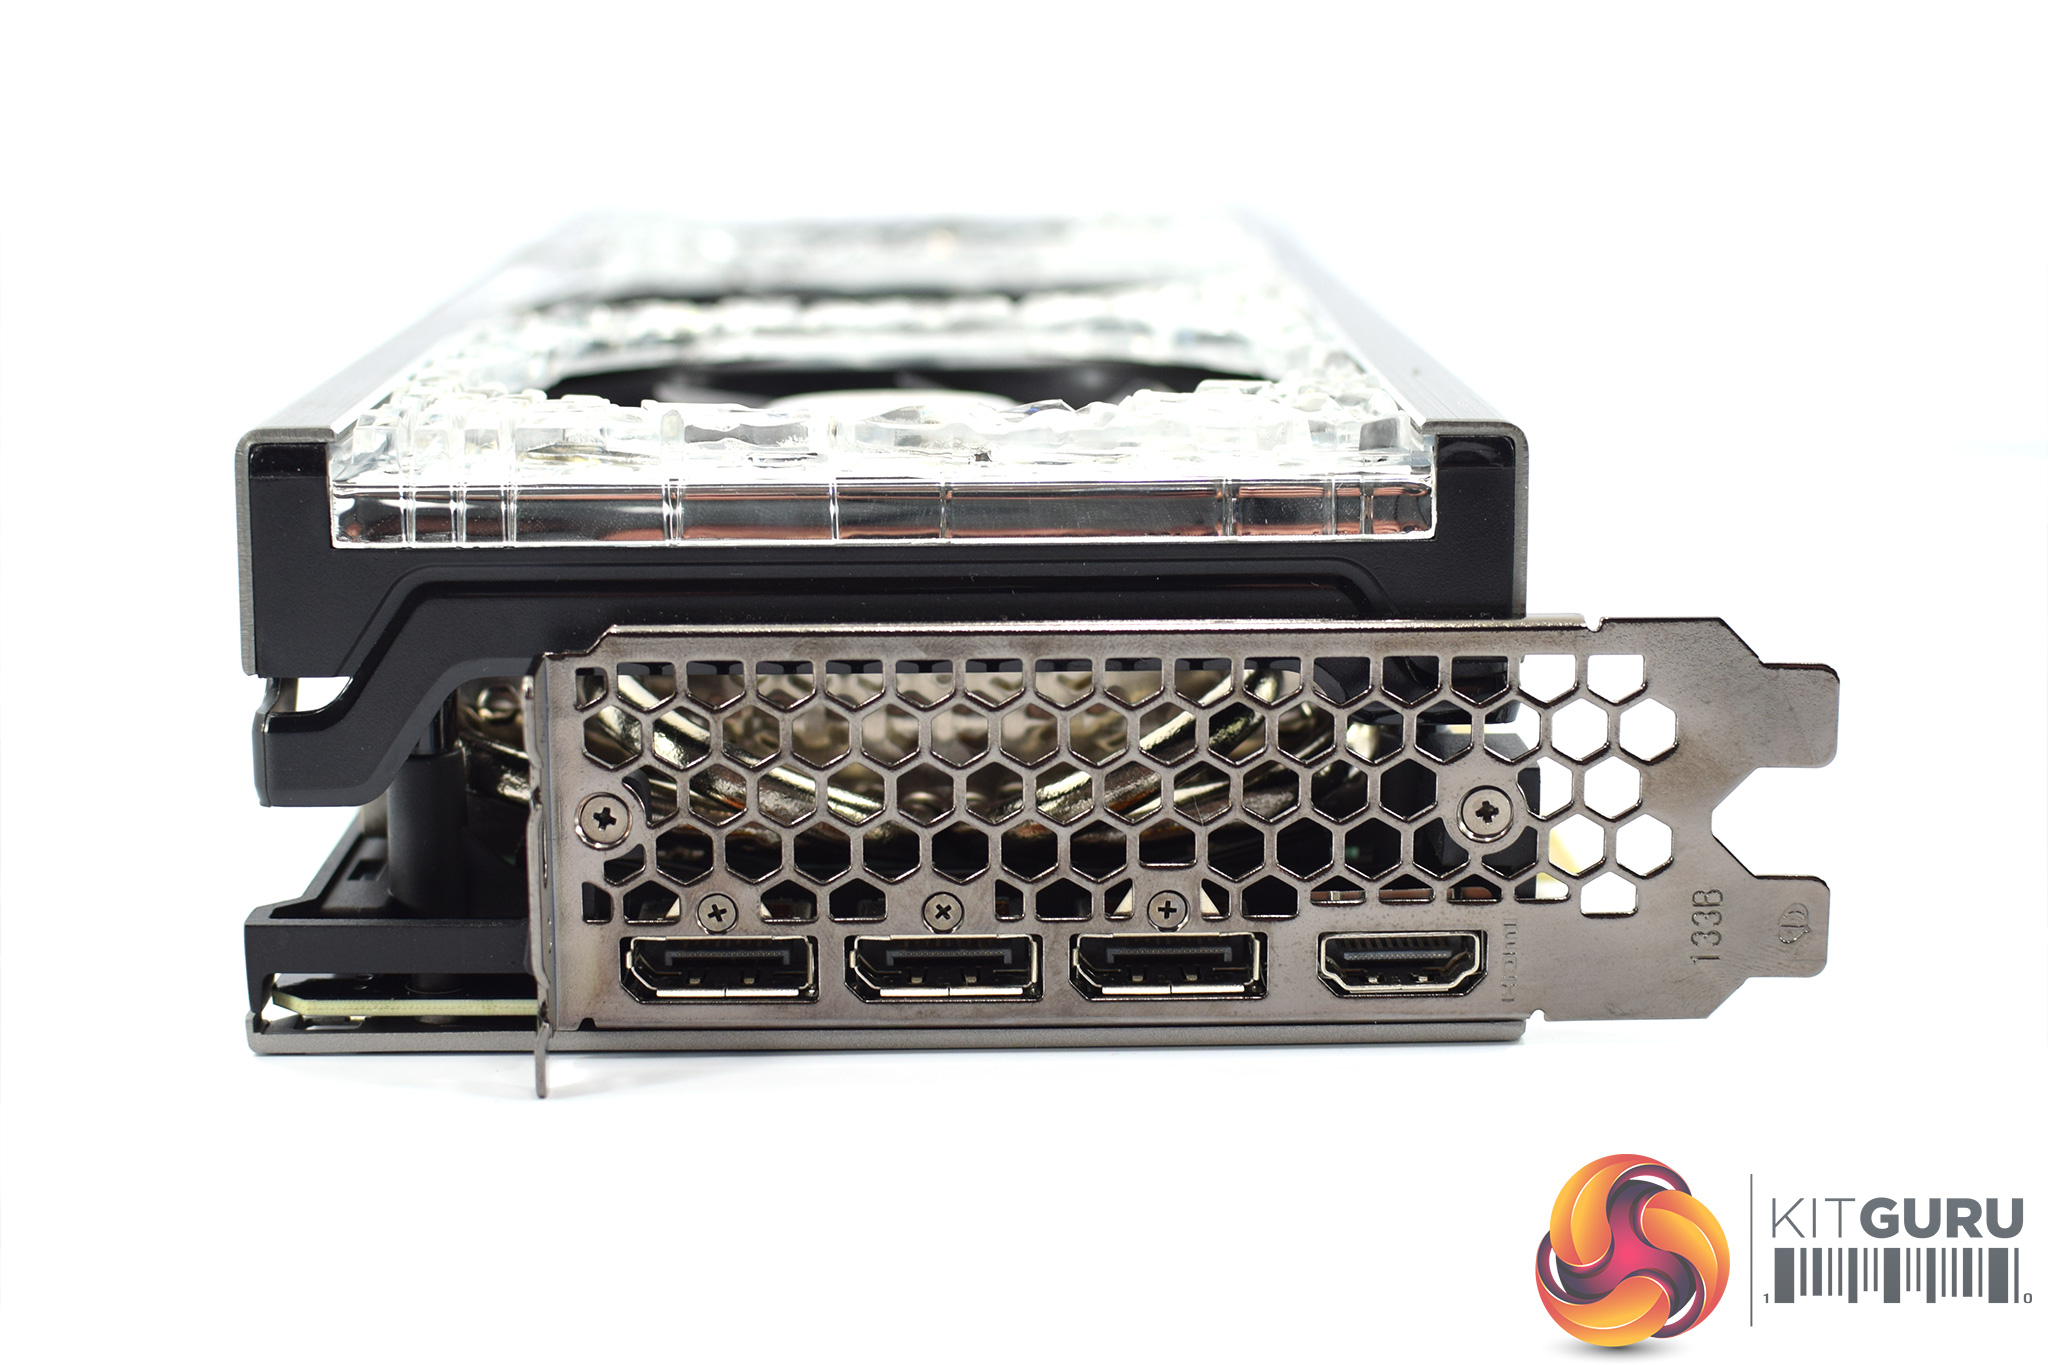
Three 8-pin power inputs are required, while three DisplayPort 1.4 and 1x HDMI 2.1 ports are on offer.
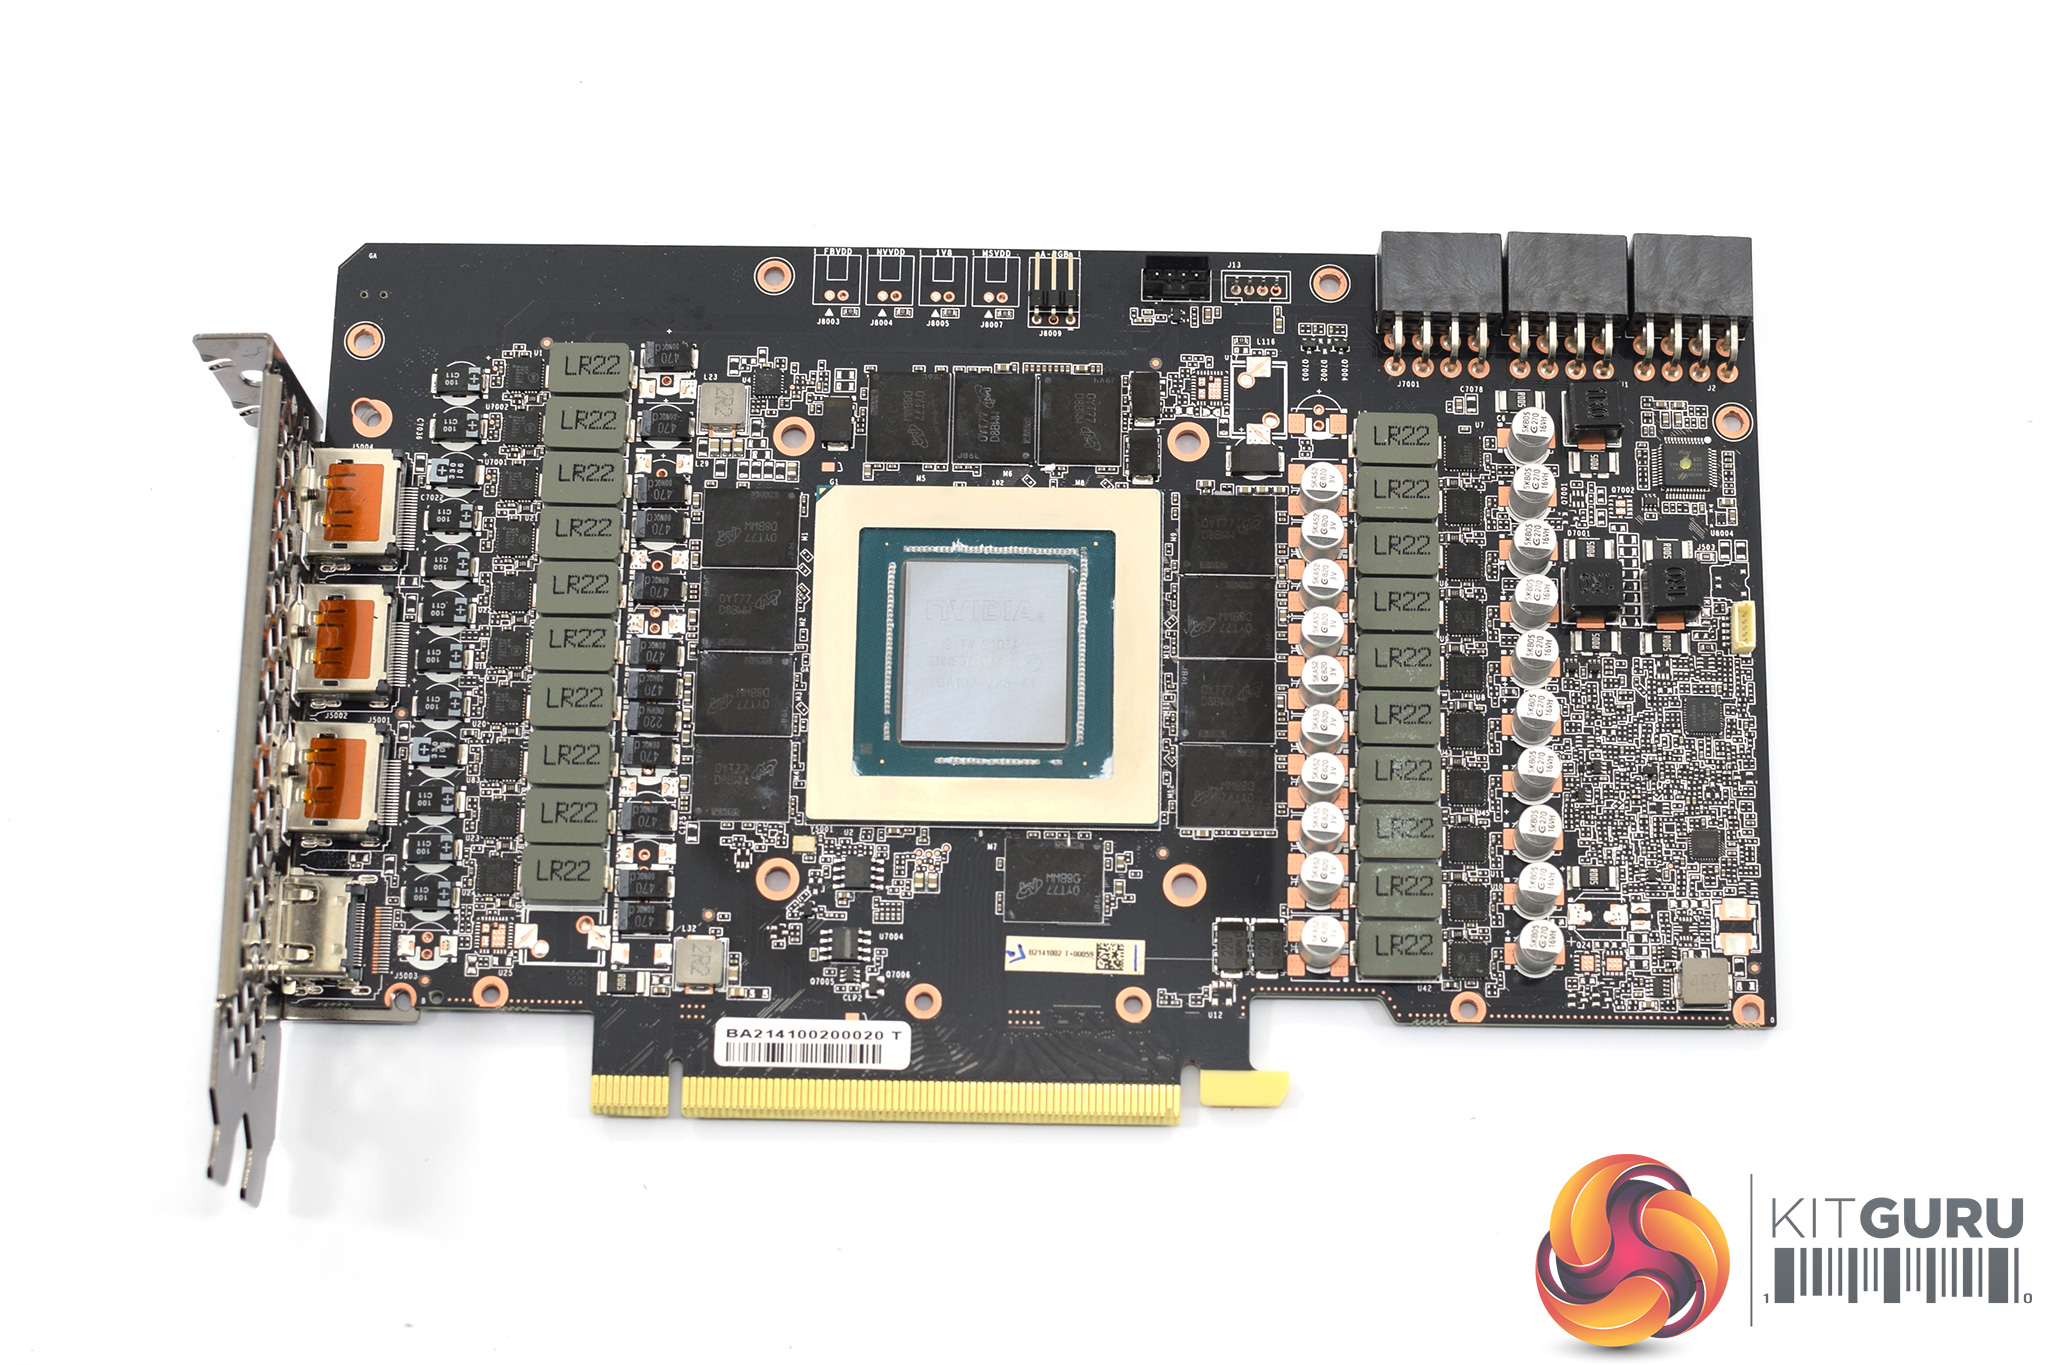
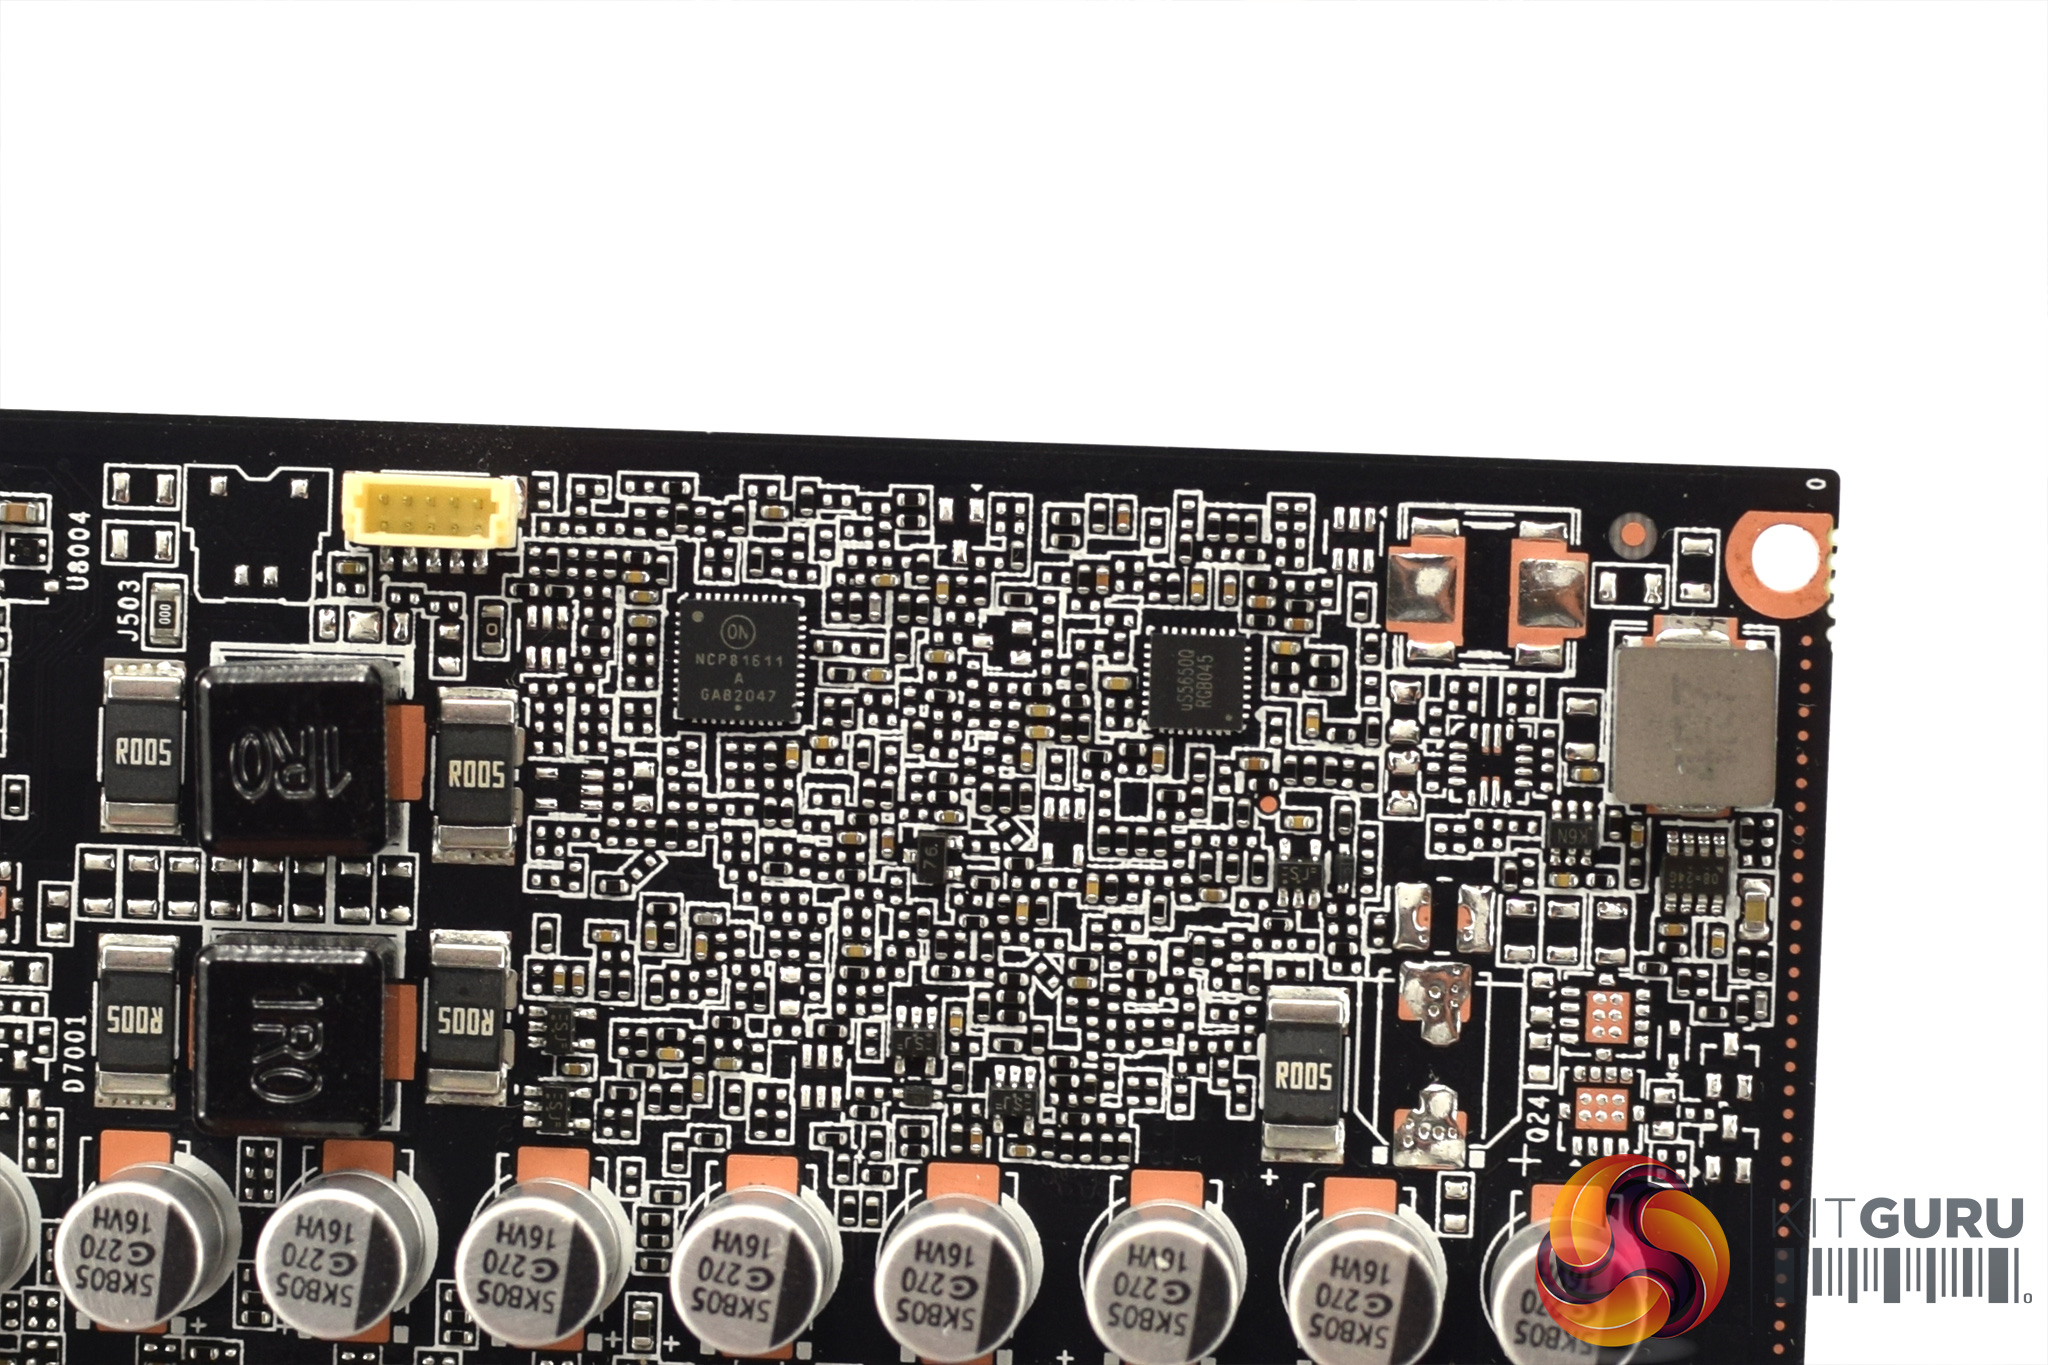
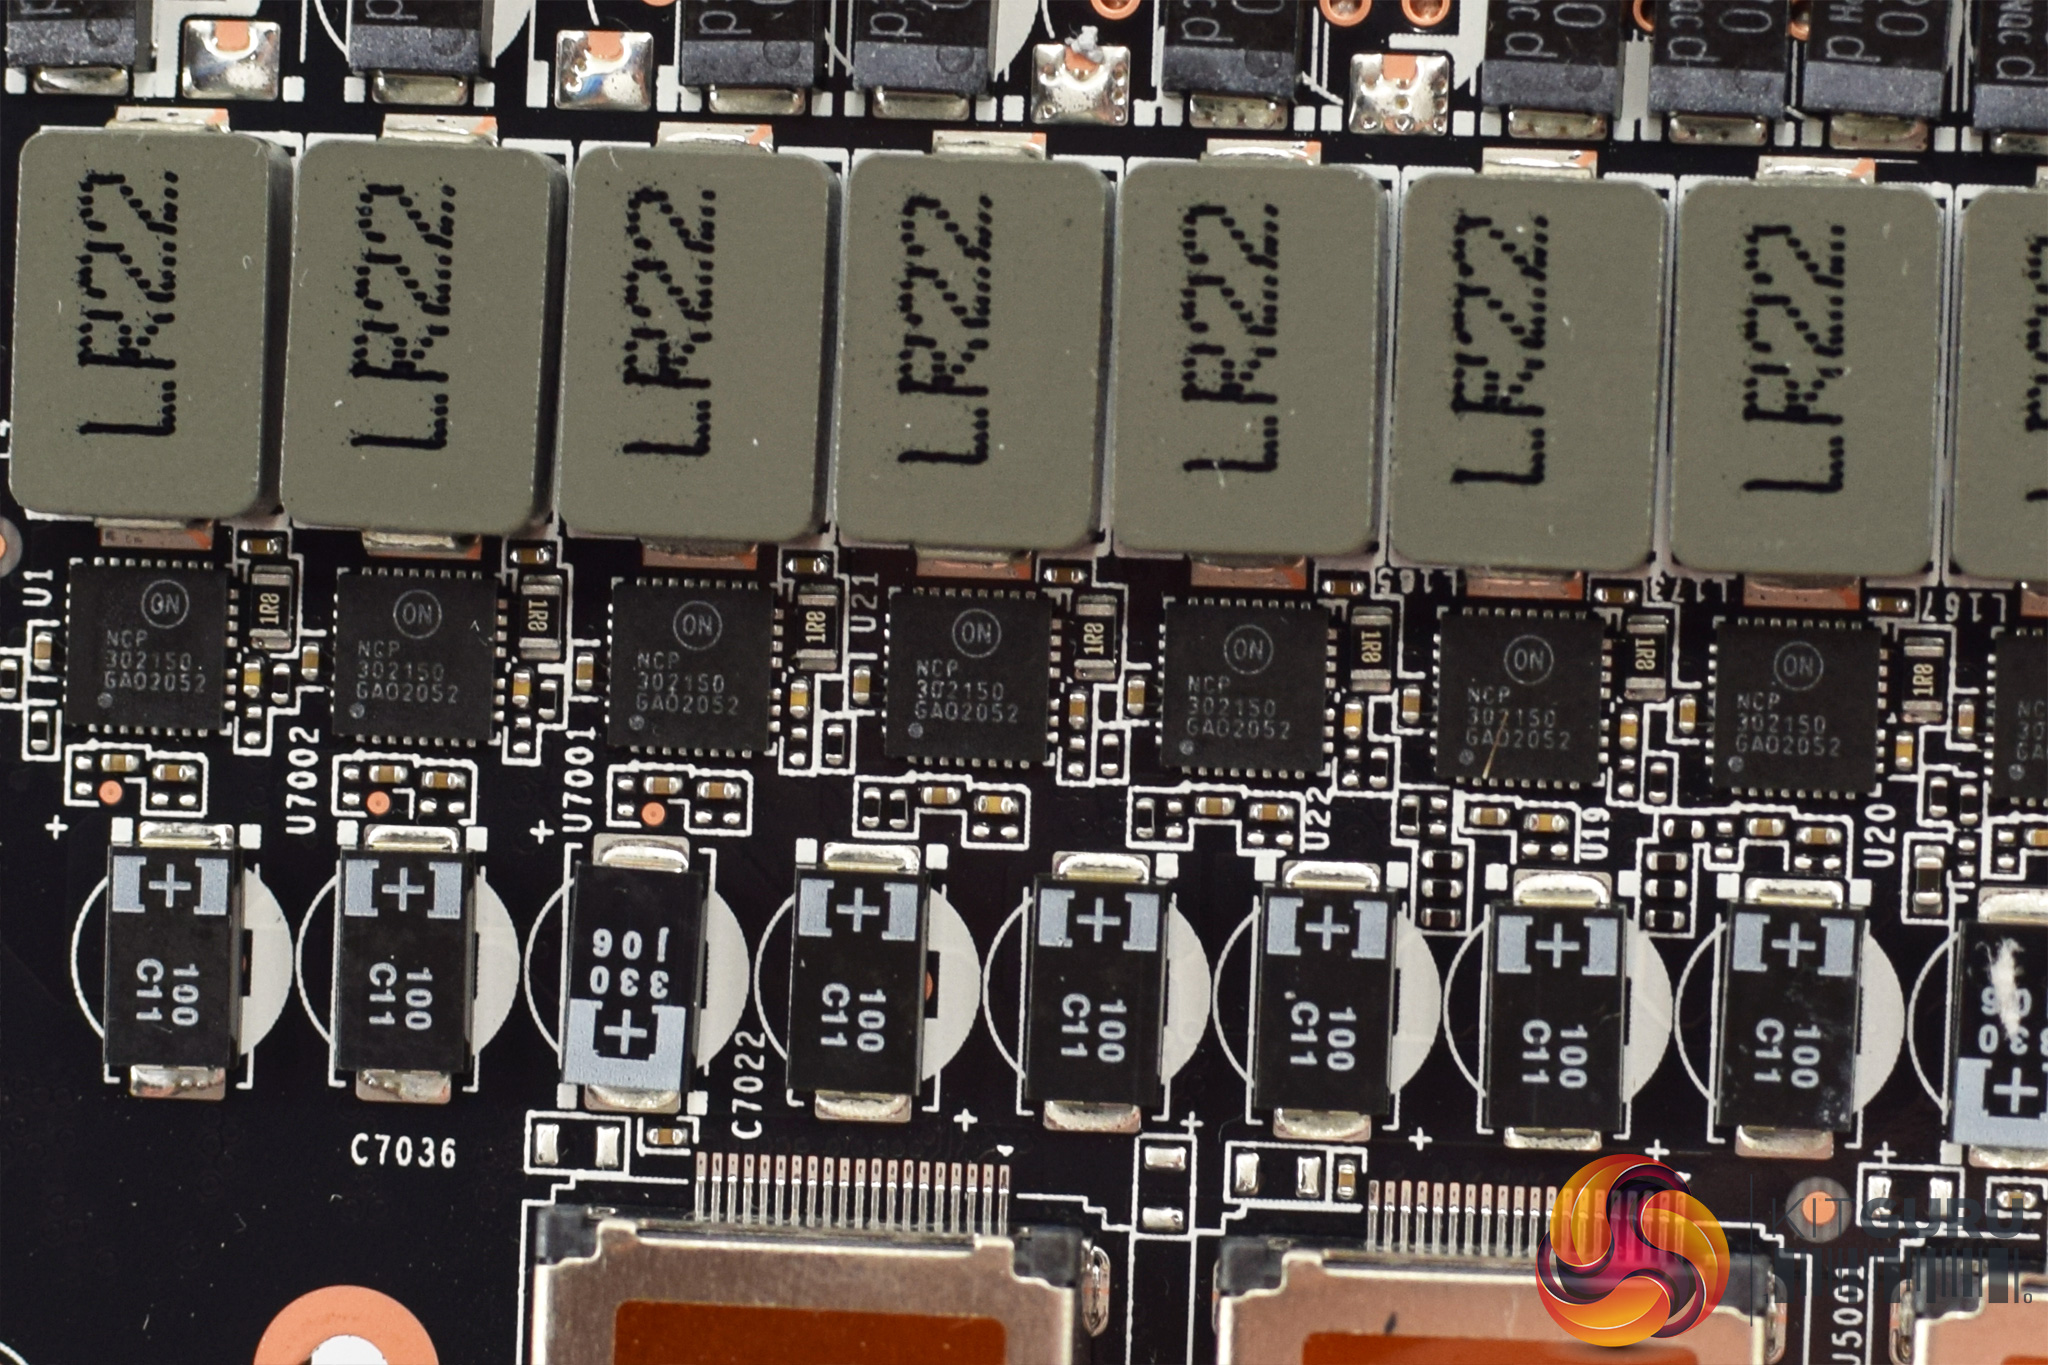

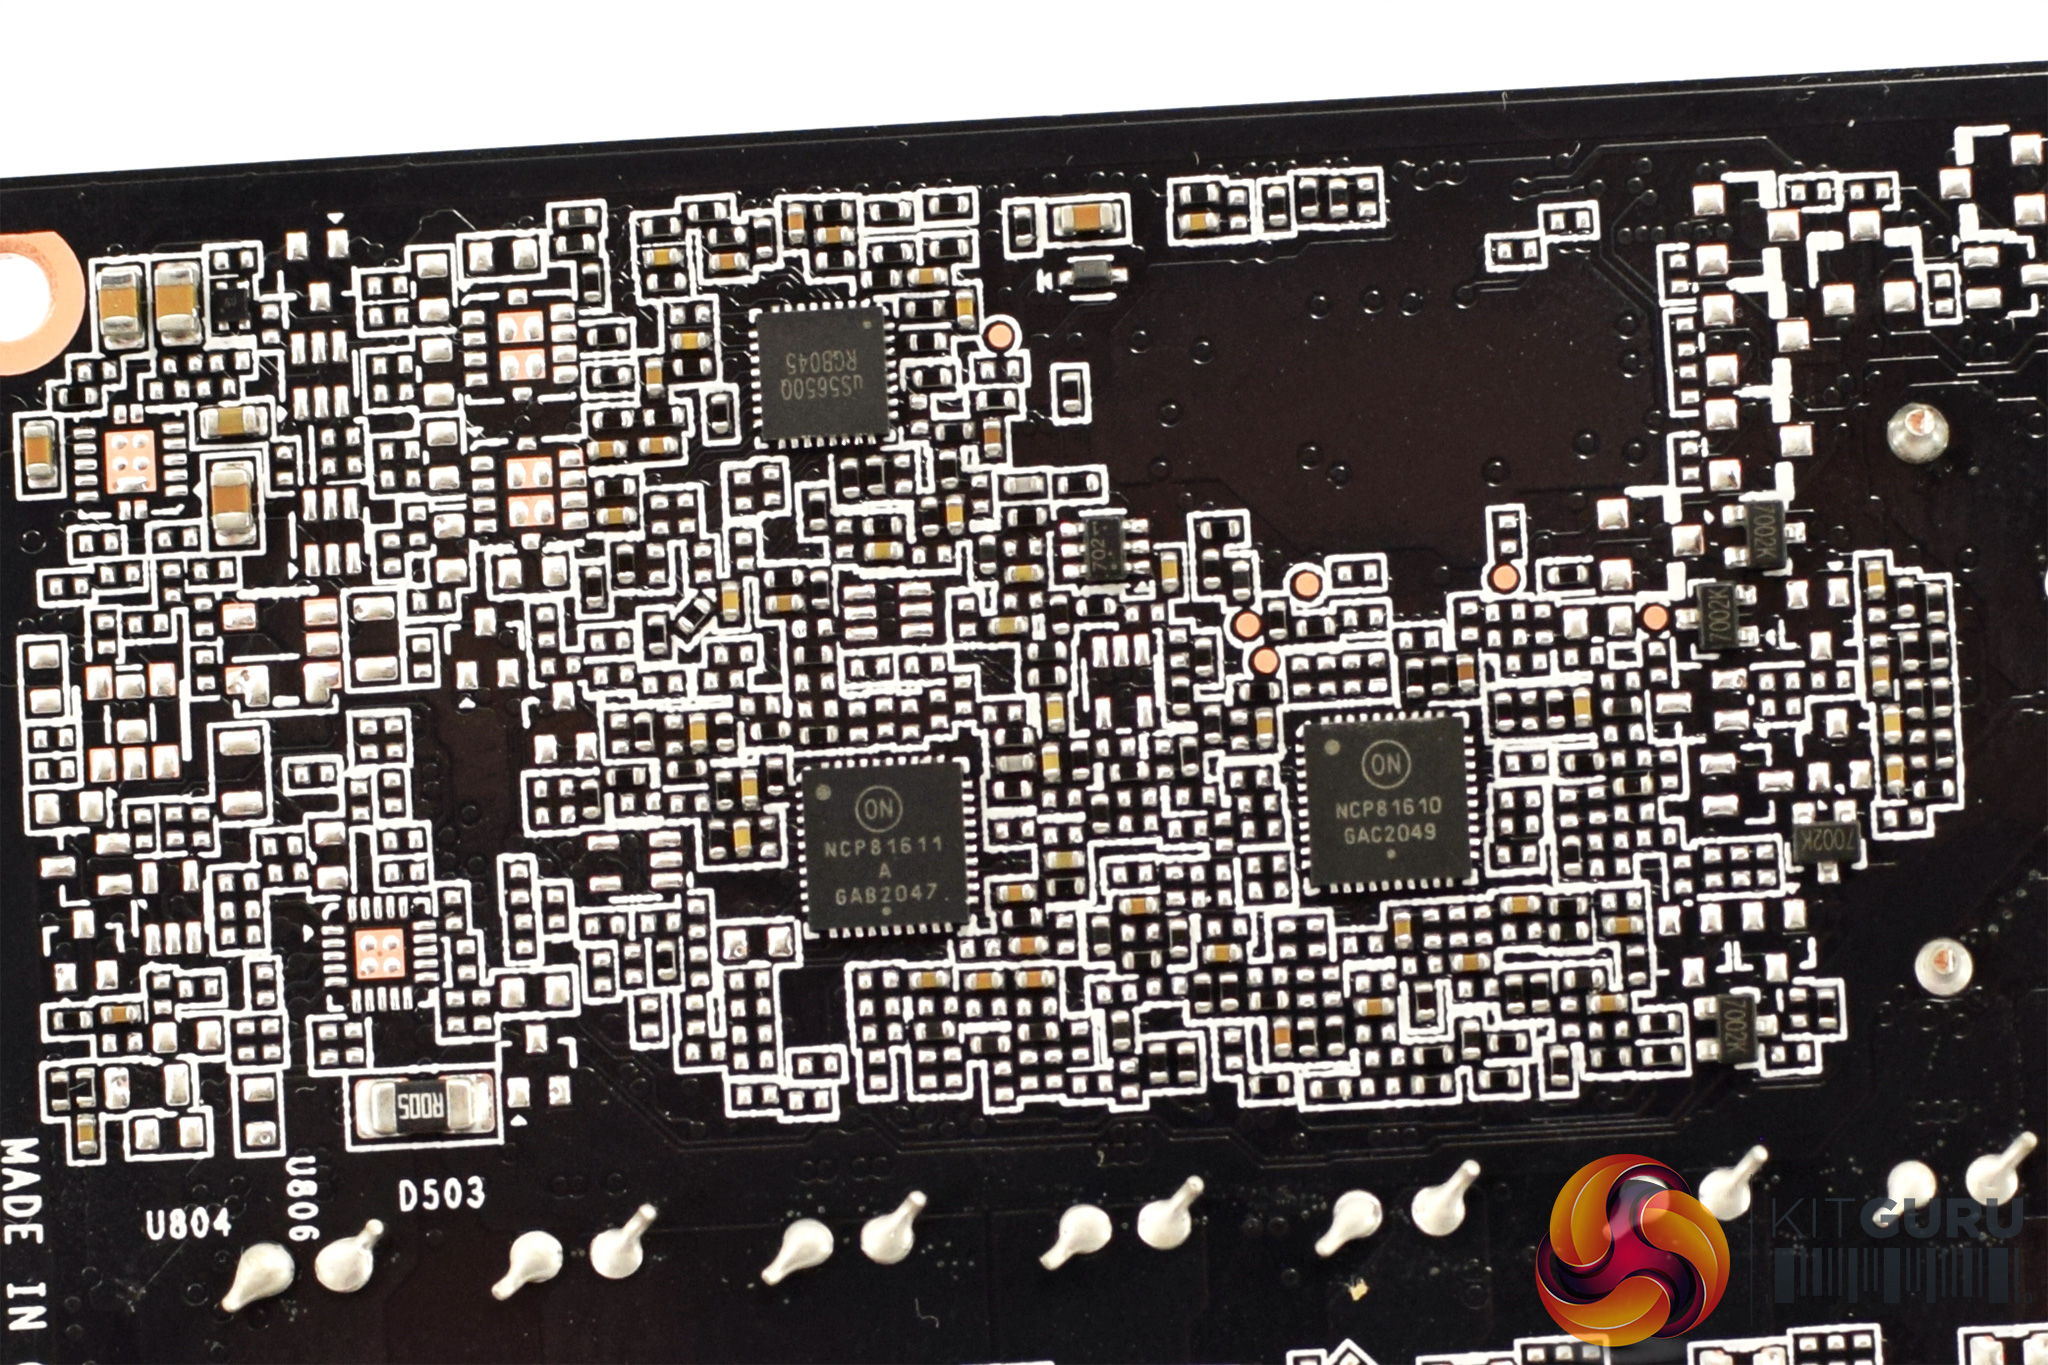
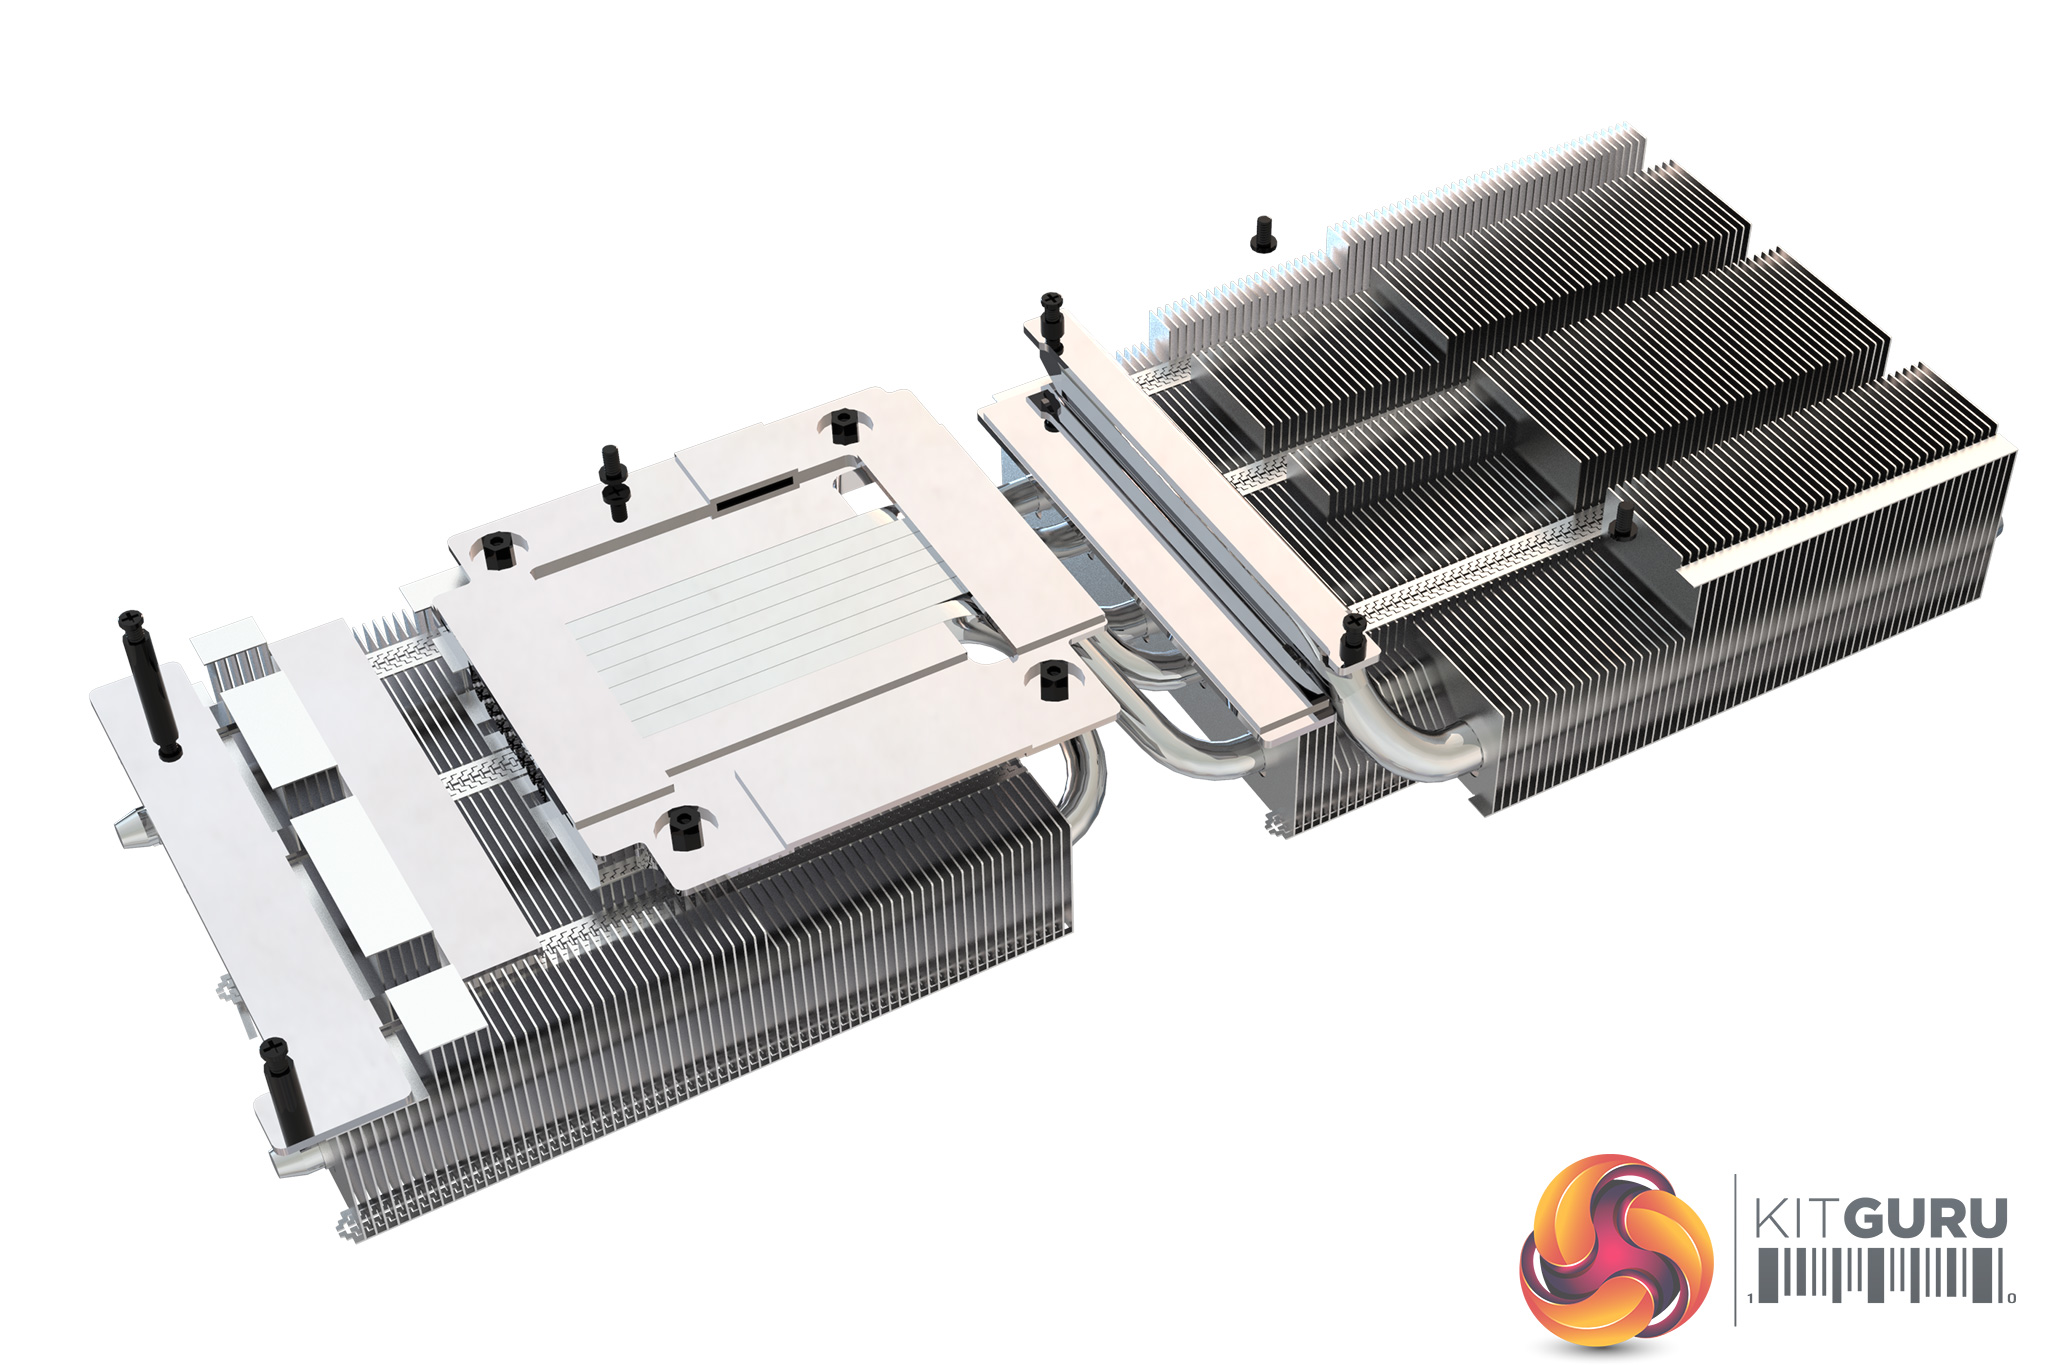
Taking the card apart to look at the PCB, we can see Palit has opted for a ‘beef up' VRM, with a total of 22 phases, which we'd expect to be split with 18 for the GPU and 4 for the memory. OnSemi's NCP302150 MOSFETs are used, rated for 50A average current output, while we can note two OnSemi NCP81611 controllers and one NCP81610 controller, alongside two UPI uS5650Q controllers.
We can also note Micron's GDDR6X memory, model code 0YT77D8BWW.
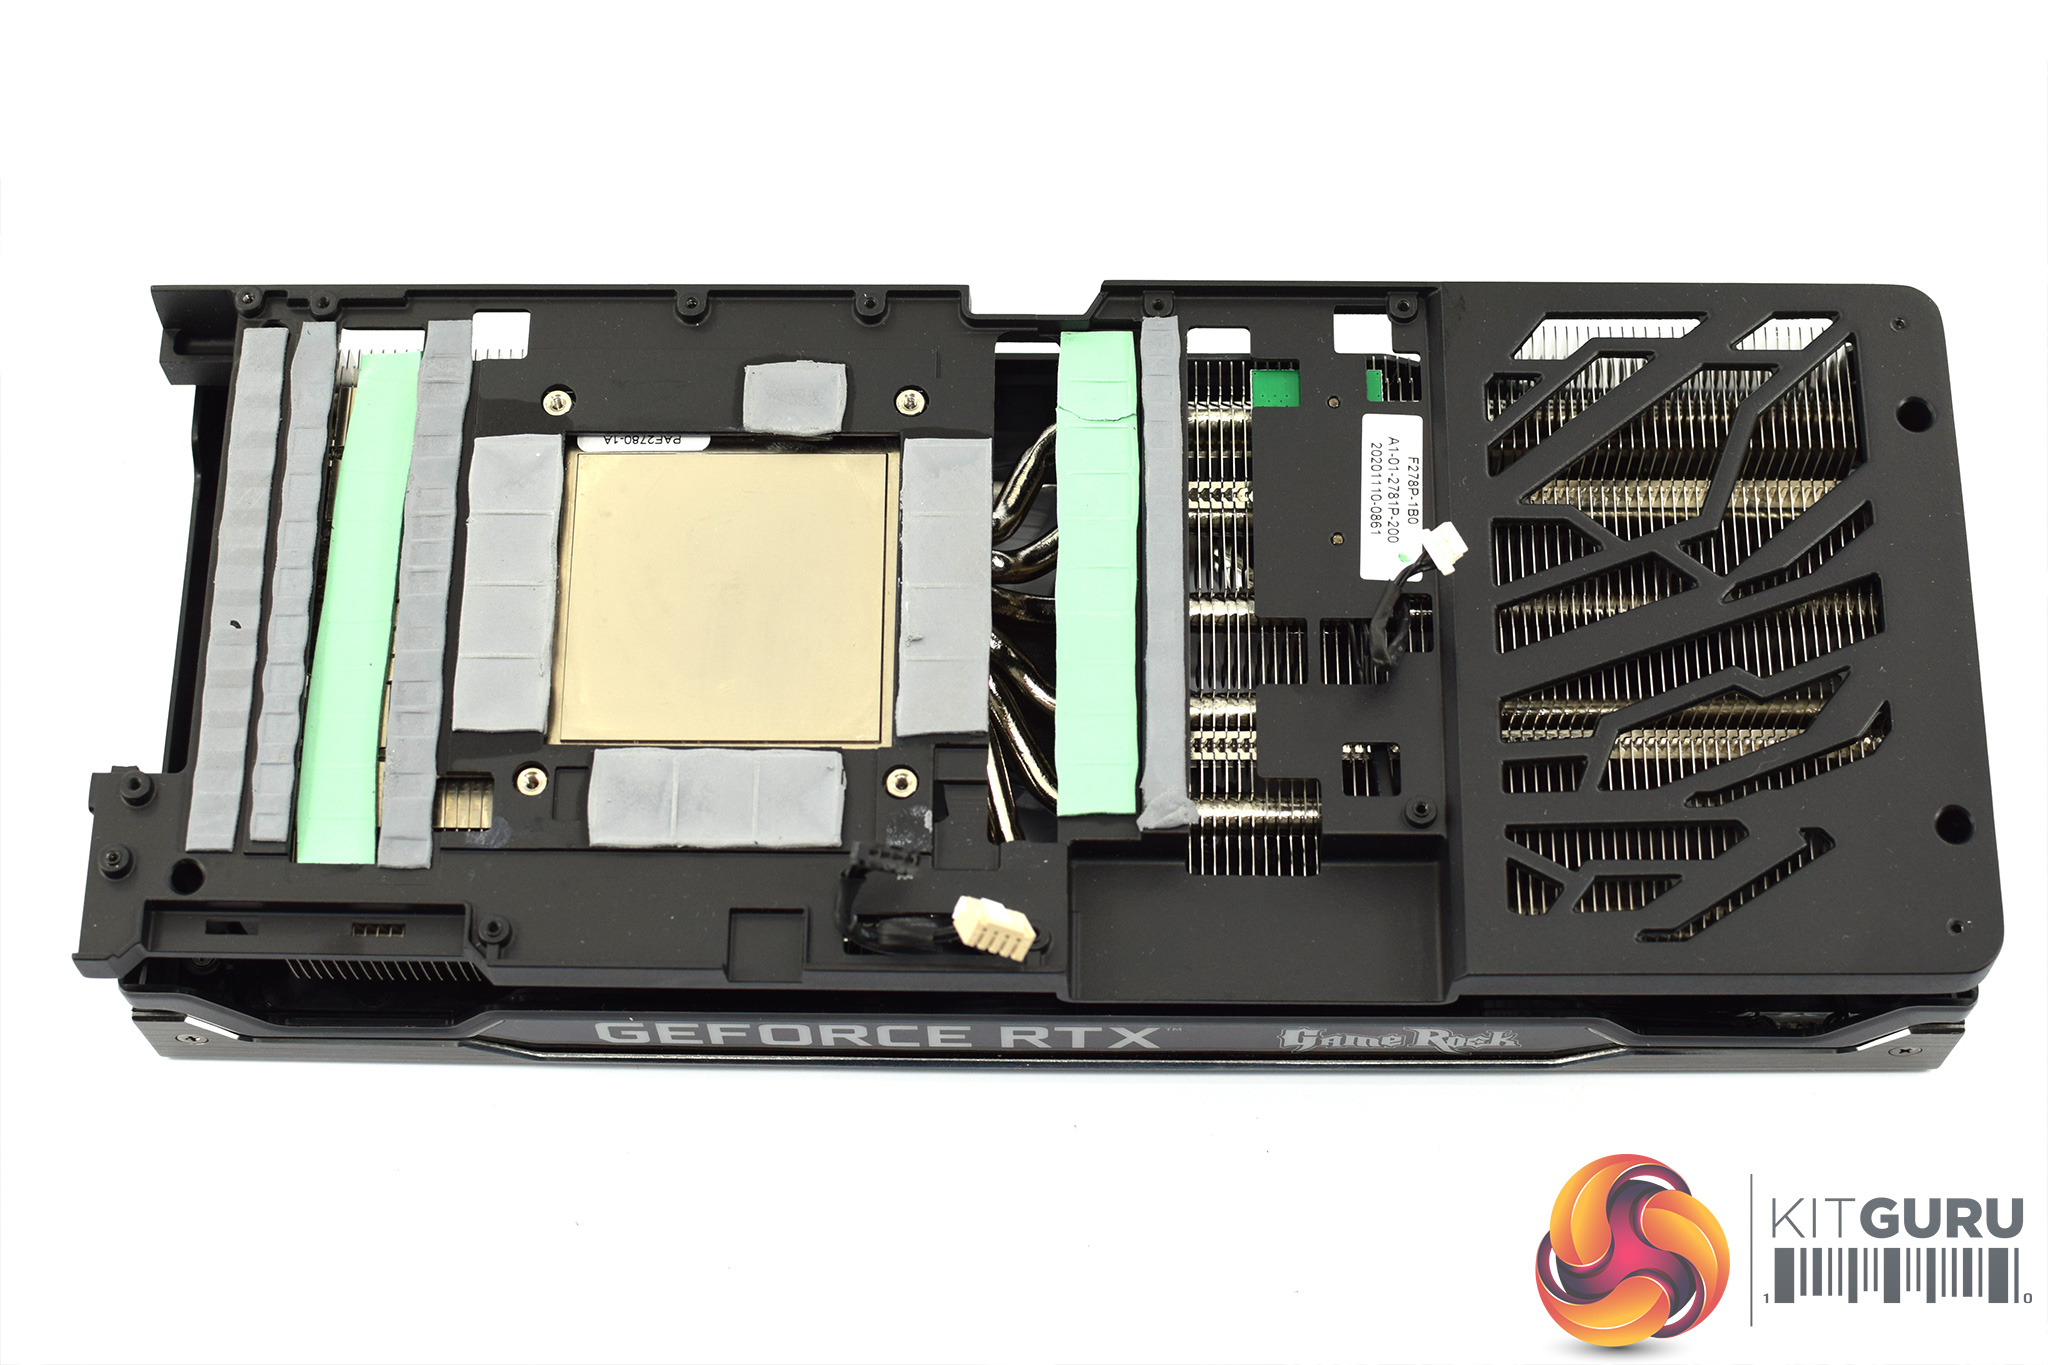
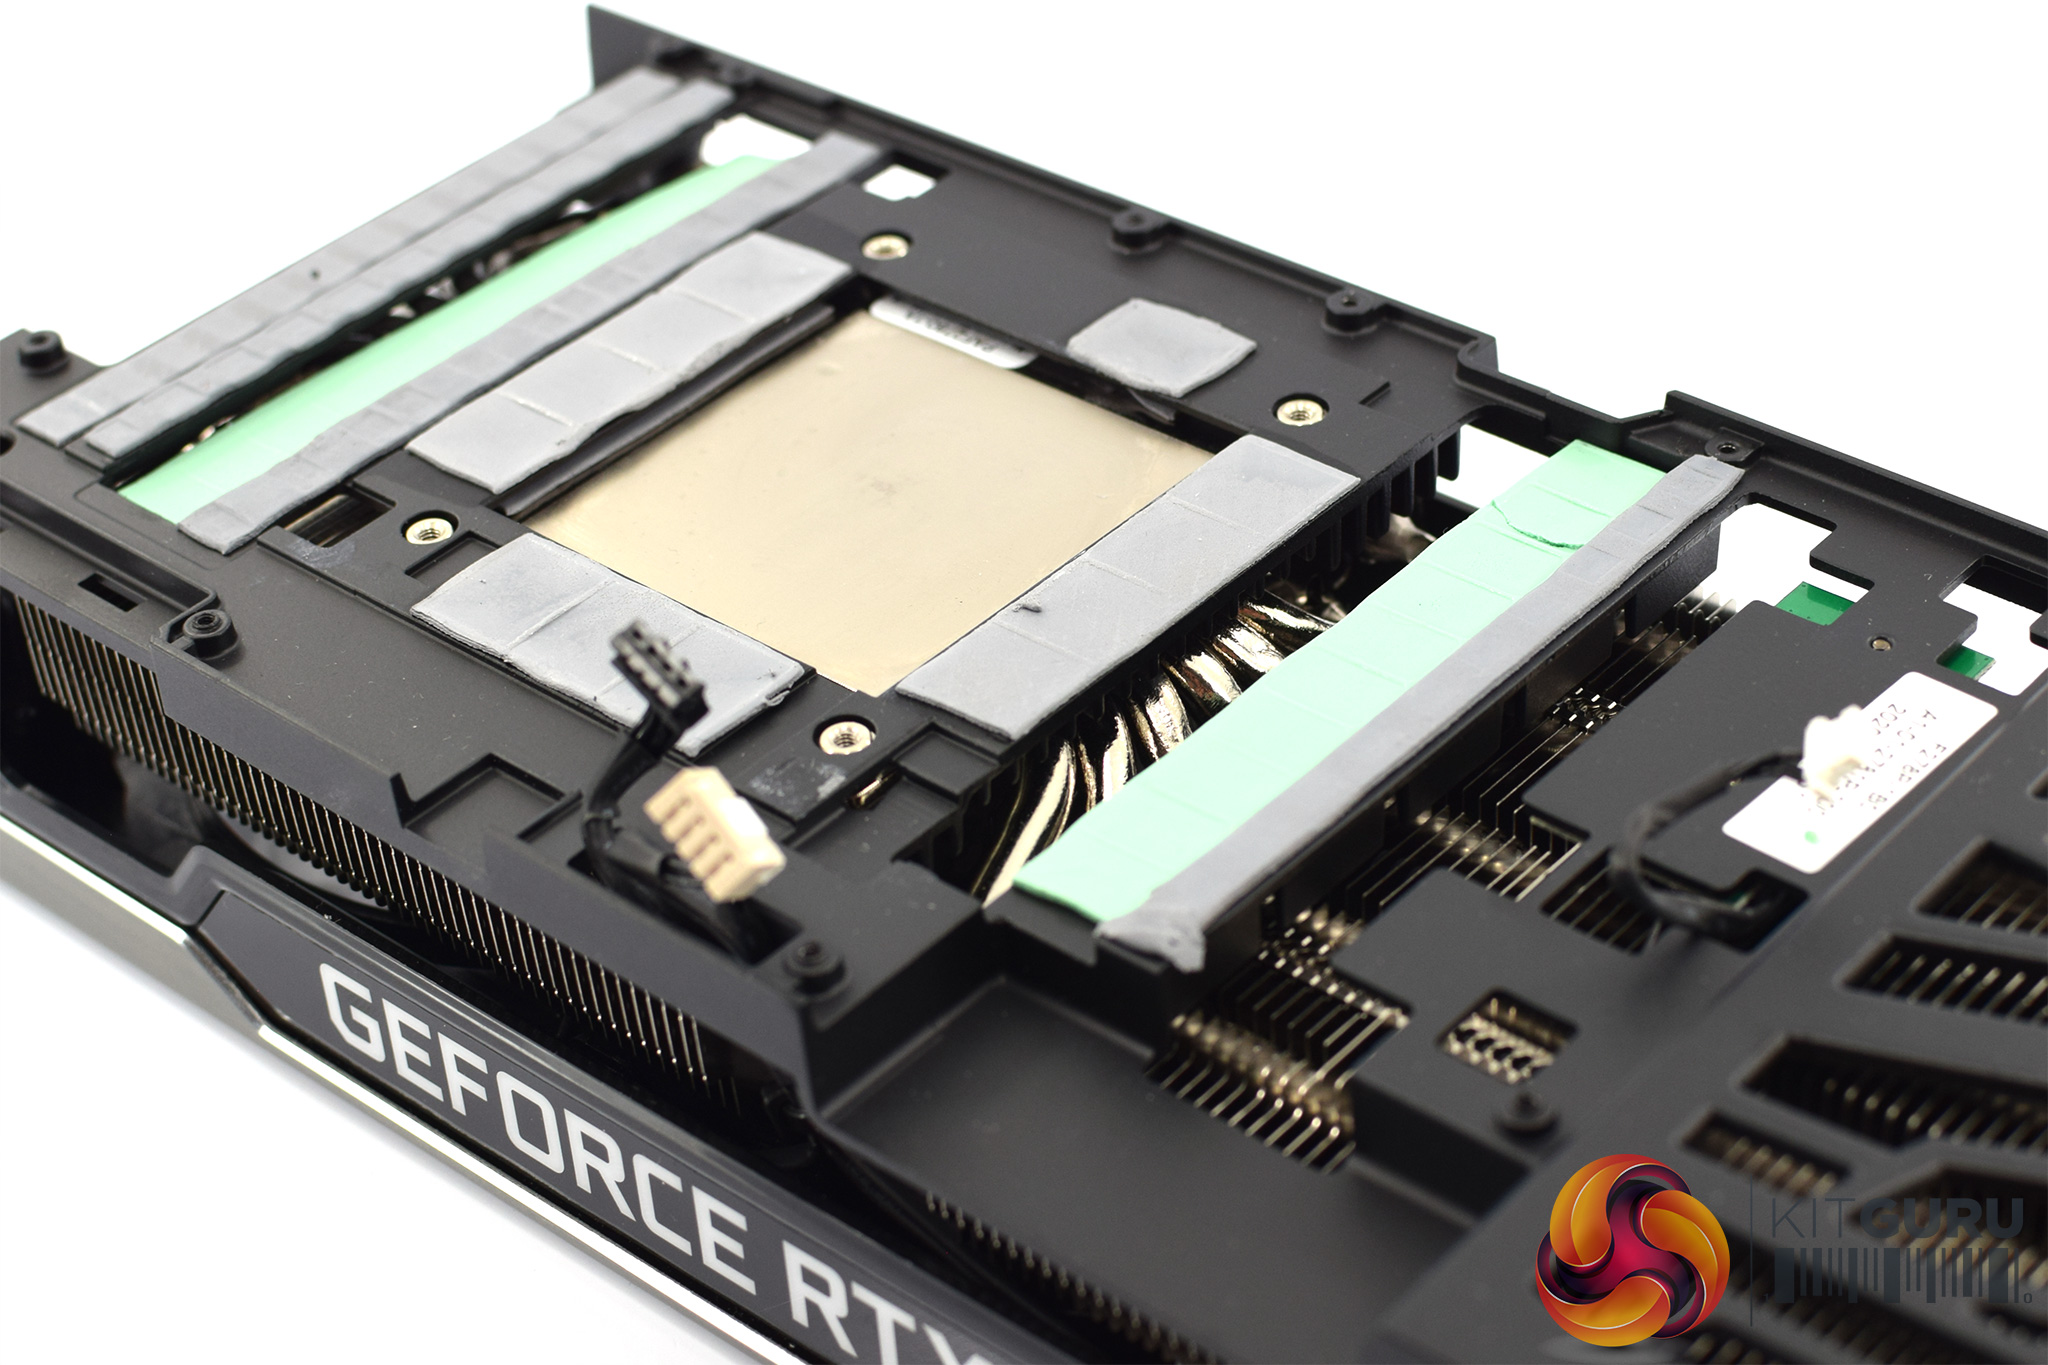
As for the heatsink, this uses two aluminium finstacks connected by a total of 6x 6mm heatpipes. The finstacks themselves are covered by a large die-cast plate, and this contacts with the VRM and VRAM via thermal pads. A central baseplate contacts with the GPU die.
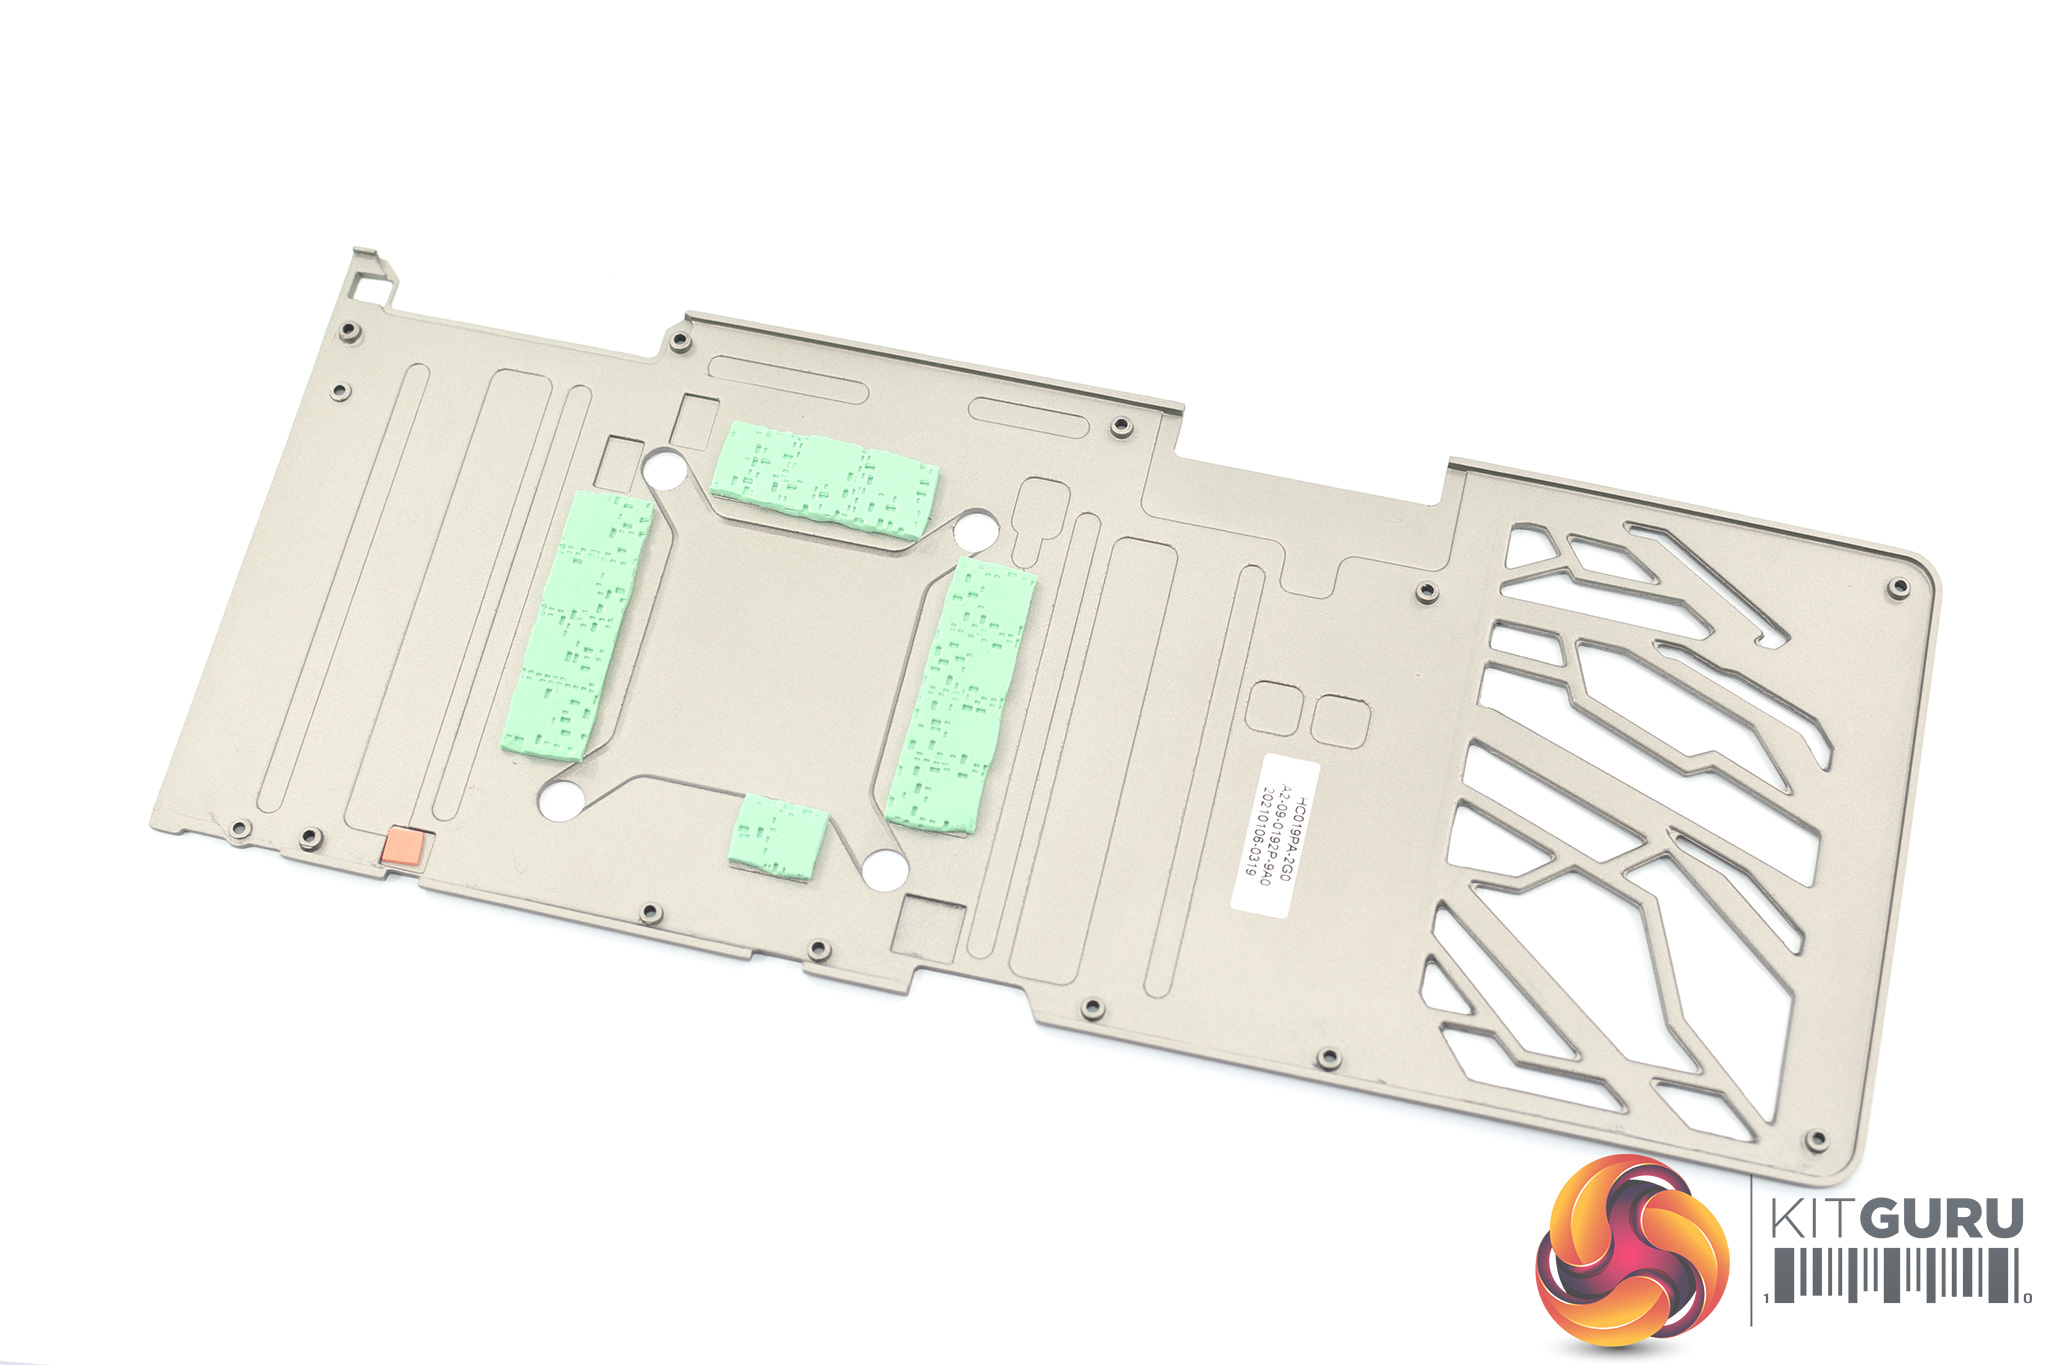
It's also good to see Palit using thermal pads on the backplate to contact with the back of the memory modules.
Driver Notes
- All Nvidia GPUs (except RTX 3080 Ti) were benchmarked with the 466.47 driver.
- RTX 3080 Ti was benchmarked with the 466.54 driver supplied to press.
- All AMD GPUs were benchmarked with the Adrenalin 21.5.2 driver.
Test System
We test using the a custom built system from PCSpecialist, based on Intel's Comet Lake-S platform. You can read more about it over HERE, and configure your own system from PCSpecialist HERE.
| CPU |
Intel Core i9-10900K
Overclocked to 5.1GHz on all cores |
| Motherboard |
ASUS ROG Maximus XII Hero Wi-Fi
|
| Memory |
Corsair Vengeance DDR4 3600MHz (4 X 8GB)
CL 18-22-22-42
|
| Graphics Card |
Varies
|
| System Drive |
500GB Samsung 970 Evo Plus M.2
|
| Games Drive | 2TB Samsung 860 QVO 2.5″ SSD |
| Chassis | Fractal Meshify S2 Blackout Tempered Glass |
| CPU Cooler |
Corsair H115i RGB Platinum Hydro Series
|
| Power Supply |
Corsair 1200W HX Series Modular 80 Plus Platinum
|
| Operating System |
Windows 10 2004
|
Comparison Graphics Cards List
- Gigabyte RTX 3090 Eagle 24GB
- ASUS RTX 3080 TUF Gaming 10GB
- Nvidia RTX 3070 FE 8GB
- Nvidia RTX 3060 Ti FE 8GB
- Nvidia RTX 2080 Ti FE 11GB
- AMD RX 6900 XT 16GB
- AMD RX 6800 XT 16GB
- AMD RX 6800 16GB
- AMD RX 6700 XT 12GB
Software and Games List
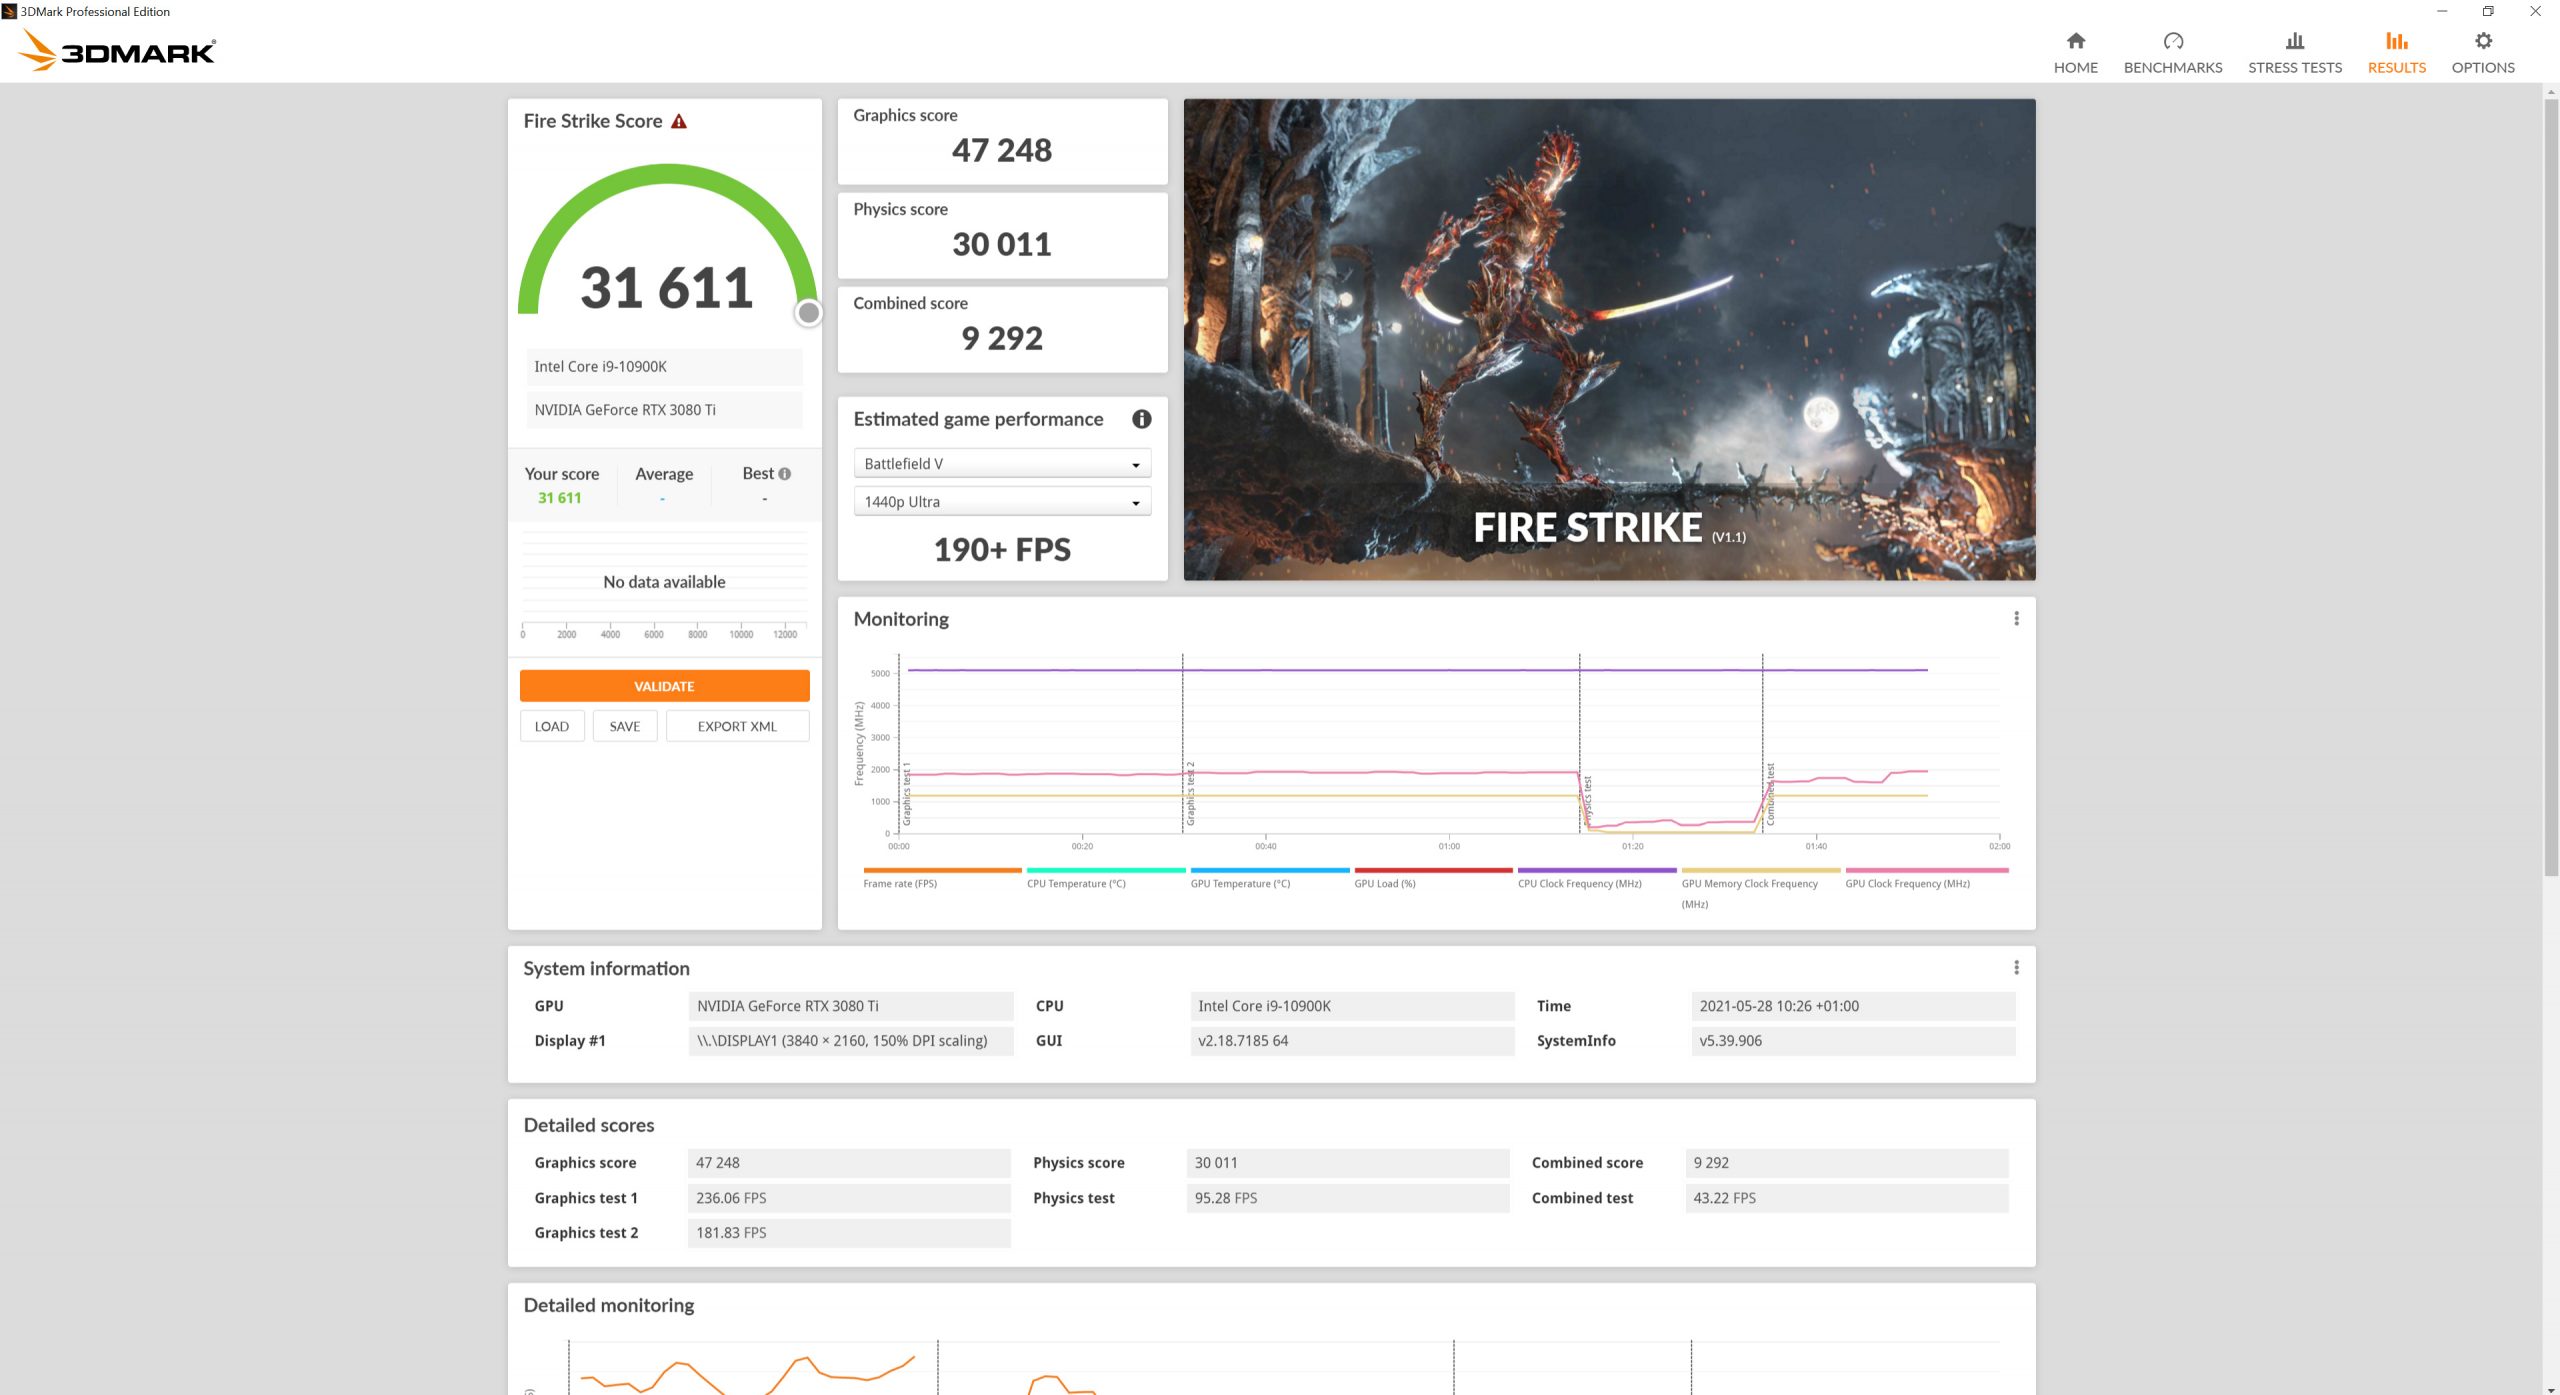
- 3DMark Fire Strike & Fire Strike Ultra (DX11 Synthetic)
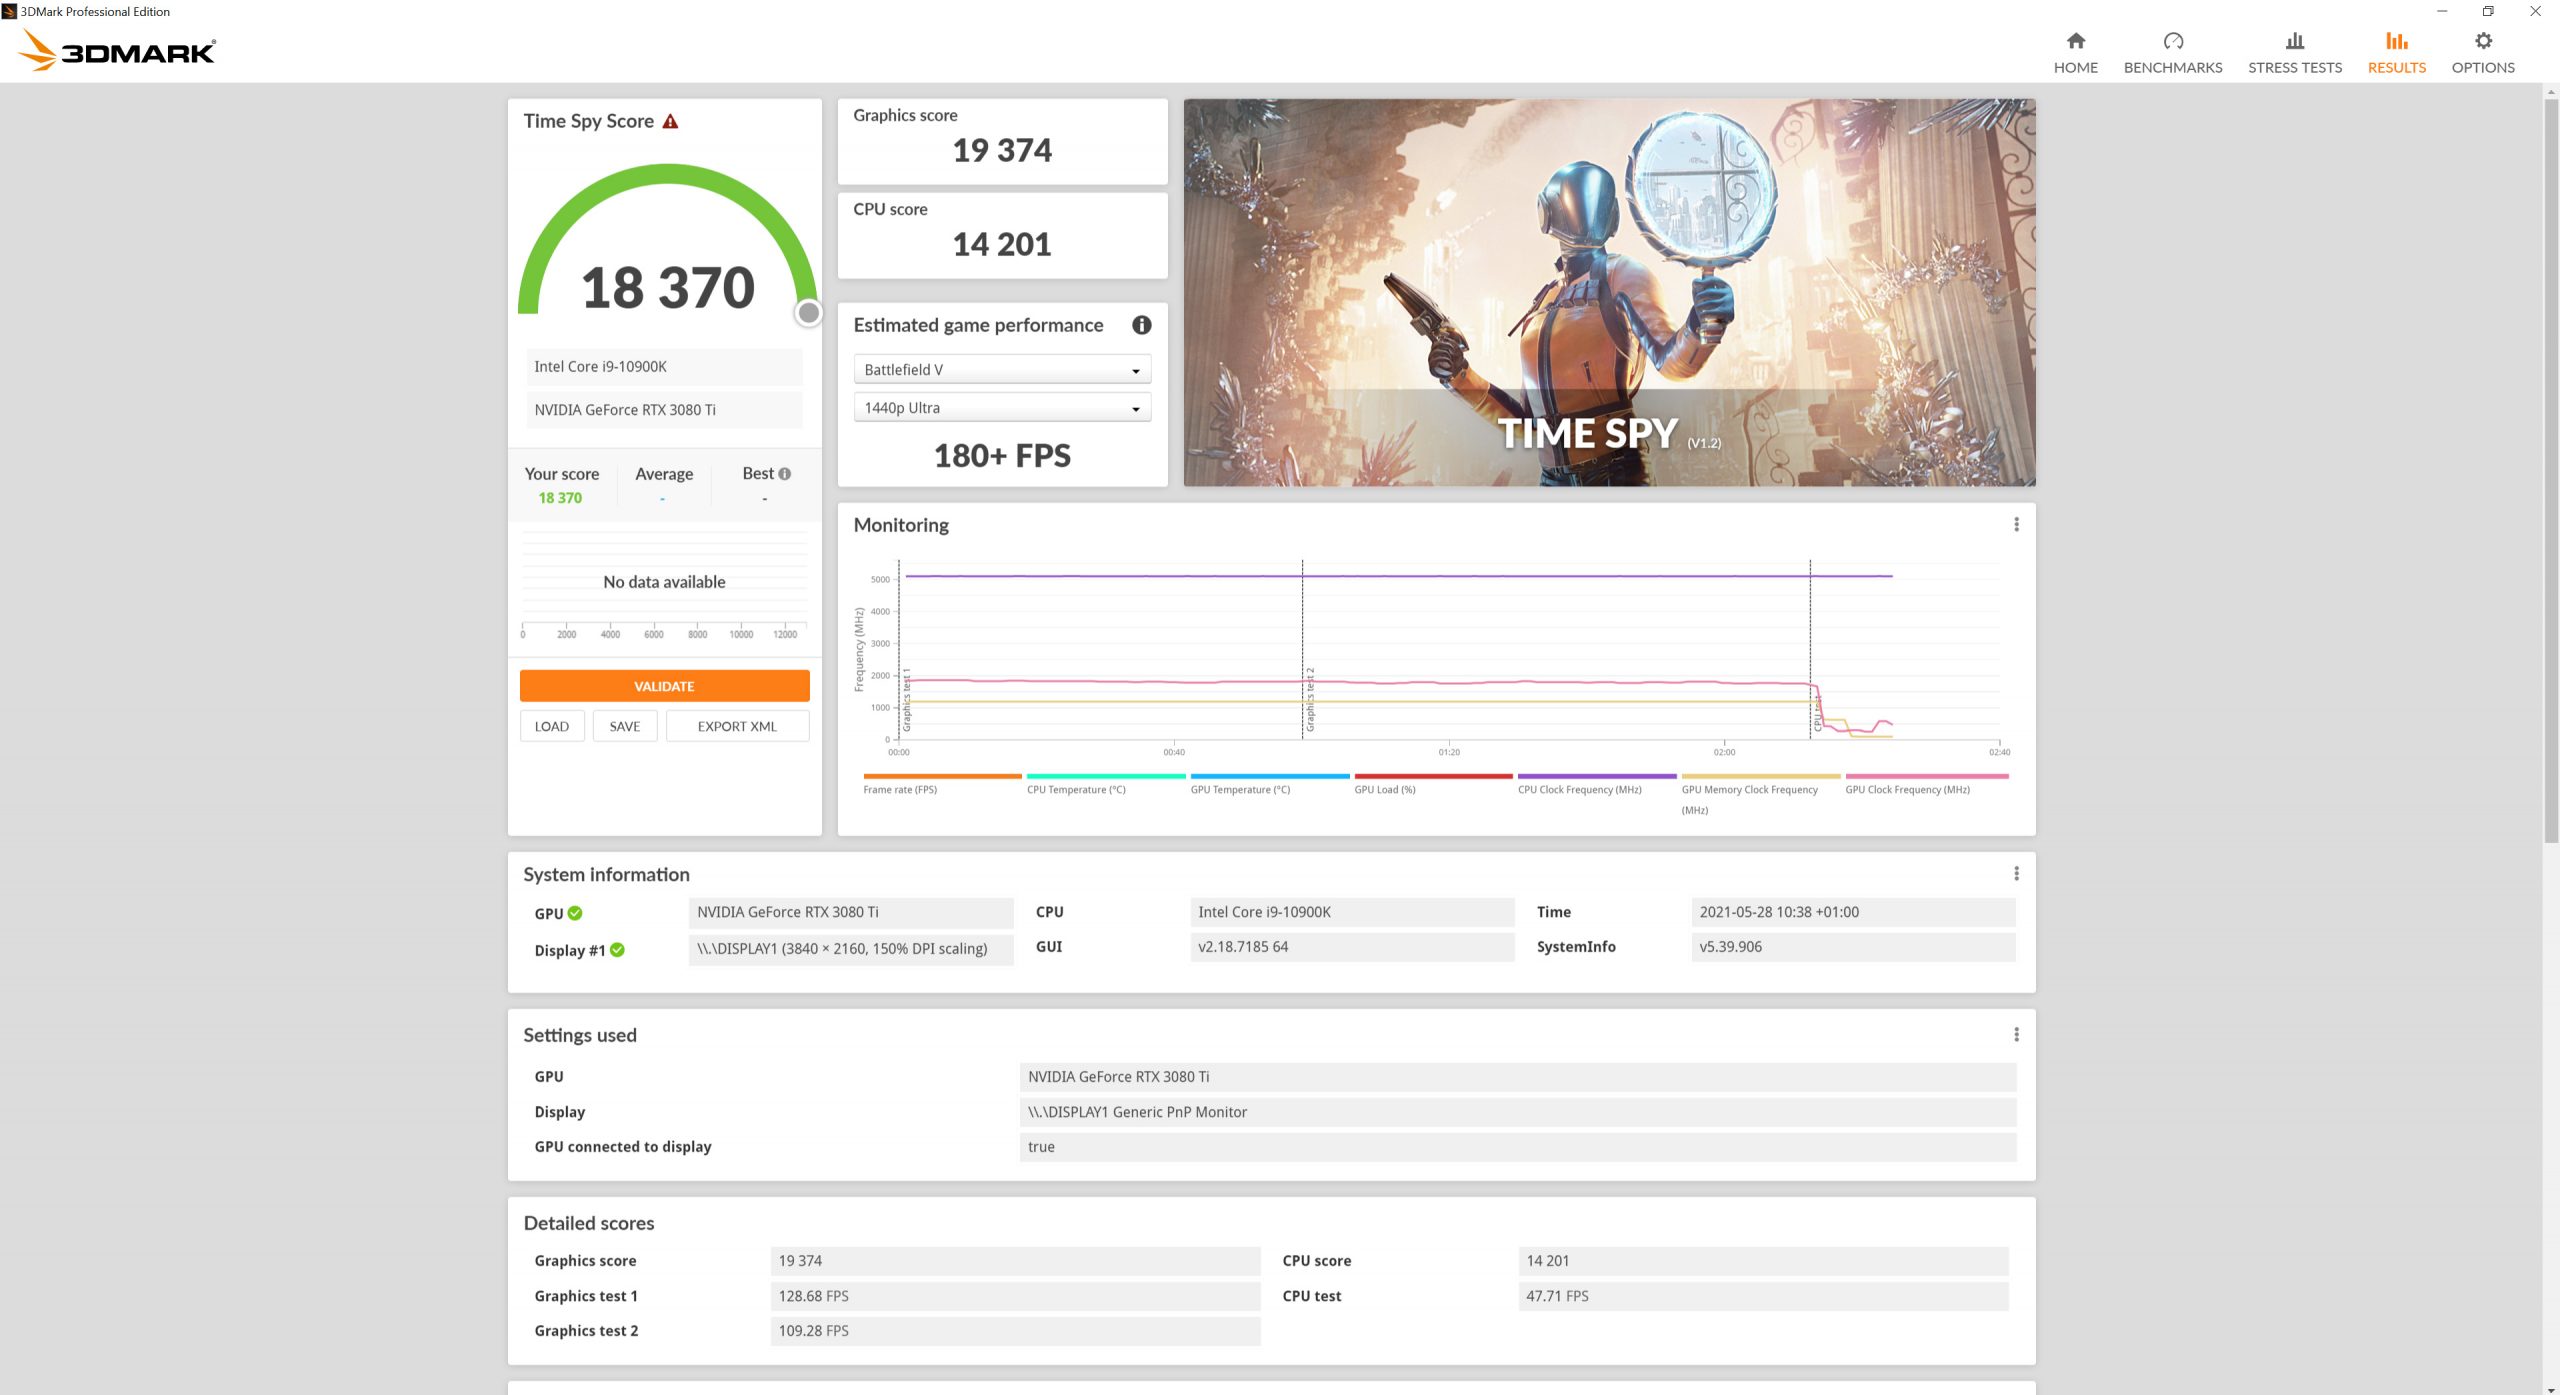
- 3DMark Time Spy (DX12 Synthetic)
- 3DMark Raytracing Feature Test (DXR Synthetic)
- Assassin's Creed Valhalla (DX12)
- Control (DX12)
- Cyberpunk 2077 (DX12)
- Days Gone (DX11)
- F1 2020 (DX12)
- Gears 5 (DX12)
- Hitman 3 (DX12)
- Horizon Zero Dawn (DX12)
- Metro Exodus Enhanced Edition (DXR)
- Red Dead Redemption 2 (Vulkan)
- Resident Evil Village (DX12)
- Total War Saga: Troy (DX11)
- Watch Dogs: Legion (DX12)
We run each benchmark/game three times, and present mean averages in our graphs. We use FrameView to measure average frame rates as well as 1% low values across our three runs.
Fire Strike is a showcase DirectX 11 benchmark for modern gaming PCs. Its ambitious real-time graphics are rendered with detail and complexity far beyond other DirectX 11 benchmarks and games. Fire Strike includes two graphics tests, a physics test and a combined test that stresses the CPU and GPU. (UL).
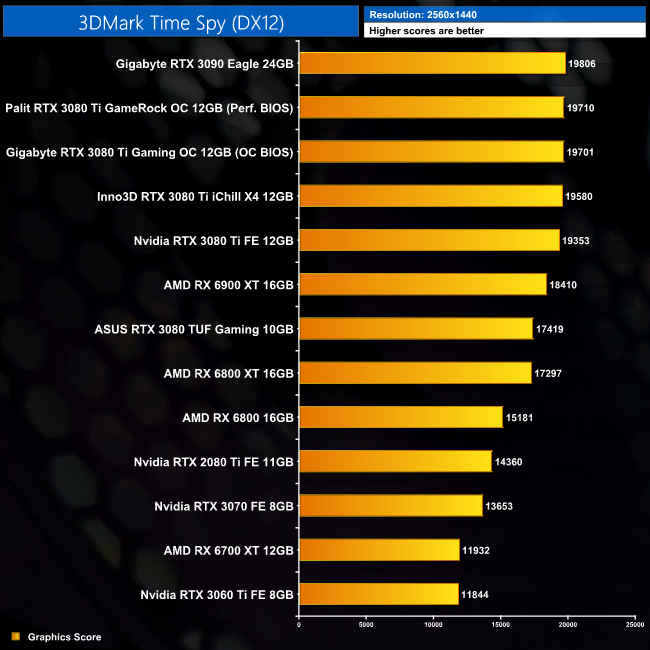
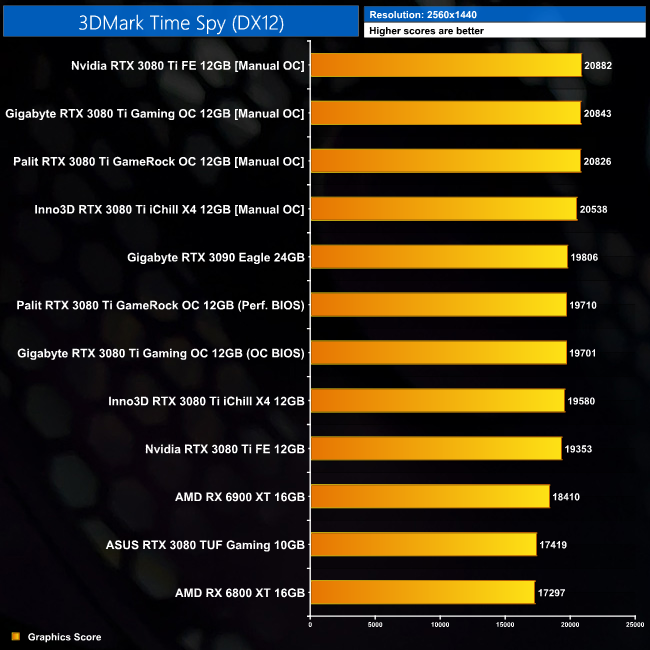
3DMark Time Spy is a DirectX 12 benchmark test for Windows 10 gaming PCs. Time Spy is one of the first DirectX 12 apps to be built the right way from the ground up to fully realize the performance gains that the new API offers. With its pure DirectX 12 engine, which supports new API features like asynchronous compute, explicit multi-adapter, and multi-threading, Time Spy is the ideal test for benchmarking the latest graphics cards. (UL).
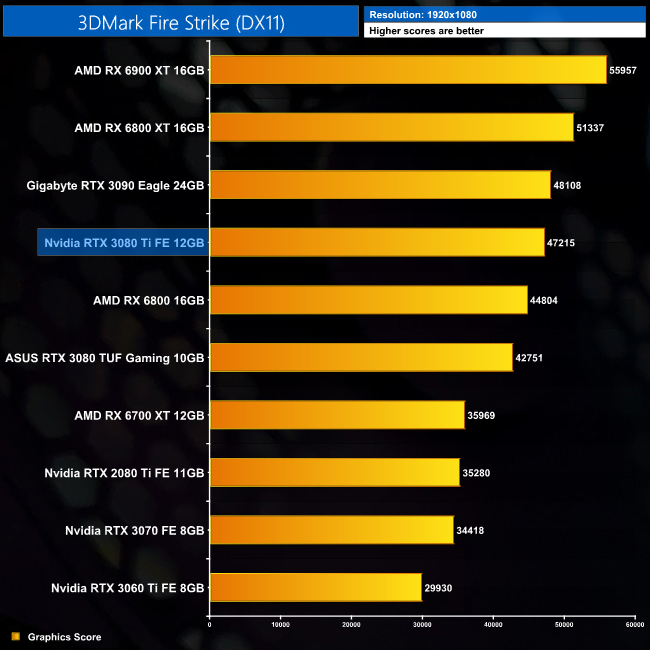
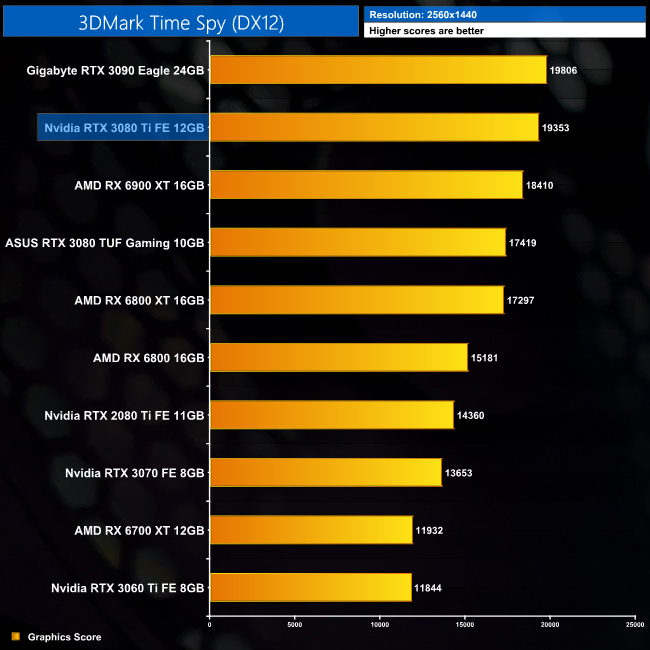
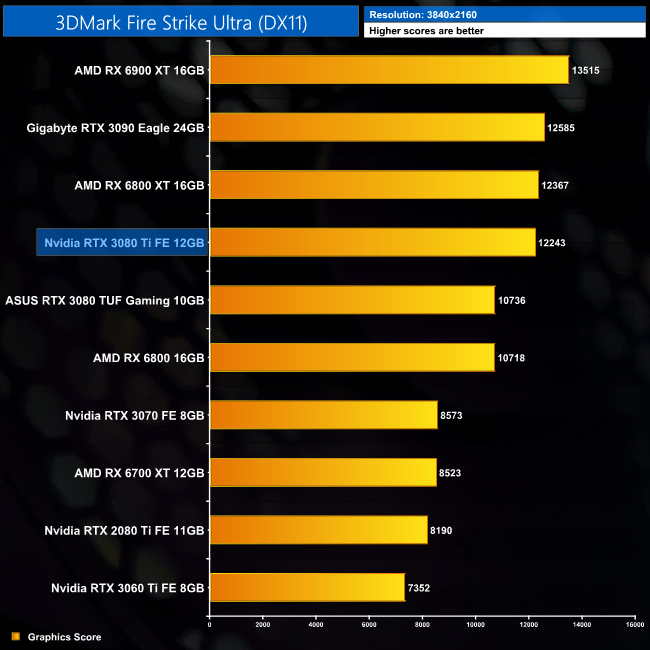
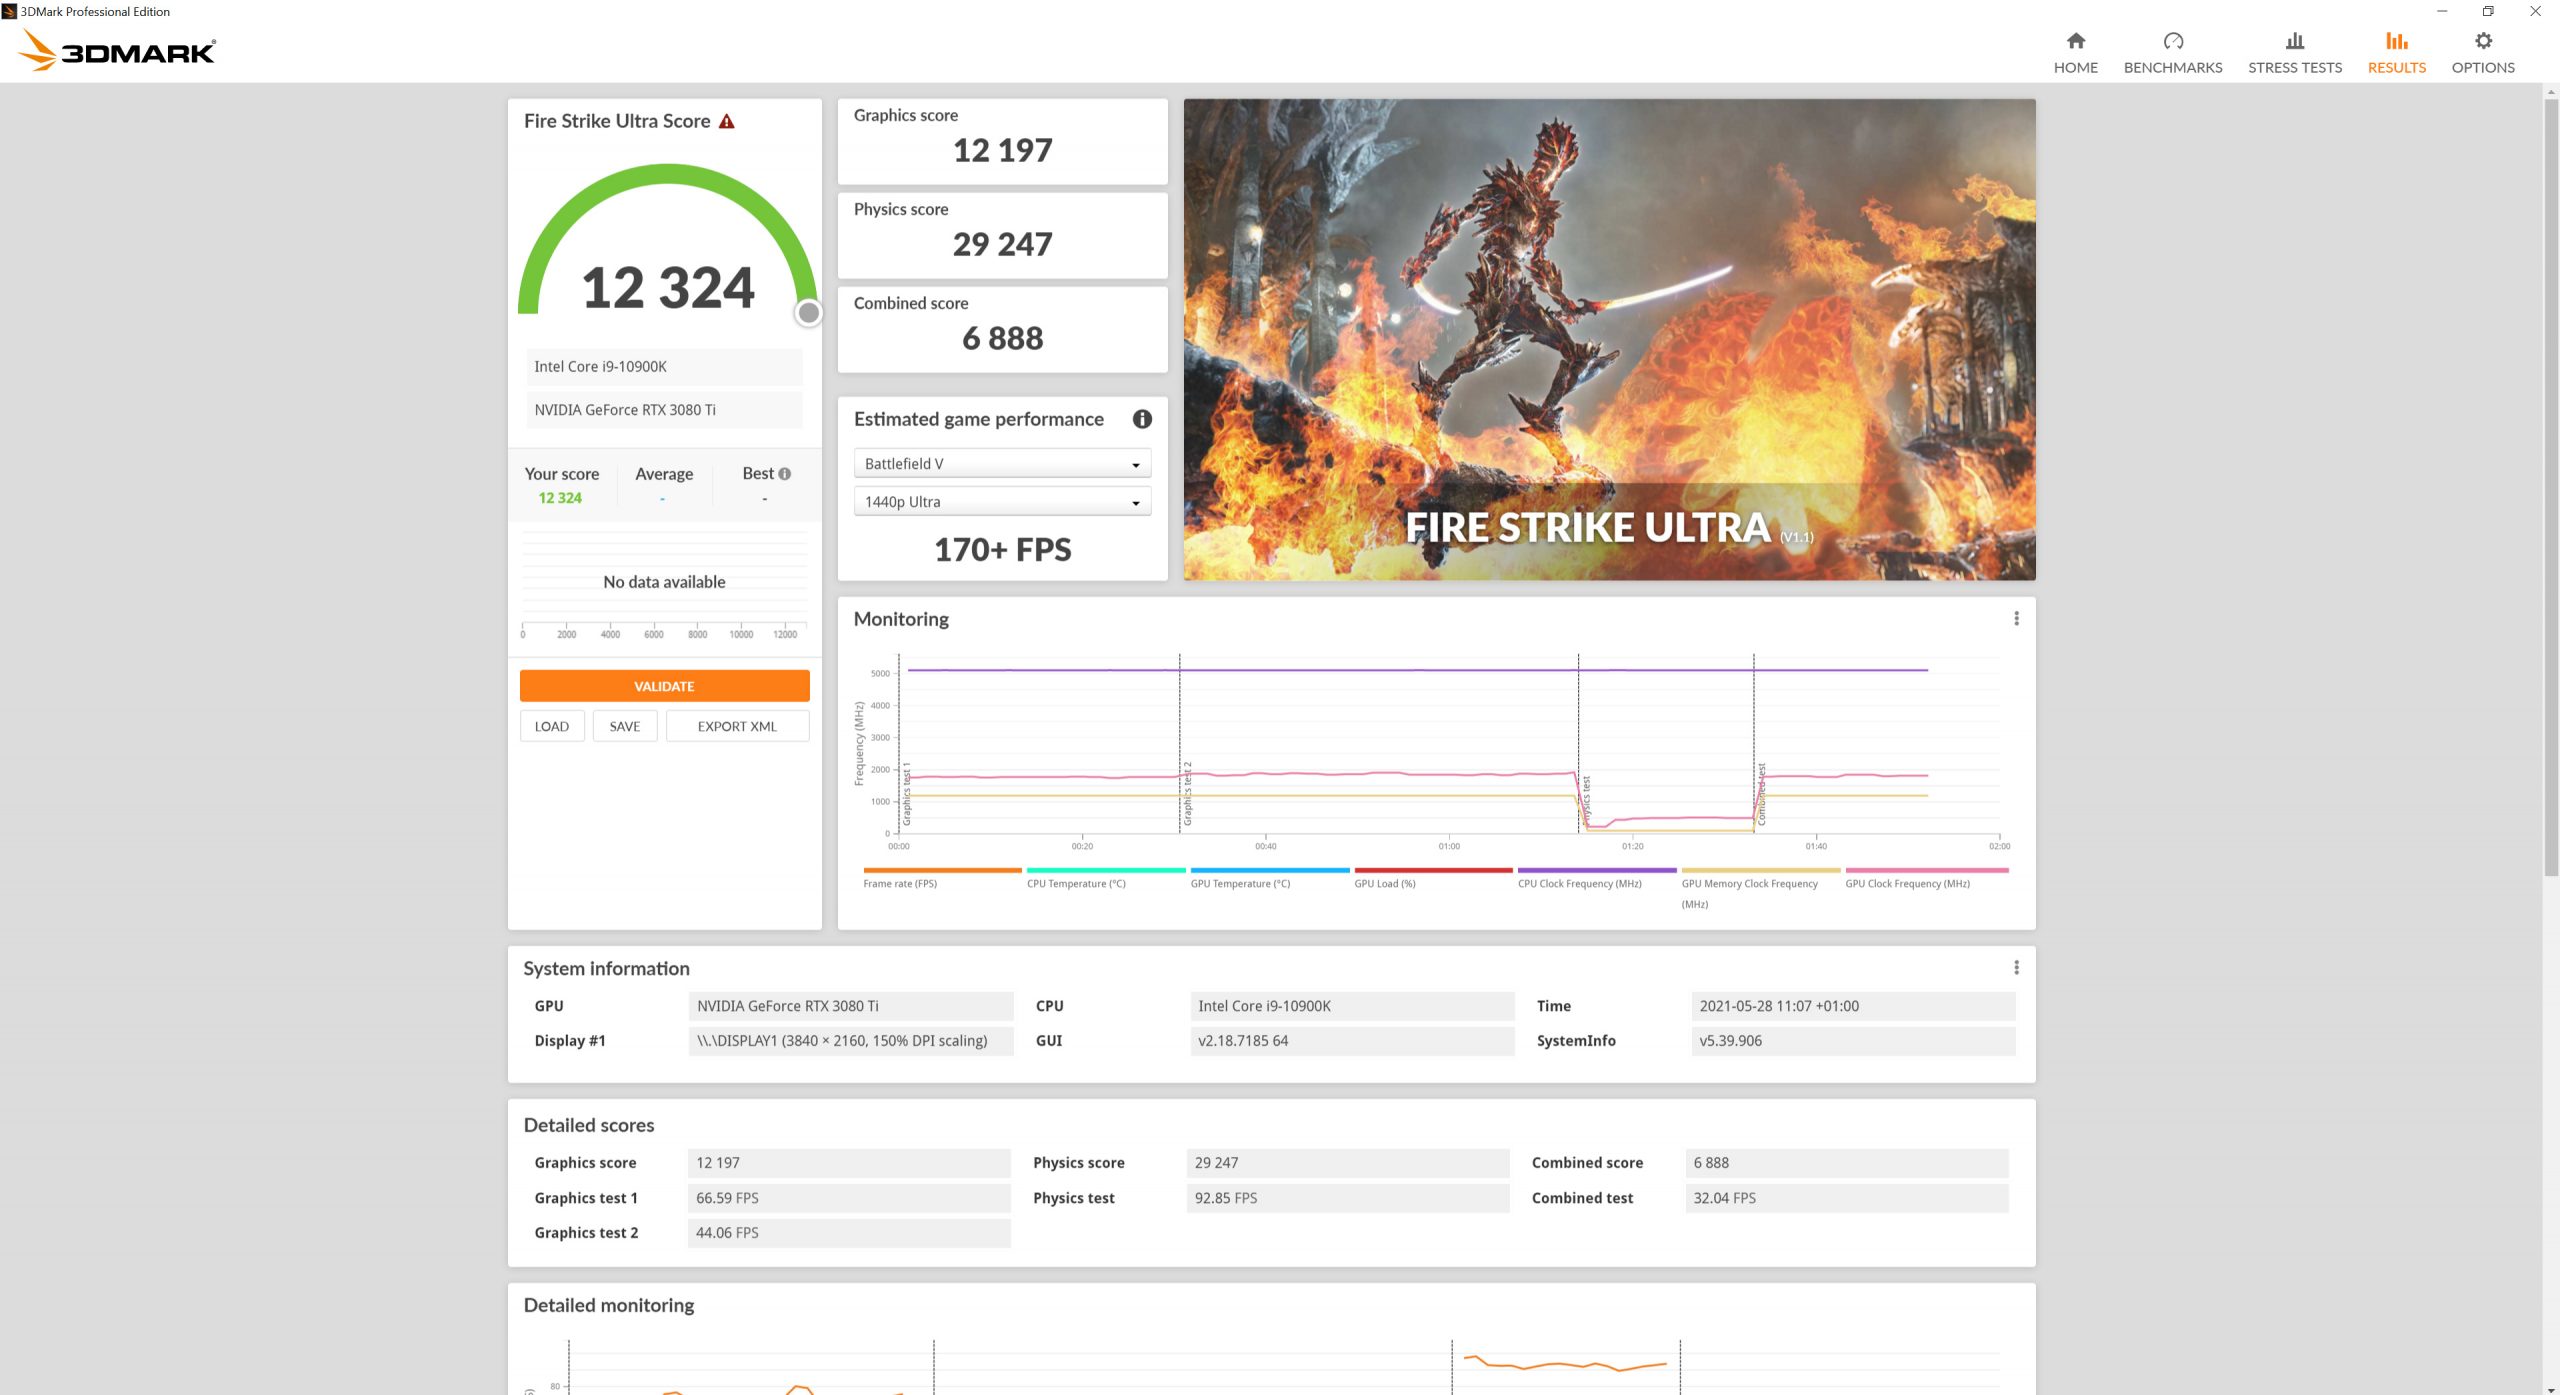
Kicking off with the 3DMark benchmarks, we can immediately see the RTX 3080 Ti is snapping right at the heels of the RTX 3090. It's only 2% slower in Fire Strike and Time Spy, though that margin does widen to 3% with Fire Strike Ultra.
Real-time ray tracing is incredibly demanding. The latest graphics cards have dedicated hardware that’s optimized for ray-tracing. The 3DMark DirectX Raytracing feature test measures the performance of this dedicated hardware. Instead of using traditional rendering techniques, the whole scene is ray-traced and drawn in one pass. The result of the test depends entirely on ray-tracing performance. (UL).
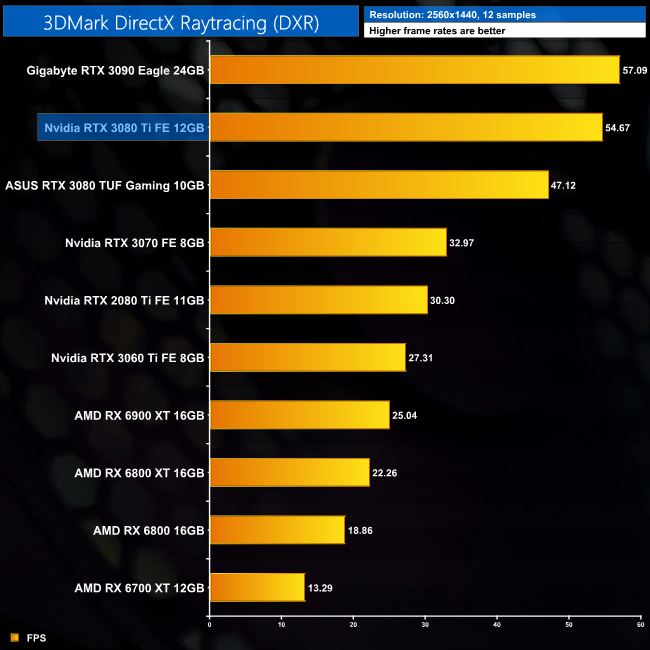
As for the 3DMark DXR feature-test, here the RTX 3080 Ti is 4% behind the RTX 3090. This is still a very small difference between the two, but it is slightly larger than what we saw from the regular 3DMark benchmarks, which we'd say is a result of this test's complete reliance on ray tracing hardware.
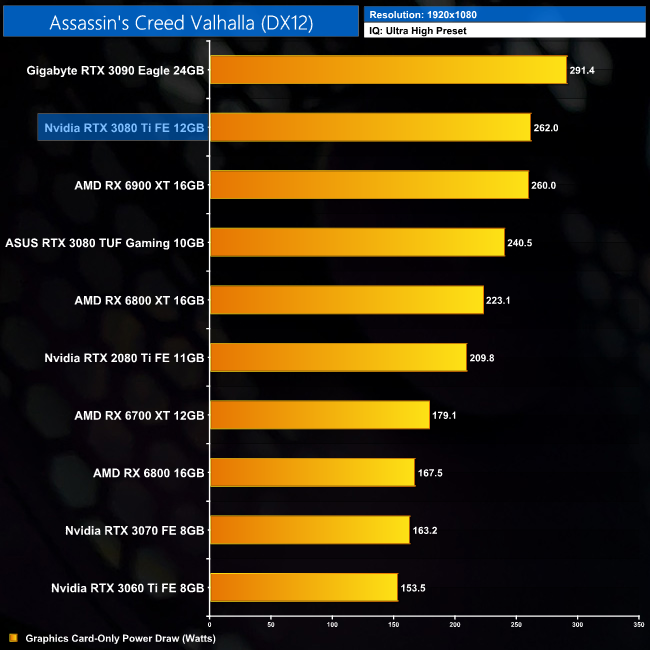
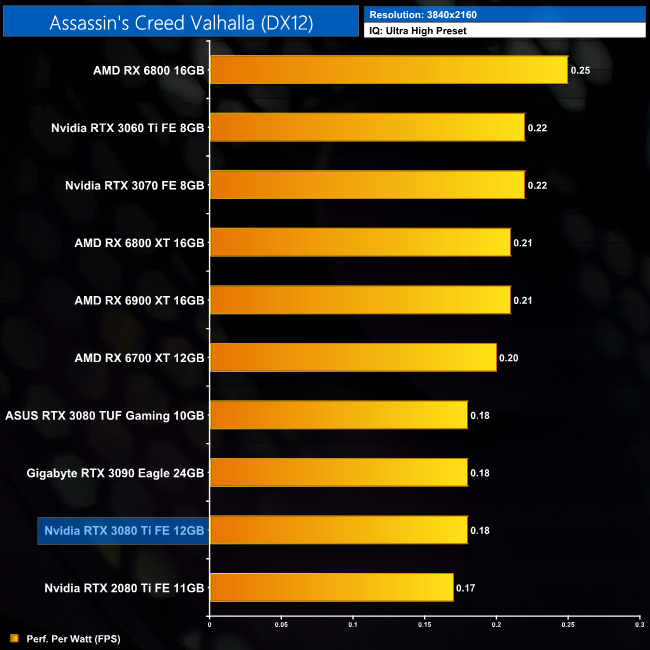
Assassin's Creed Valhalla is an action role-playing video game developed by Ubisoft Montreal and published by Ubisoft. It is the twelfth major installment and the twenty-second release in the Assassin's Creed series, and a successor to the 2018's Assassin's Creed Odyssey. The game was released on November 10, 2020, for Microsoft Windows, PlayStation 4, Xbox One, Xbox Series X and Series S, and Stadia, while the PlayStation 5 version was released on November 12. (Wikipedia.)
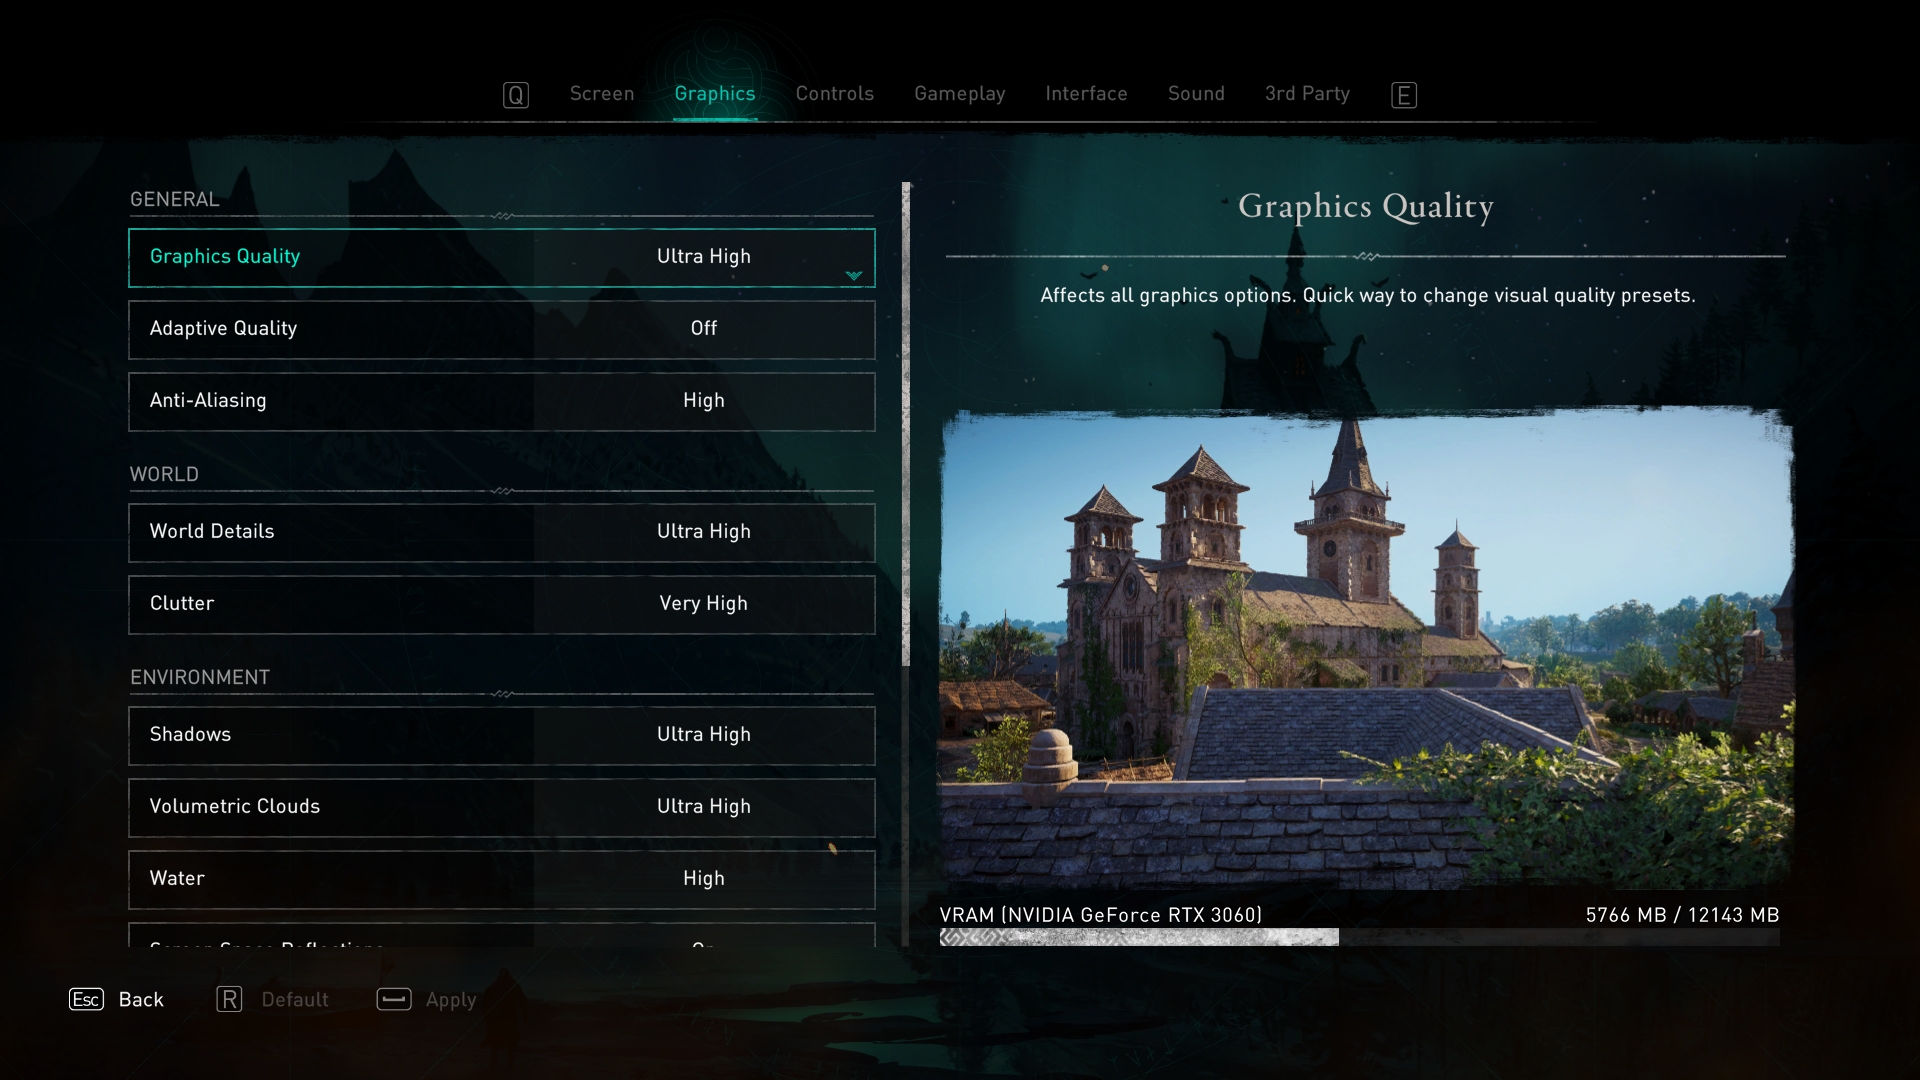
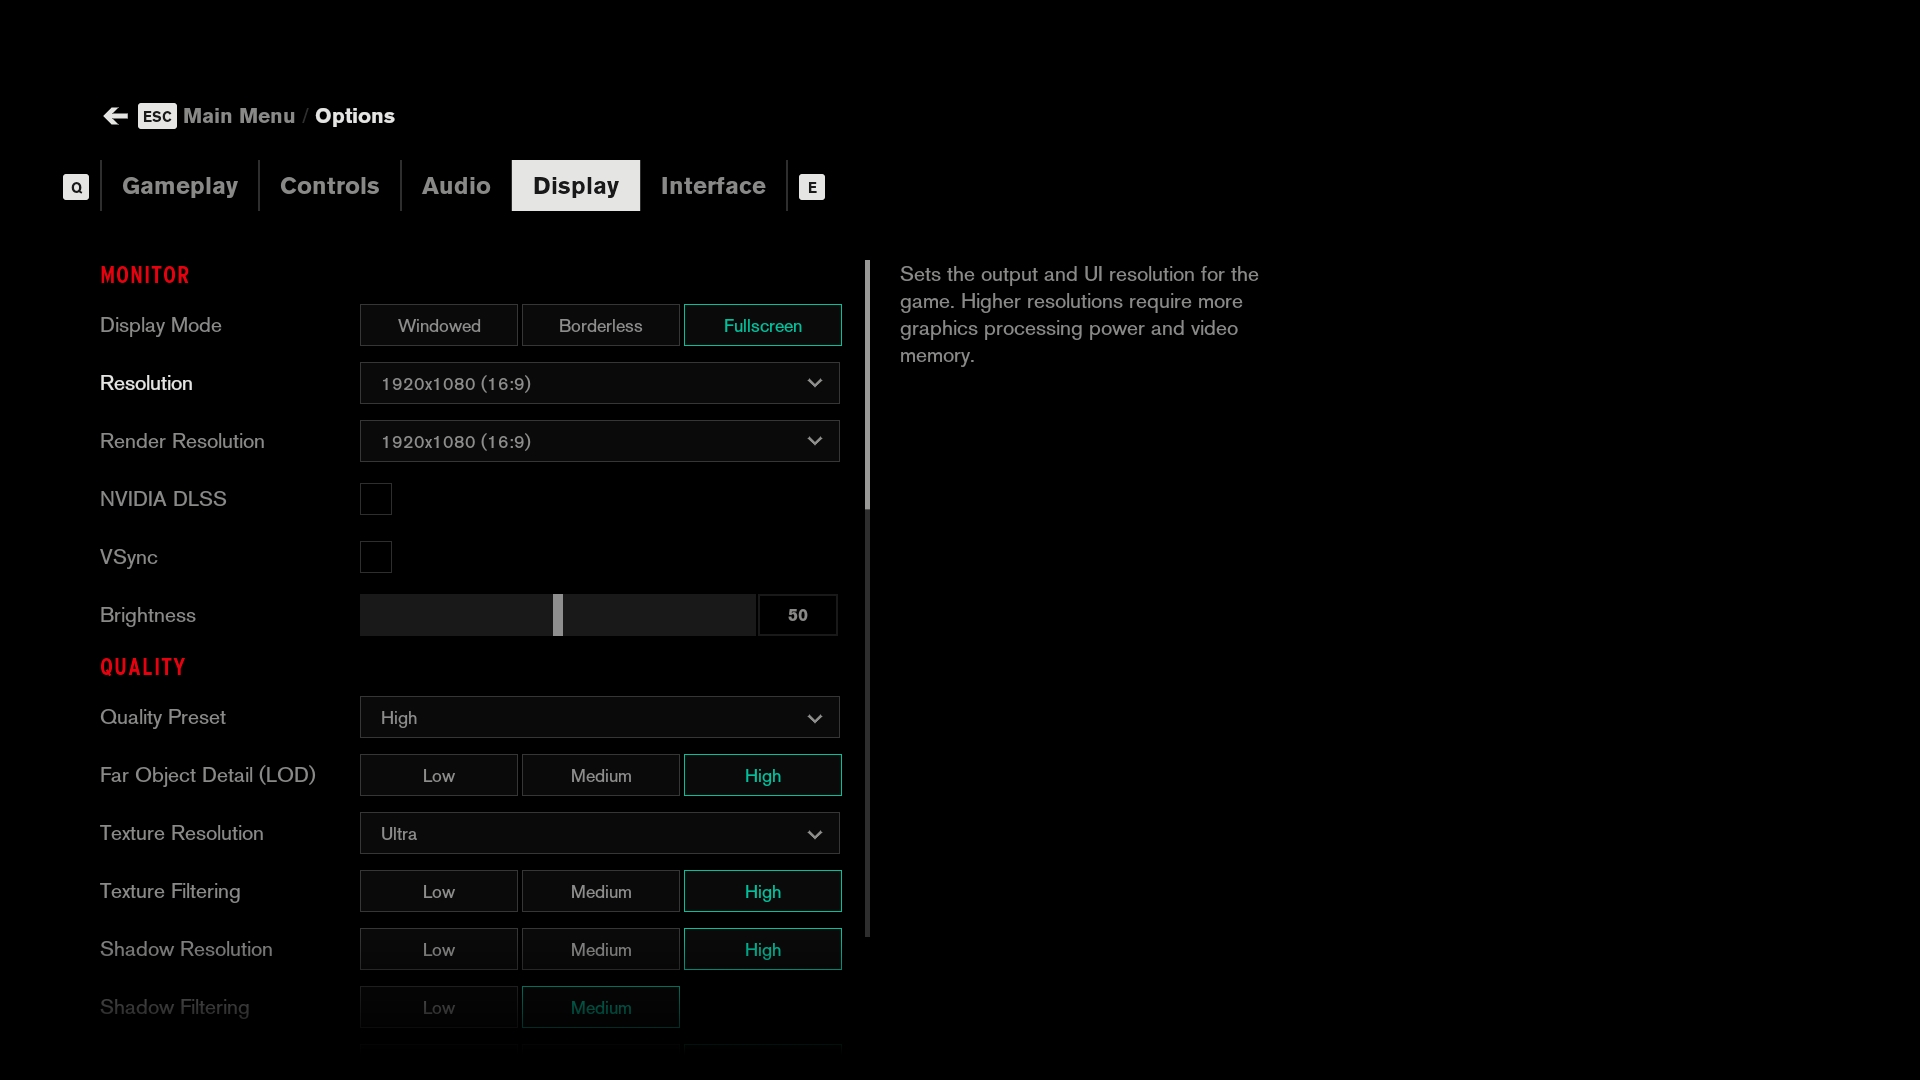
Engine: AnvilNext 2.0. We test using the Ultra High preset, DX12 API.
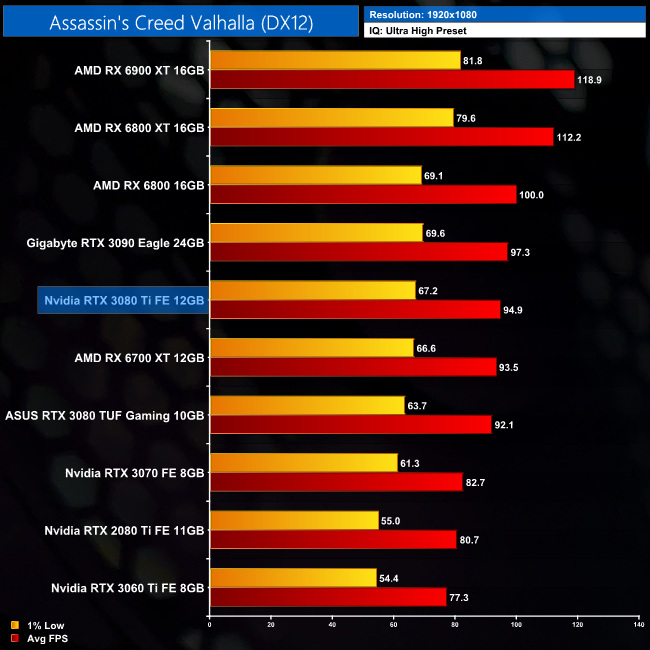
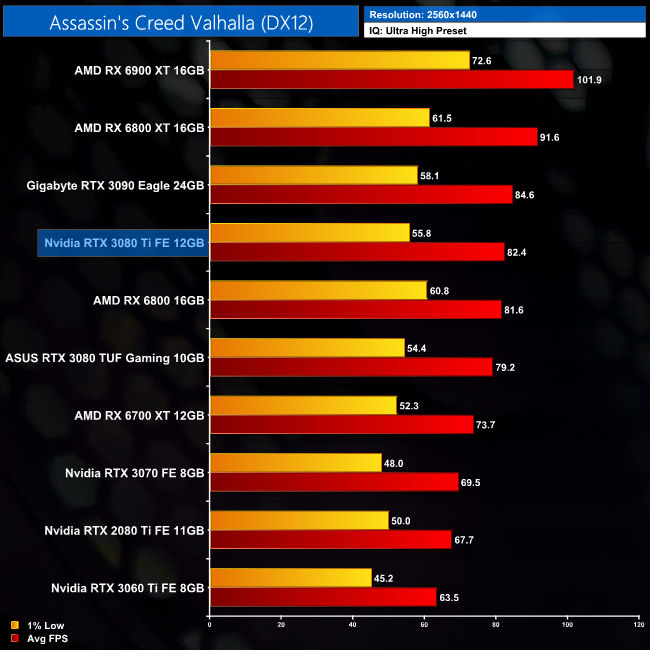
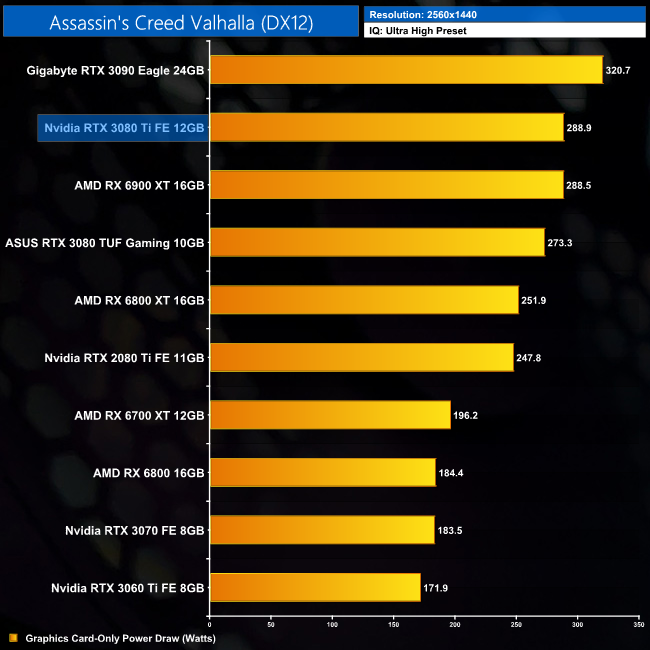
Our first game of the day is Ubisoft's Assassin's Creed Valhalla. This is a title with a clear preference for AMD hardware, with the RX 6800 XT faster than even the RTX 3090 at 1440p. We can, however, see a very small difference between the RTX 3080 Ti and RTX 3090, with the Ti card coming in around 3% slower.
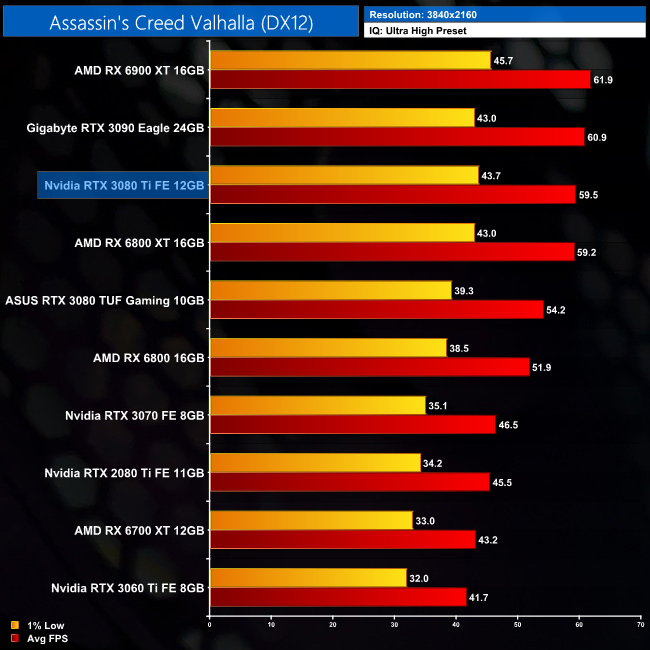
Up at 4K, the Nvidia GPUs do fare better against AMD, though the RX 6900 XT is still the fastest GPU in this title. The RTX 3080 Ti averaged 59.5FPS, putting it fractionally behind the RTX 3090, though I don't think you'd notice the difference in the real world.
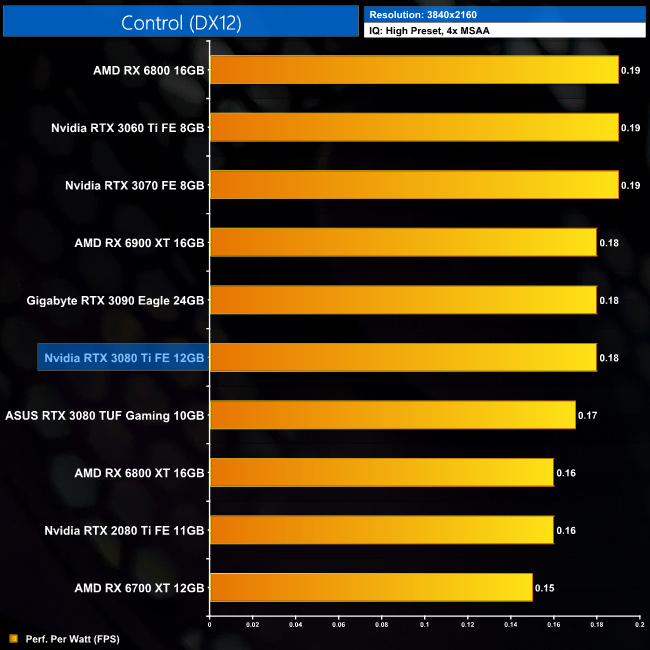
Control is an action-adventure video game developed by Remedy Entertainment and published by 505 Games. Control was released on 27 August 2019 for Microsoft Windows, PlayStation 4, and Xbox One. (Wikipedia).
Engine: Northlight Engine. We test using the High preset, with 4x MSAA, DX12 API.
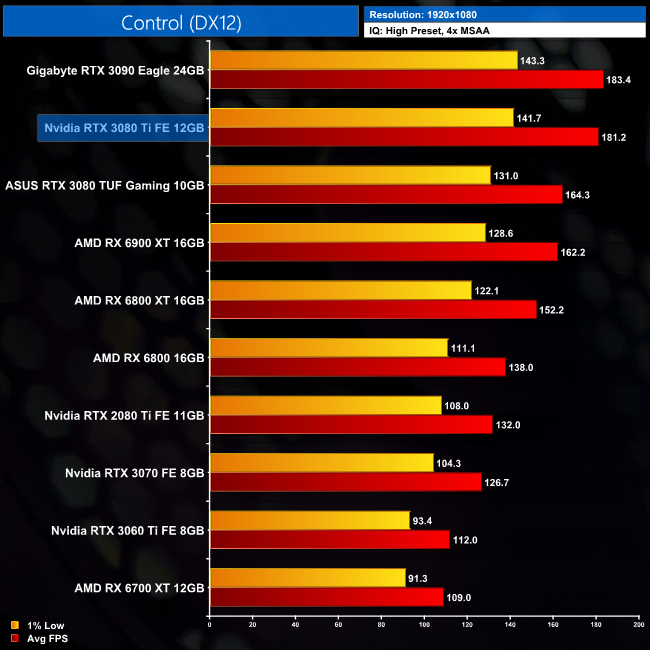
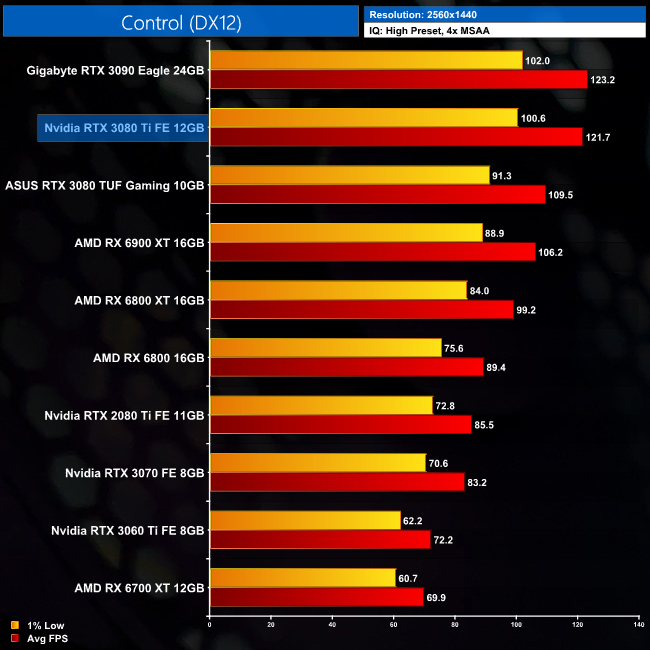
Control is the opposite to AC Valhalla, as it is an Nvidia-sponsored title and Team Green GPUs fare significantly better than Team Red. At 1440p for instance, the RTX 3080 Ti is 15% faster than the RX 6900 XT, while we see an 11% bump over the RTX 3080. That means it's right behind the RTX 3090, with barely a percentage point difference between the two.
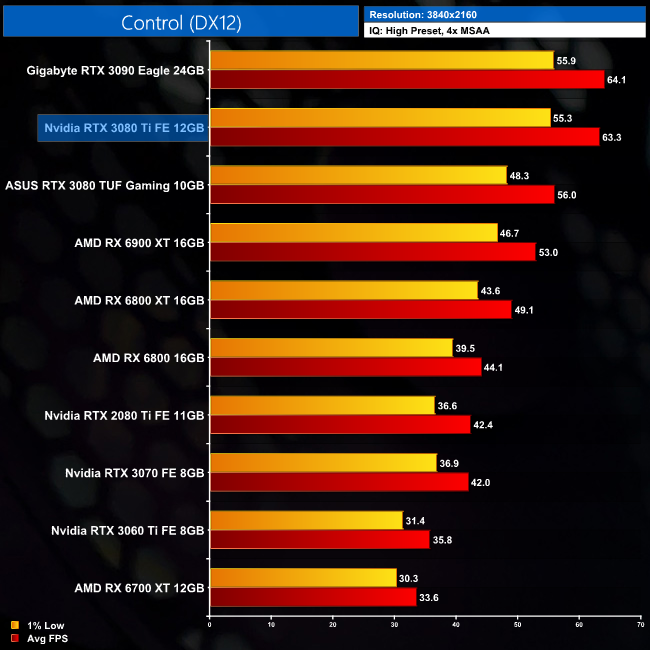
The same goes for 4K, where the 3080 Ti is almost 20% faster than the RX 6900 XT. It really is basically on par with the RTX 3090 as well, with less than a 1FPS difference when looking at both the 1% lows at average frame rate.
Cyberpunk 2077 is a 2020 action role-playing video game developed and published by CD Projekt. The story takes place in Night City, an open world set in the Cyberpunk universe. Players assume the first-person perspective of a customisable mercenary known as V, who can acquire skills in hacking and machinery with options for melee and ranged combat. Cyberpunk 2077 was released for Microsoft Windows, PlayStation 4, Stadia, and Xbox One on 10 December 2020. (Wikipedia).
Engine: REDengine 4. We test using the Ultra preset, DX12 API.
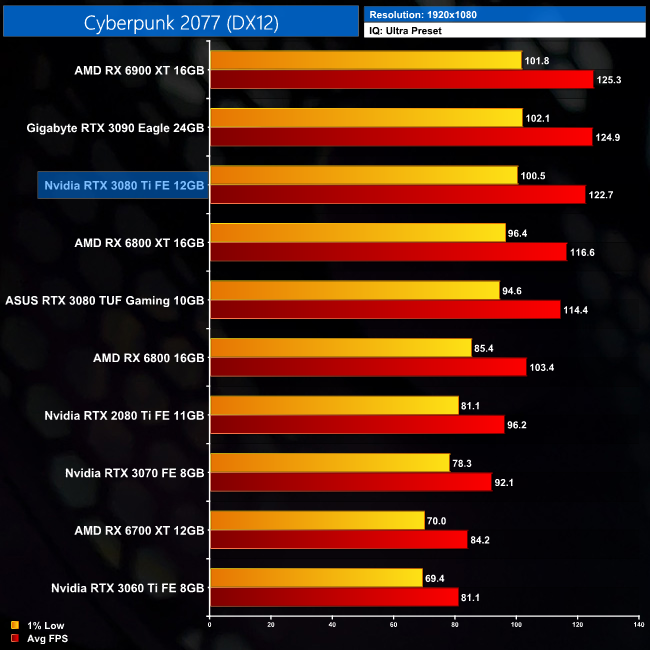
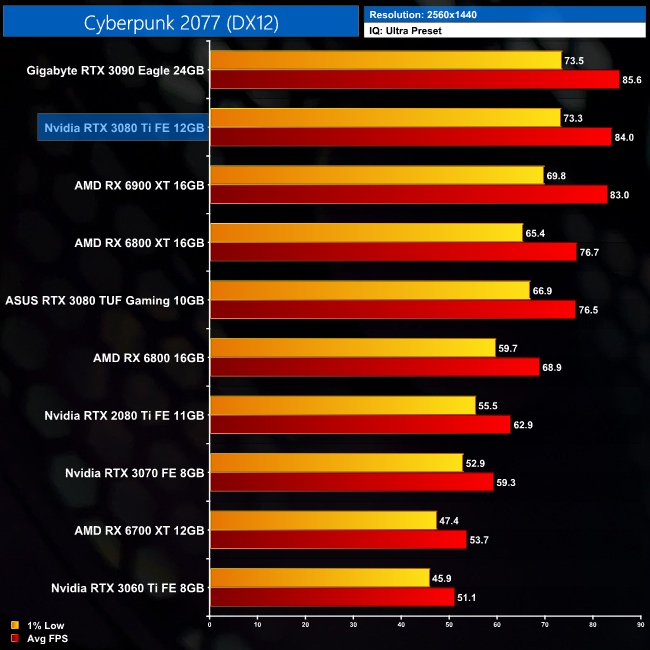
Next up is Cyberpunk 2077, where the RTX 3080 Ti averaged 84FPS at 1440p. That's fractionally ahead of the RX 6900 XT, and only 2% behind the RTX 3090, so it's certainly a case of fine margins.
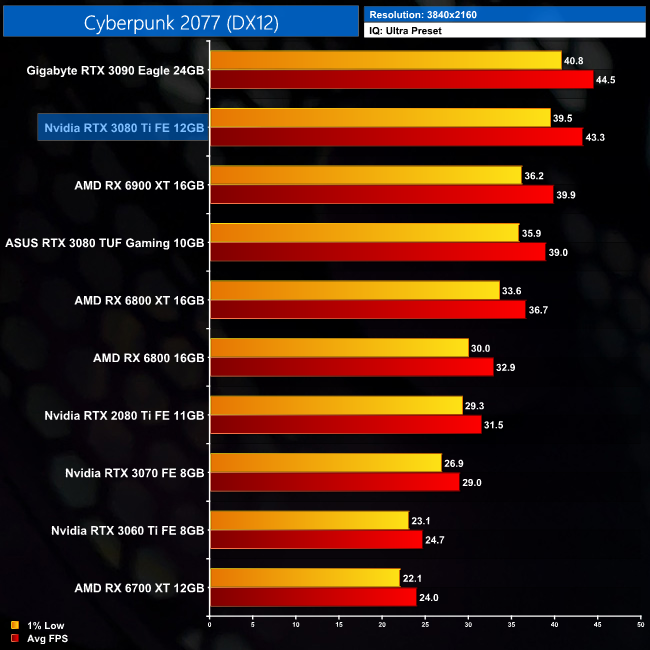
Up at 4K, the difference between the RTX 3080 Ti and RTX 3090 does widen… but only to 3%, and that's actually the biggest difference between these two cards we will see today. The 3080 Ti is also now 9% faster than the RX 6900 XT.
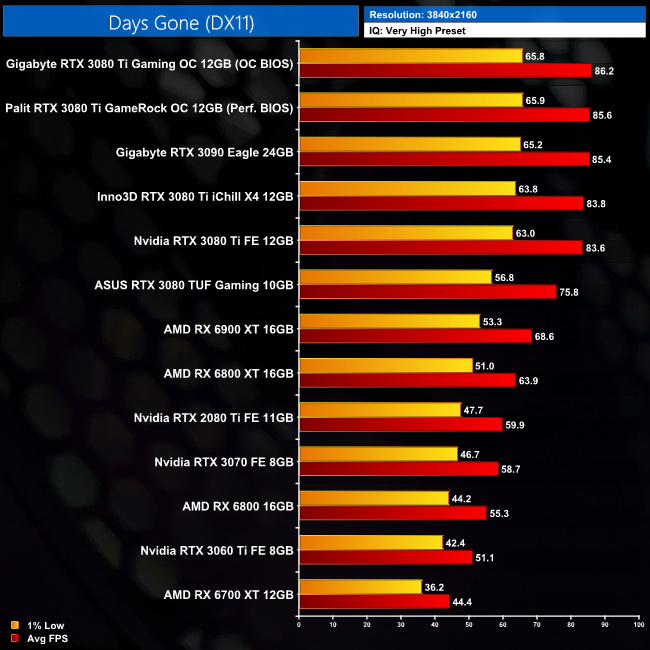
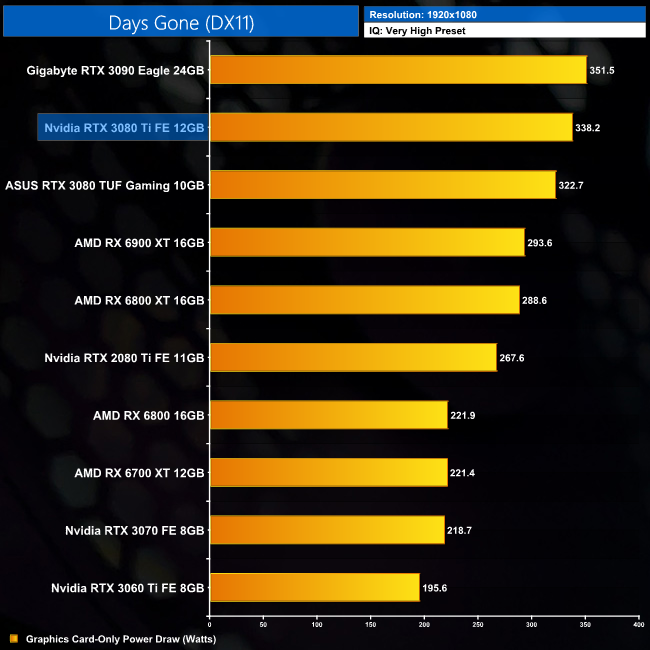
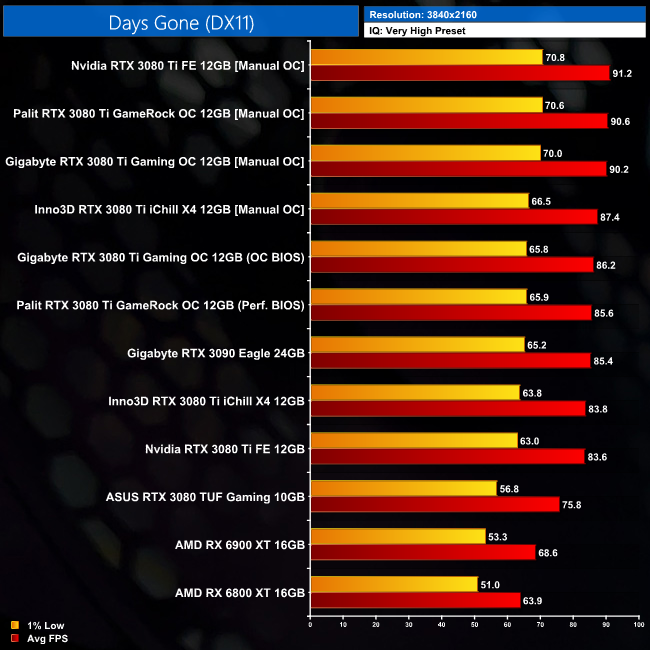
Days Gone is a 2019 action-adventure survival horror video game developed by Bend Studio and published by Sony Interactive Entertainment for the PlayStation 4 and Microsoft Windows. As part of Sony's efforts to bring more of its first-party content to Microsoft Windows following Horizon Zero Dawn, Days Gone released on Windows on May 18, 2021. (Wikipedia).
Engine: Unreal Engine 4. We test using the Very High preset, DX11 API.
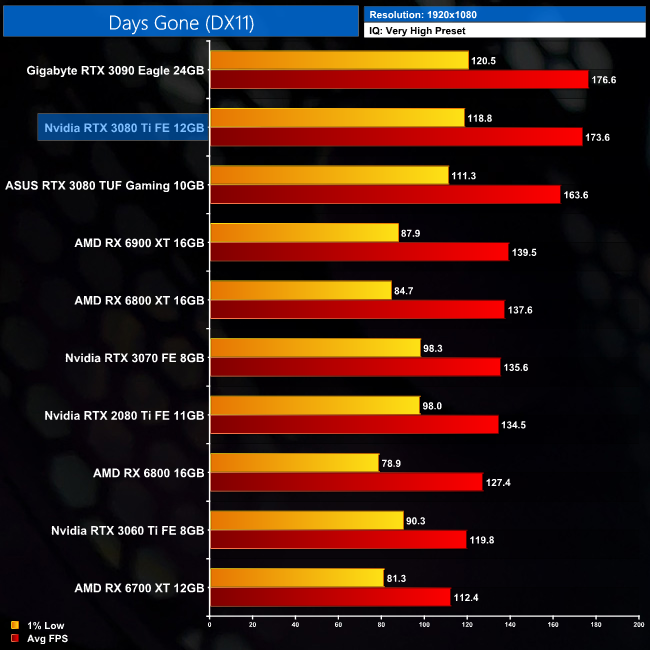
Days Gone is next, and this formerly PlayStation-exclusive title also prefers Nvidia hardware thanks to its use of Unreal Engine 4 and the DX11 API. At 1440p, the RTX 3080 Ti smokes the RX 6900 XT by 16%, while it's also 8% faster than the RTX 3080.
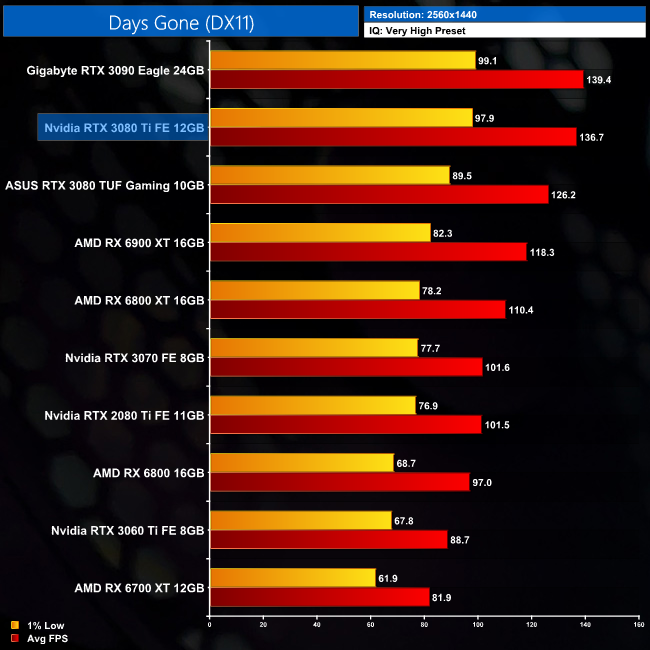
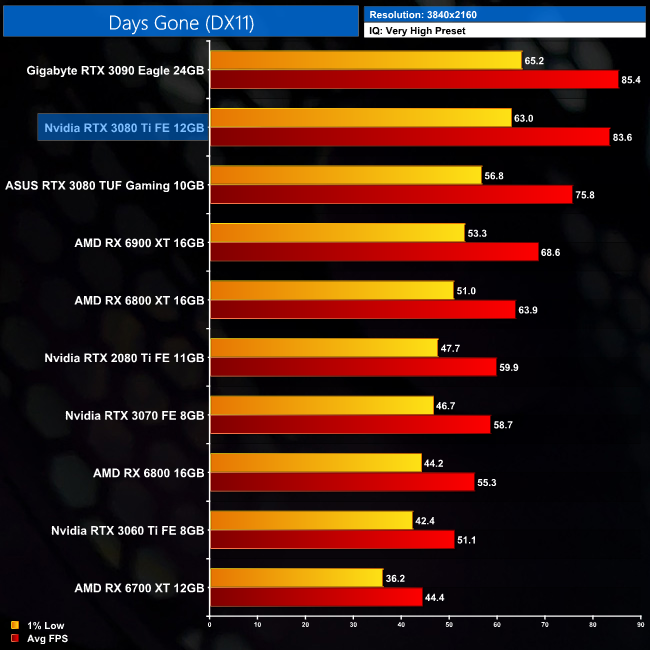
Up at 4K, the picture gets worse for AMD, as the 3080 Ti is a huge 22% faster than the 6900 XT thanks to its average frame rate of 83.6FPS. Once more, that's only just behind the RTX 3090, with a 2% differential.
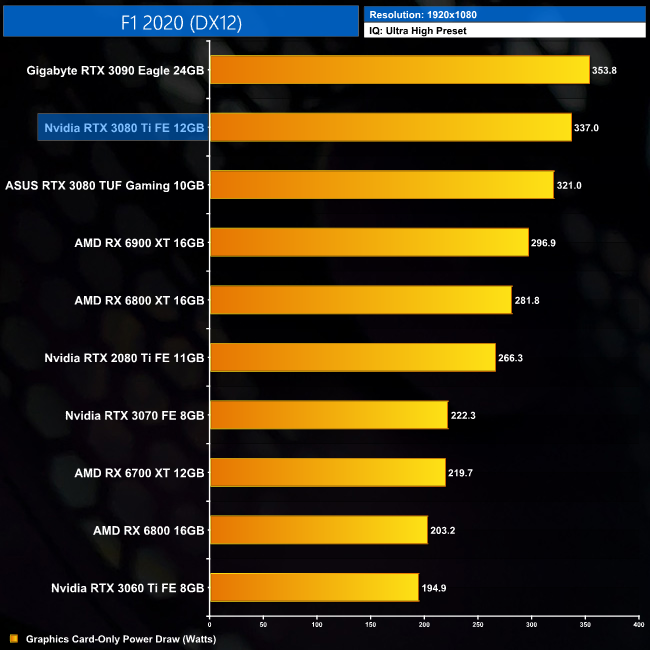
F1 2020 is the official video game of the 2020 Formula 1 and Formula 2 Championships developed and published by Codemasters. It is the thirteenth title in the Formula 1 series developed by the studio and was released on 7 July 2020 for pre-orders of the Michael Schumacher Edition and 10 July 2020 for the Seventy Edition on Microsoft Windows, PlayStation 4, Xbox One. (Wikipedia).
Engine: EGO. We test using the Ultra High preset, DX12 API.
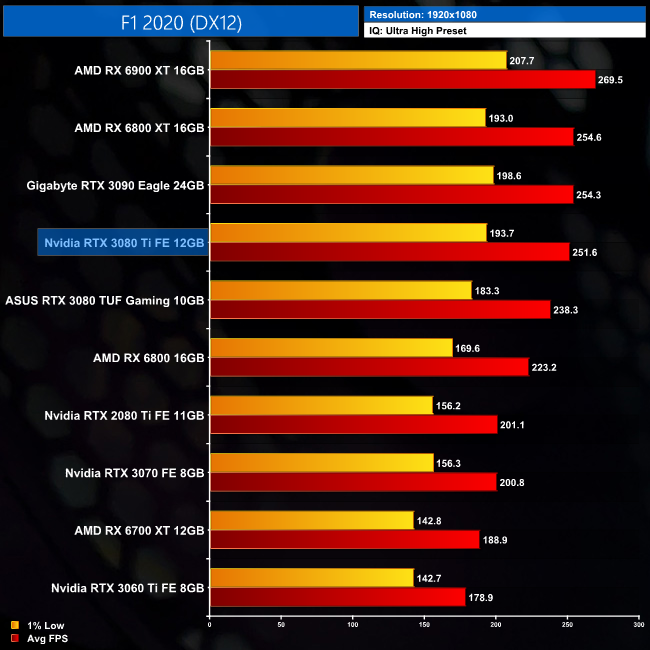
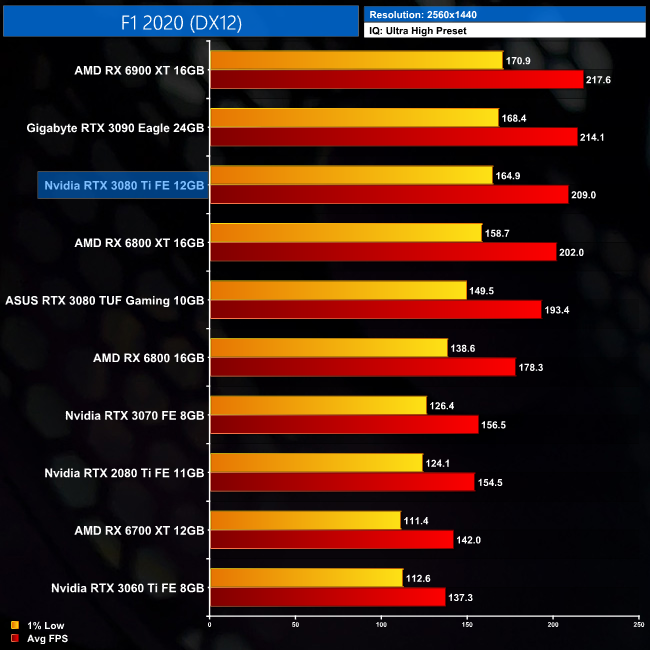

As for F1 2020, the RTX 3080 Ti is slower than the RX 6900 XT here, by a 4% margin at 1440p, though this does shrink to less than a single percent at 4K.
Compared to the RTX 3090, it's another case of very fine margins, as the RTX 3080 Ti is barely 2% slower at 1440p, and just 3% slower at 4K.
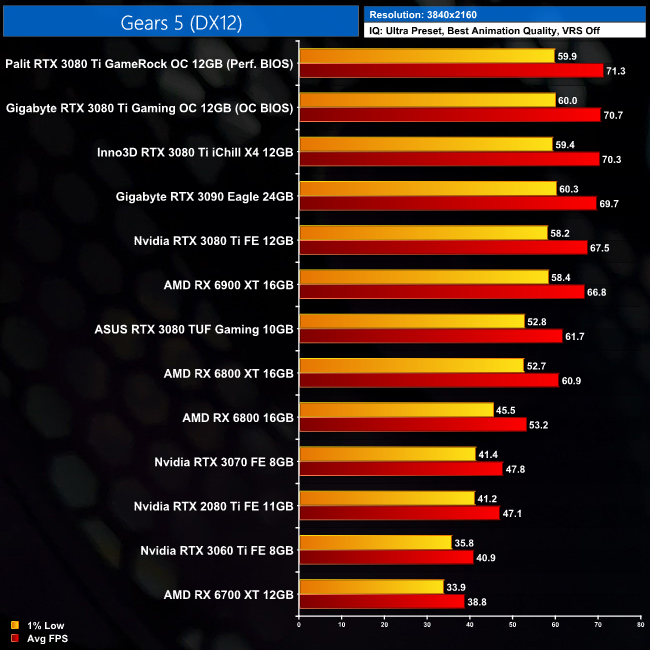
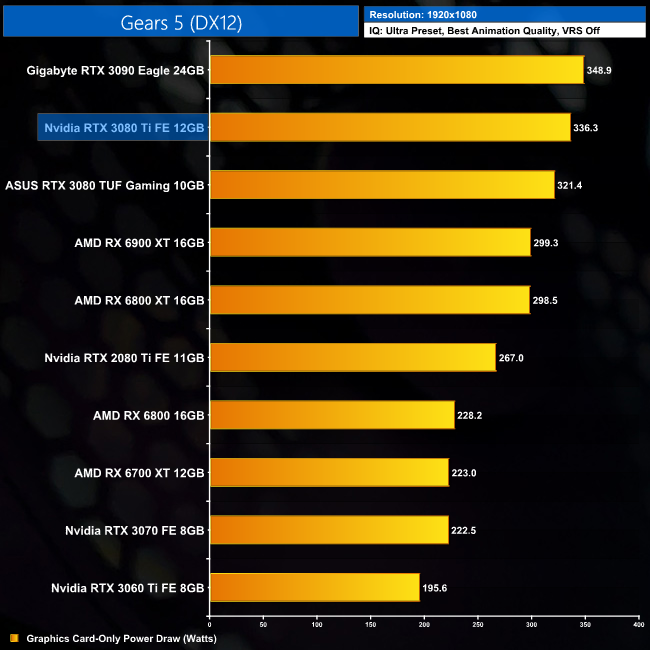
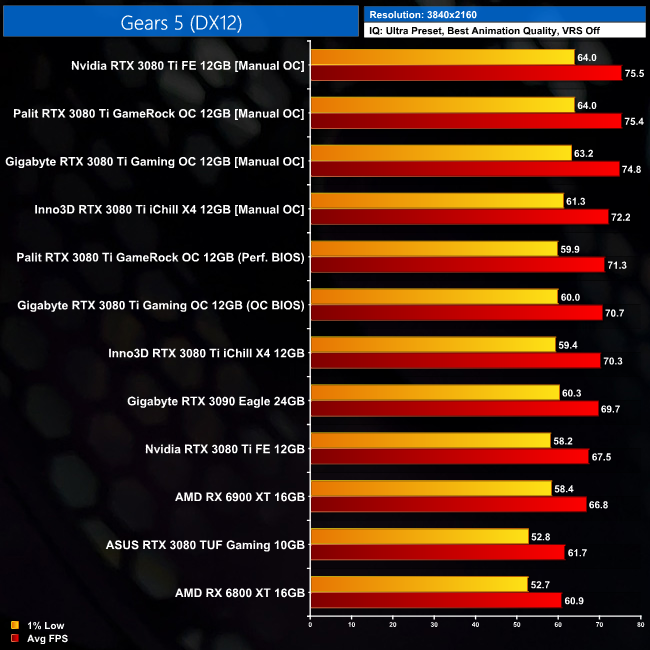
Gears 5 is a third-person shooter video game developed by The Coalition and published by Xbox Game Studios for Xbox One, Microsoft Windows and Xbox Series X. It is the fifth installment of the Gears of War series and the sequel to Gears of War 4. The ultimate edition was released on September 6, 2019, while the standard edition of the game was released worldwide on September 10, 2019. (Wikipedia).
Engine: Unreal Engine 4. We test using the Ultra preset, with Best Animation Quality (instead of Auto), VRS disabled, DX12 API.
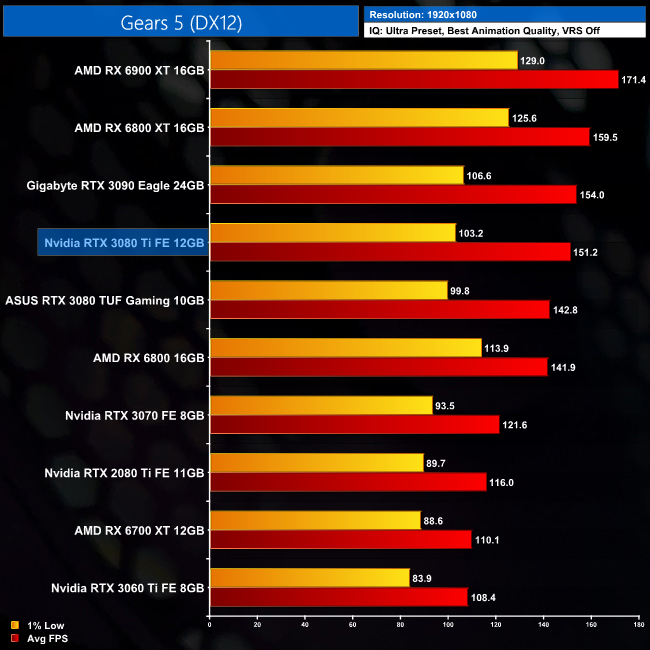
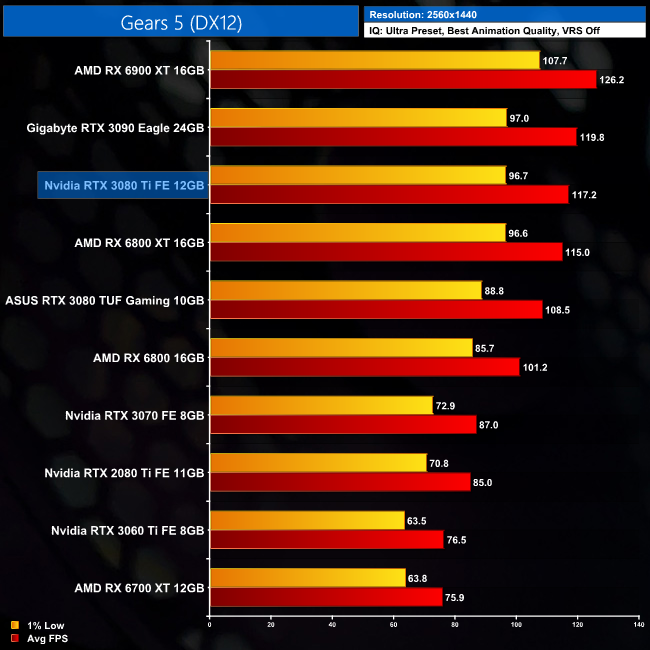
Gears 5, meanwhile, sees the RX 6900 XT take top spot at 1440p, where the RTX 3080 Ti is 7% slower, though it also 8% faster than the RTX 3080.
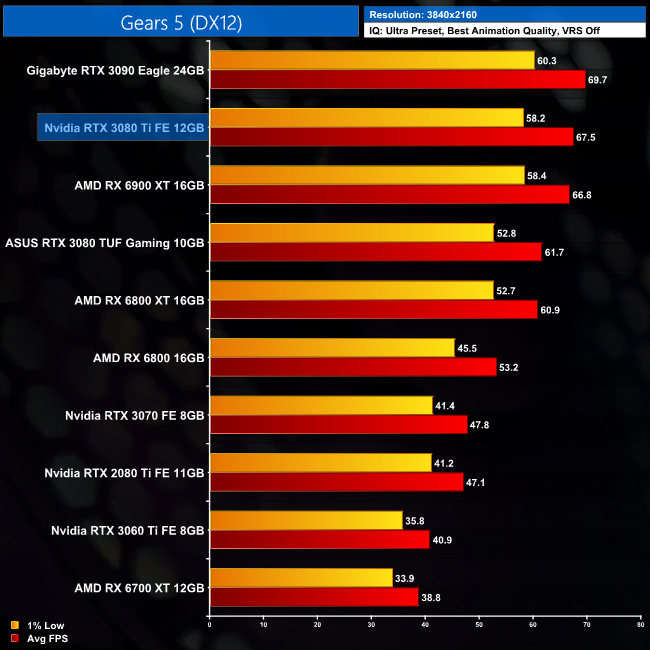
Compared to the RTX 3090 though, a clear pattern is emerging, as there's only 2% between the two cards at 1440p, while this increases to just 3% at 4K resolution.
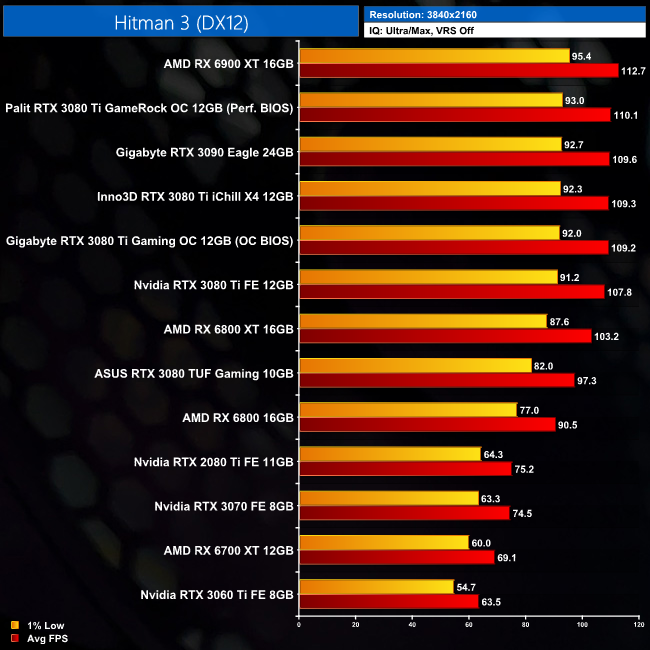
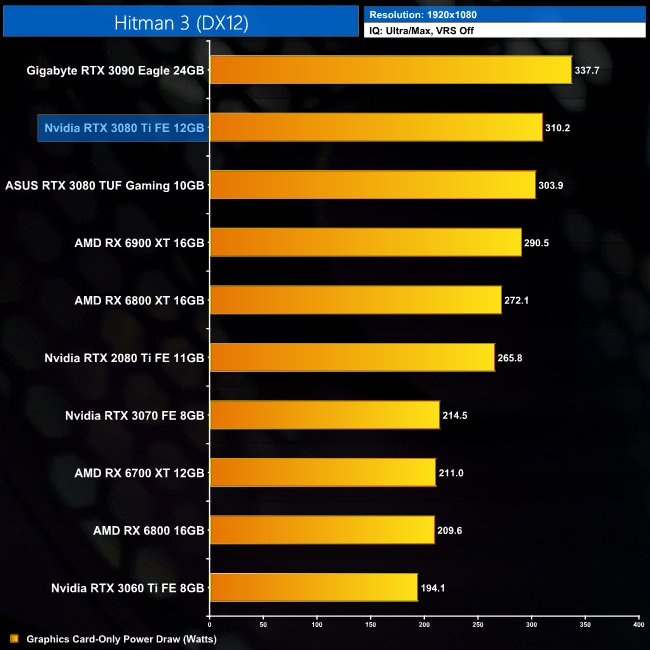
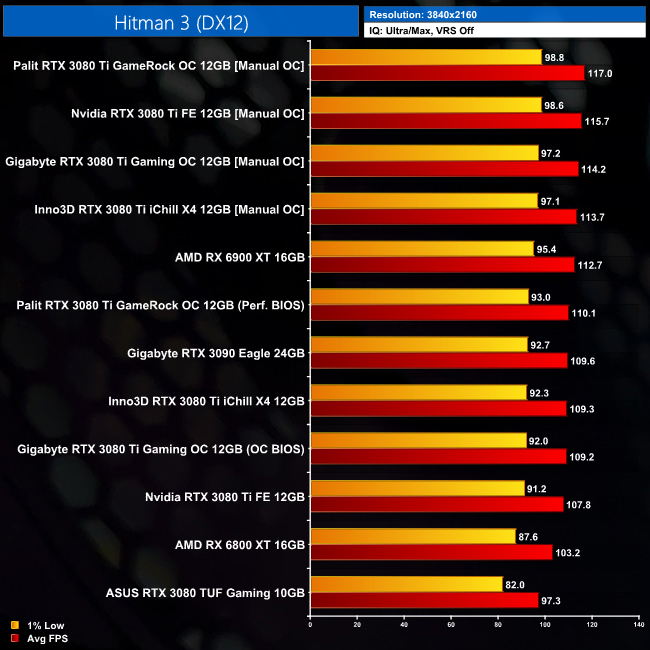
Hitman 3 (stylized as HITMAN III) is a stealth game developed and published by IO Interactive for Microsoft Windows, PlayStation 4, PlayStation 5, Xbox One, Xbox Series X/S, Stadia (under the title Hitman: World of Assassination), and Nintendo Switch on 20 January 2021. It is the eighth main installment in the Hitman series and the final entry in the World of Assassination trilogy, following Hitman (2016) and Hitman 2 (2018). (Wikipedia).
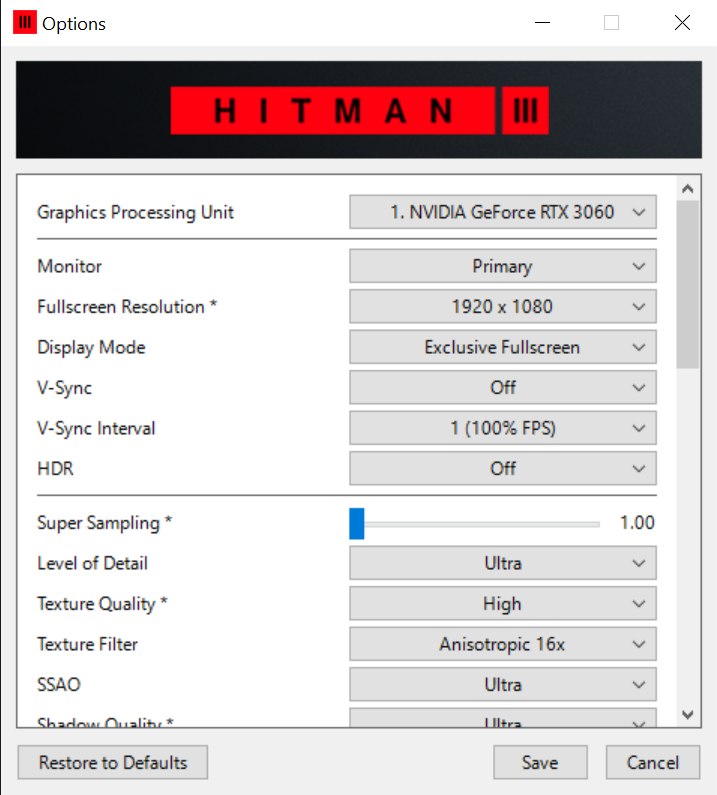
Engine: Glacier. We test using Ultra settings (or High where Ultra is not available), VRS off, DX12 API.
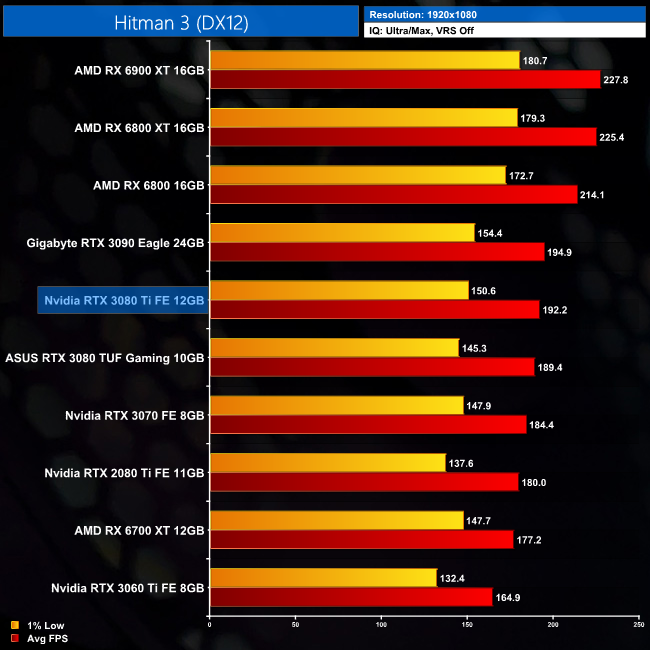
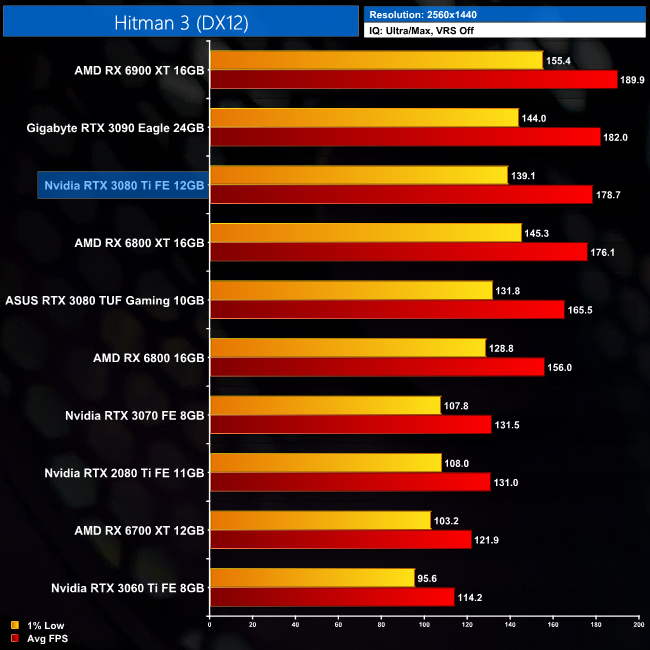
Next we come to IO Interactive's Hitman 3, and while not officially sponsored by AMD, Team Red's hardware does very well in this title. The RTX 3080 Ti for instance is 6% slower than the RX 6900 XT, and only just about faster than the RX 6800 XT when testing at 1440p. We can still see a minuscule difference between the 3080 Ti and 3090 however, with just 2% in it.
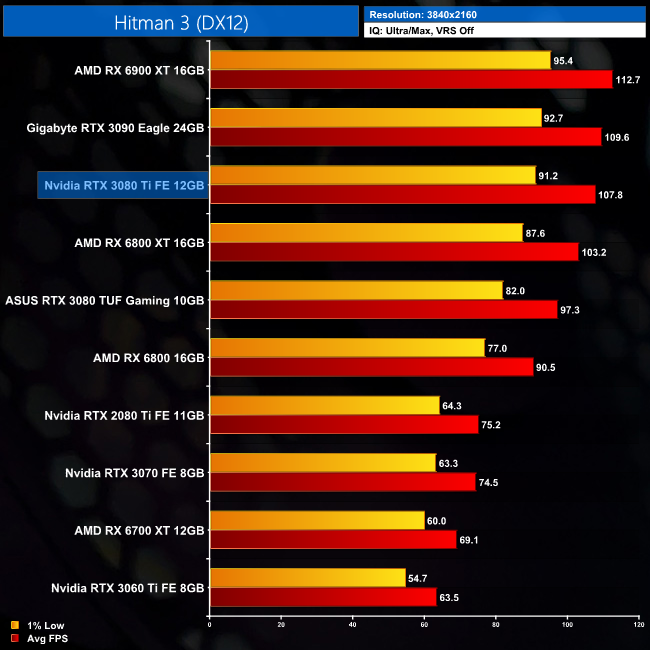
As for 4K, Ampere is stronger at this resolution but the RTX 3080 Ti is still 4% slower than the RX 6900 XT. The key takeaway though, is it's also just 2% slower than the RTX 3090, which is barely a 2FPS difference.
Horizon Zero Dawn is an action role-playing game developed by Guerrilla Games and published by Sony Interactive Entertainment. The plot follows Aloy, a hunter in a world overrun by machines, who sets out to uncover her past. It was released for the PlayStation 4 in 2017 and Microsoft Windows in 2020. (Wikipedia).
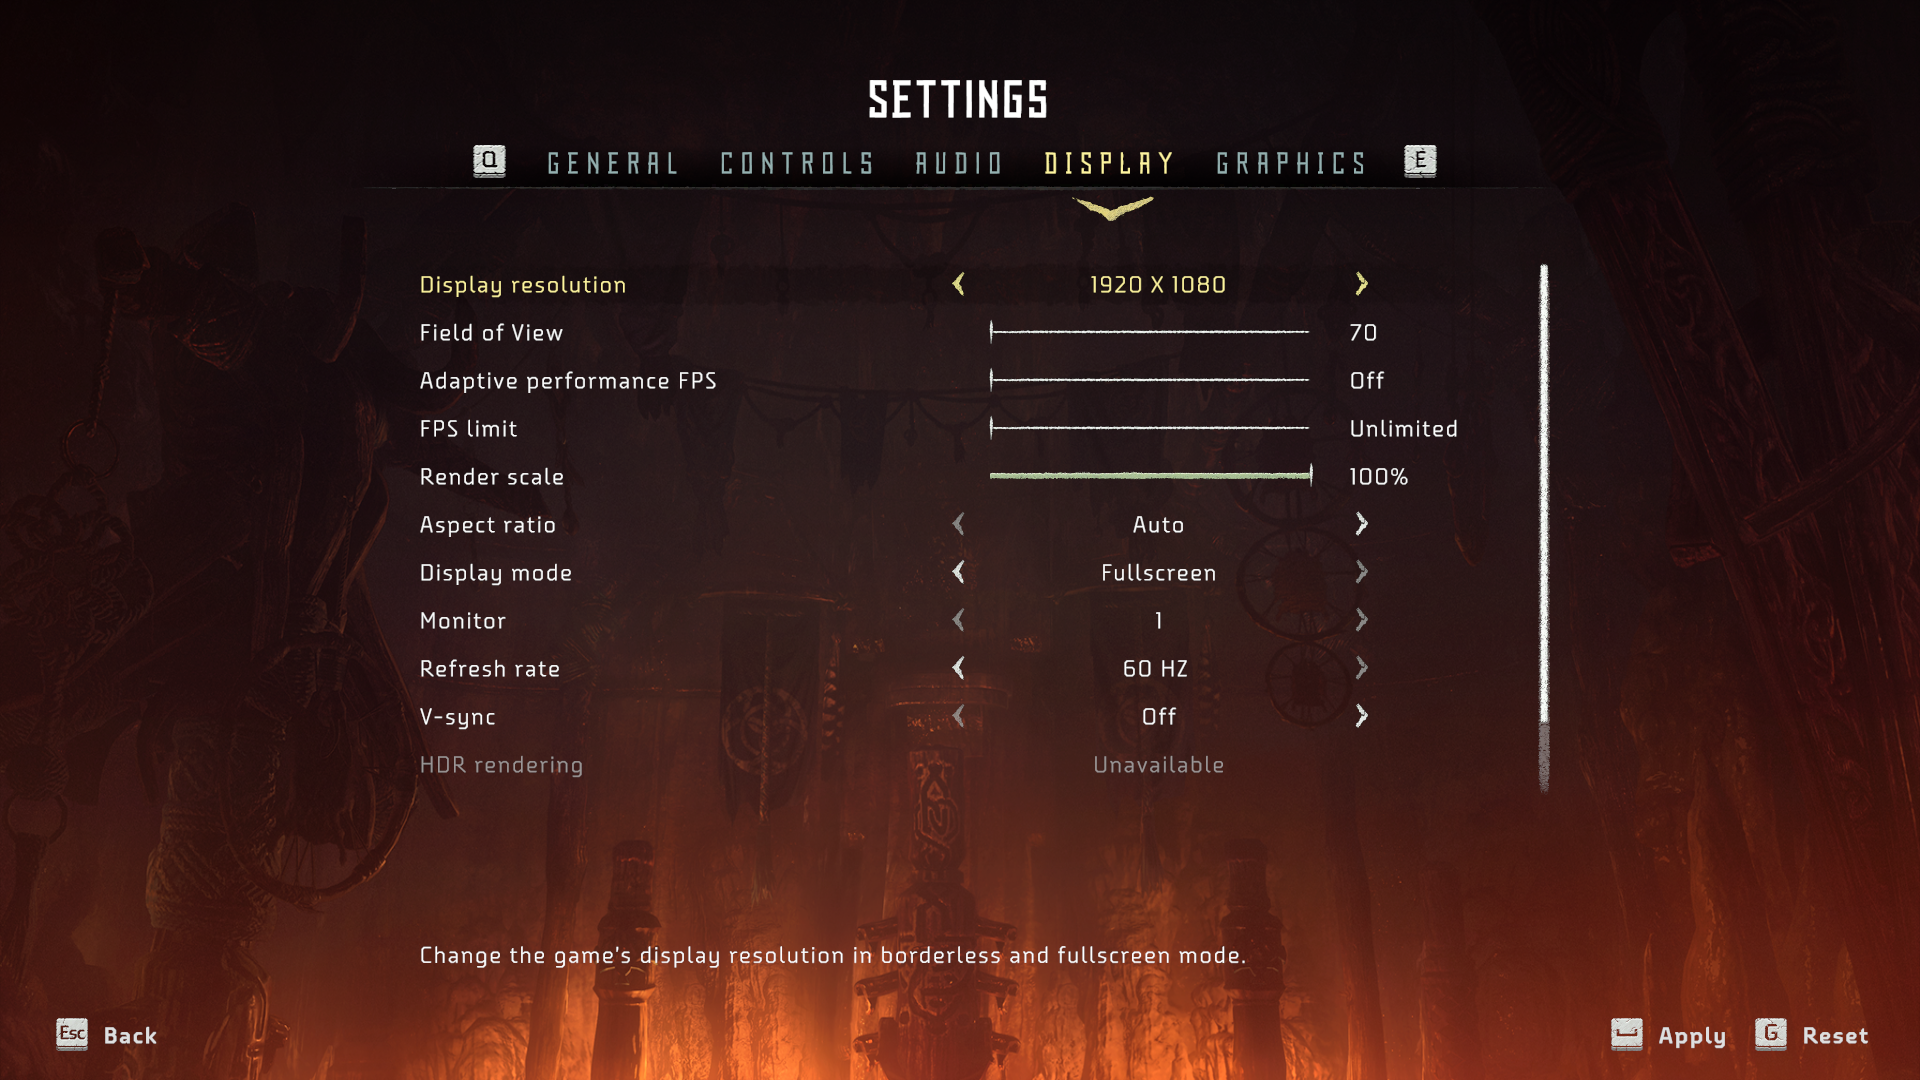
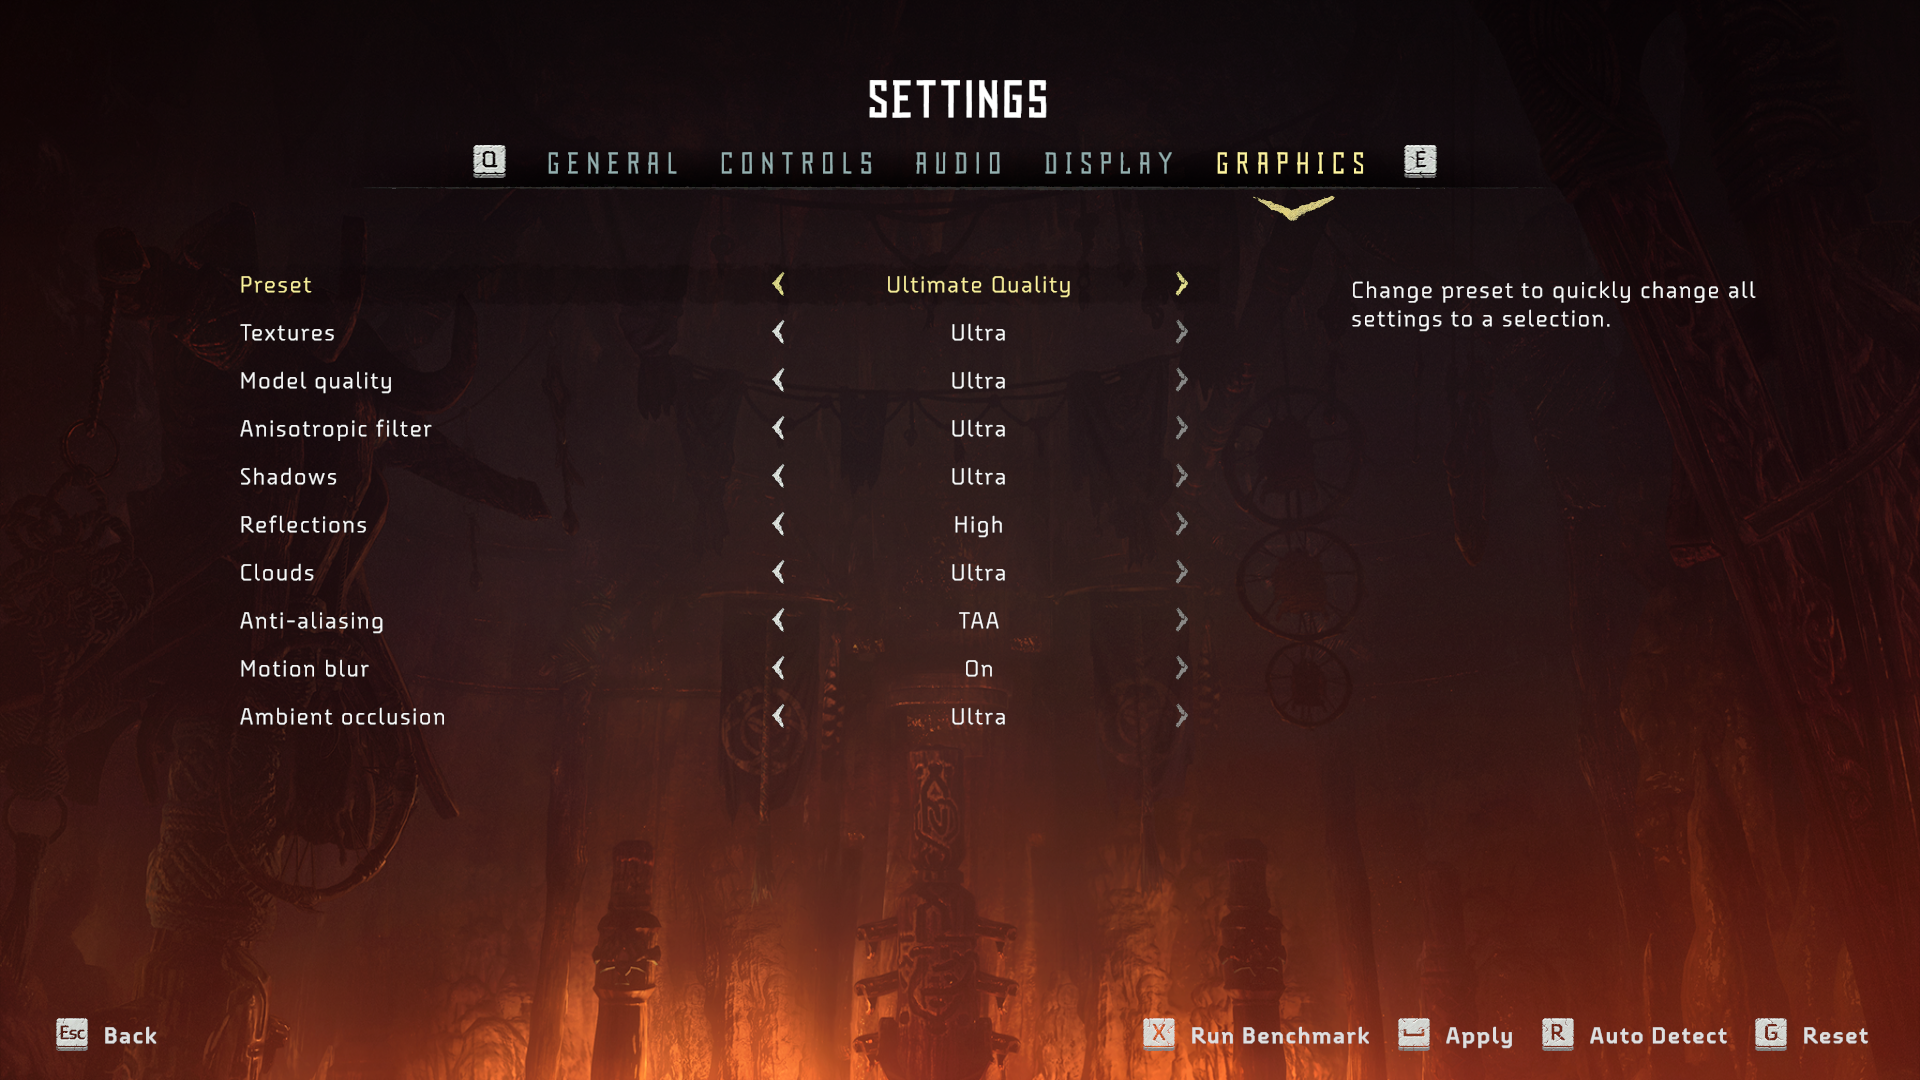
Engine: Decima. We test using the Ultimate Quality preset, DX12 API.
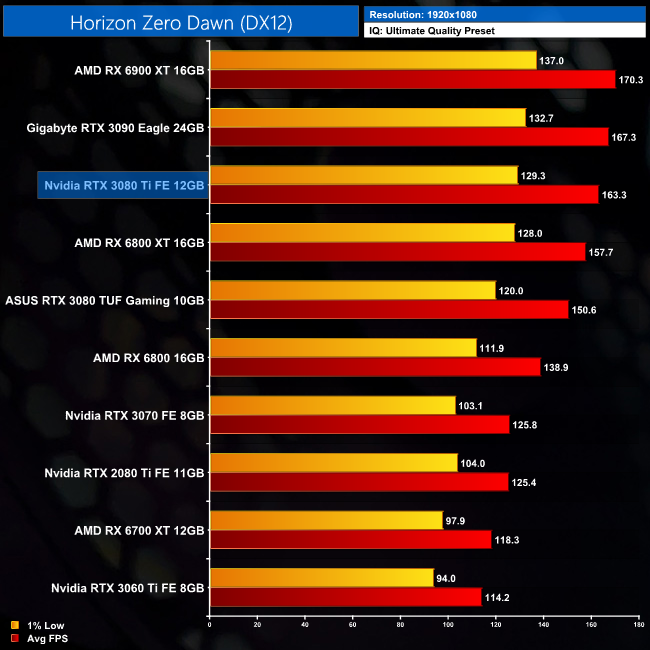
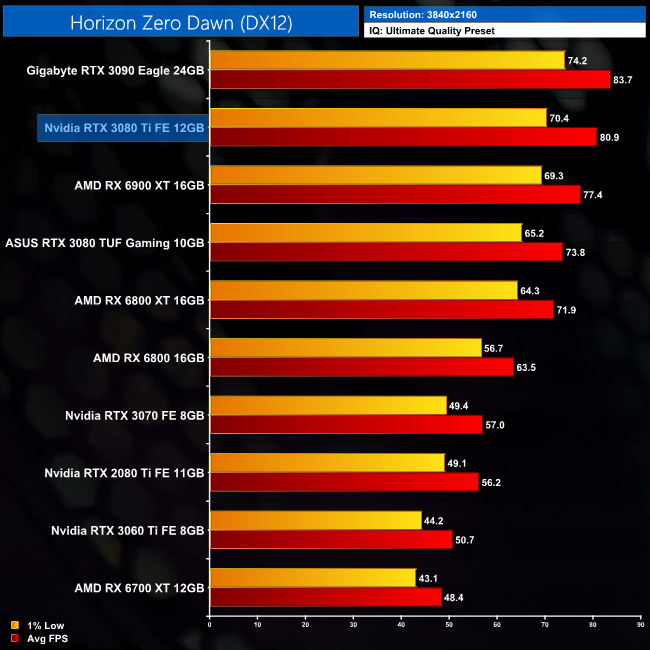
Horizon Zero Dawn is next, and this is another formerly PlayStation-exclusive title that we are looking at. At 1440p, the RTX 3080 Ti is 4% slower than the RX 6900 XT, while it offers an extra 9% over the RTX 3080. The all-important comparison against the RTX 3090 sees a difference of just 3%.
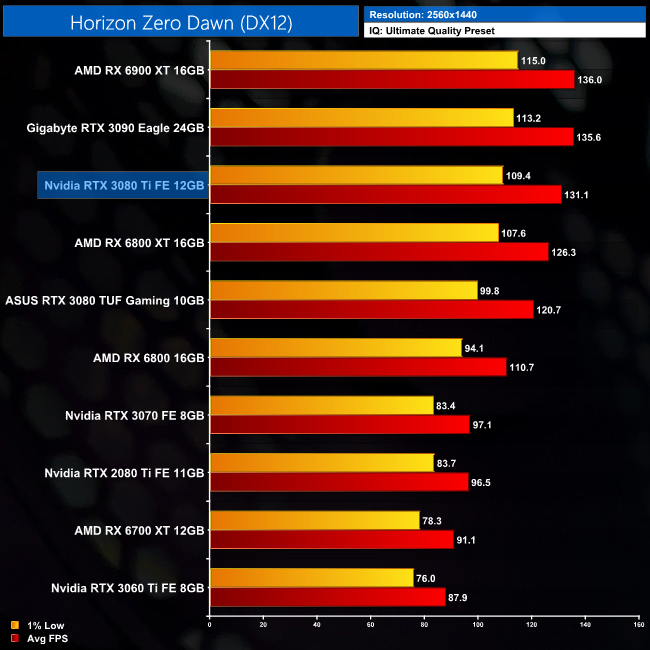
The same goes for 4K, where once again the RTX 3080 Ti is 3% slower than the RTX 3090. It's also now 5 % faster than the RX 6900 XT, giving it a 10% boost over the RTX 3080.
Red Dead Redemption 2 is a 2018 action-adventure game developed and published by Rockstar Games. The game is the third entry in the Red Dead series and is a prequel to the 2010 game Red Dead Redemption. Red Dead Redemption 2 was released for the PlayStation 4 and Xbox One in October 2018, and for Microsoft Windows and Stadia in November 2019. (Wikipedia).
Engine: Rockstar Advance Game Engine (RAGE). We test by manually selecting Ultra settings (or High where Ultra is not available), TAA, Vulkan API.
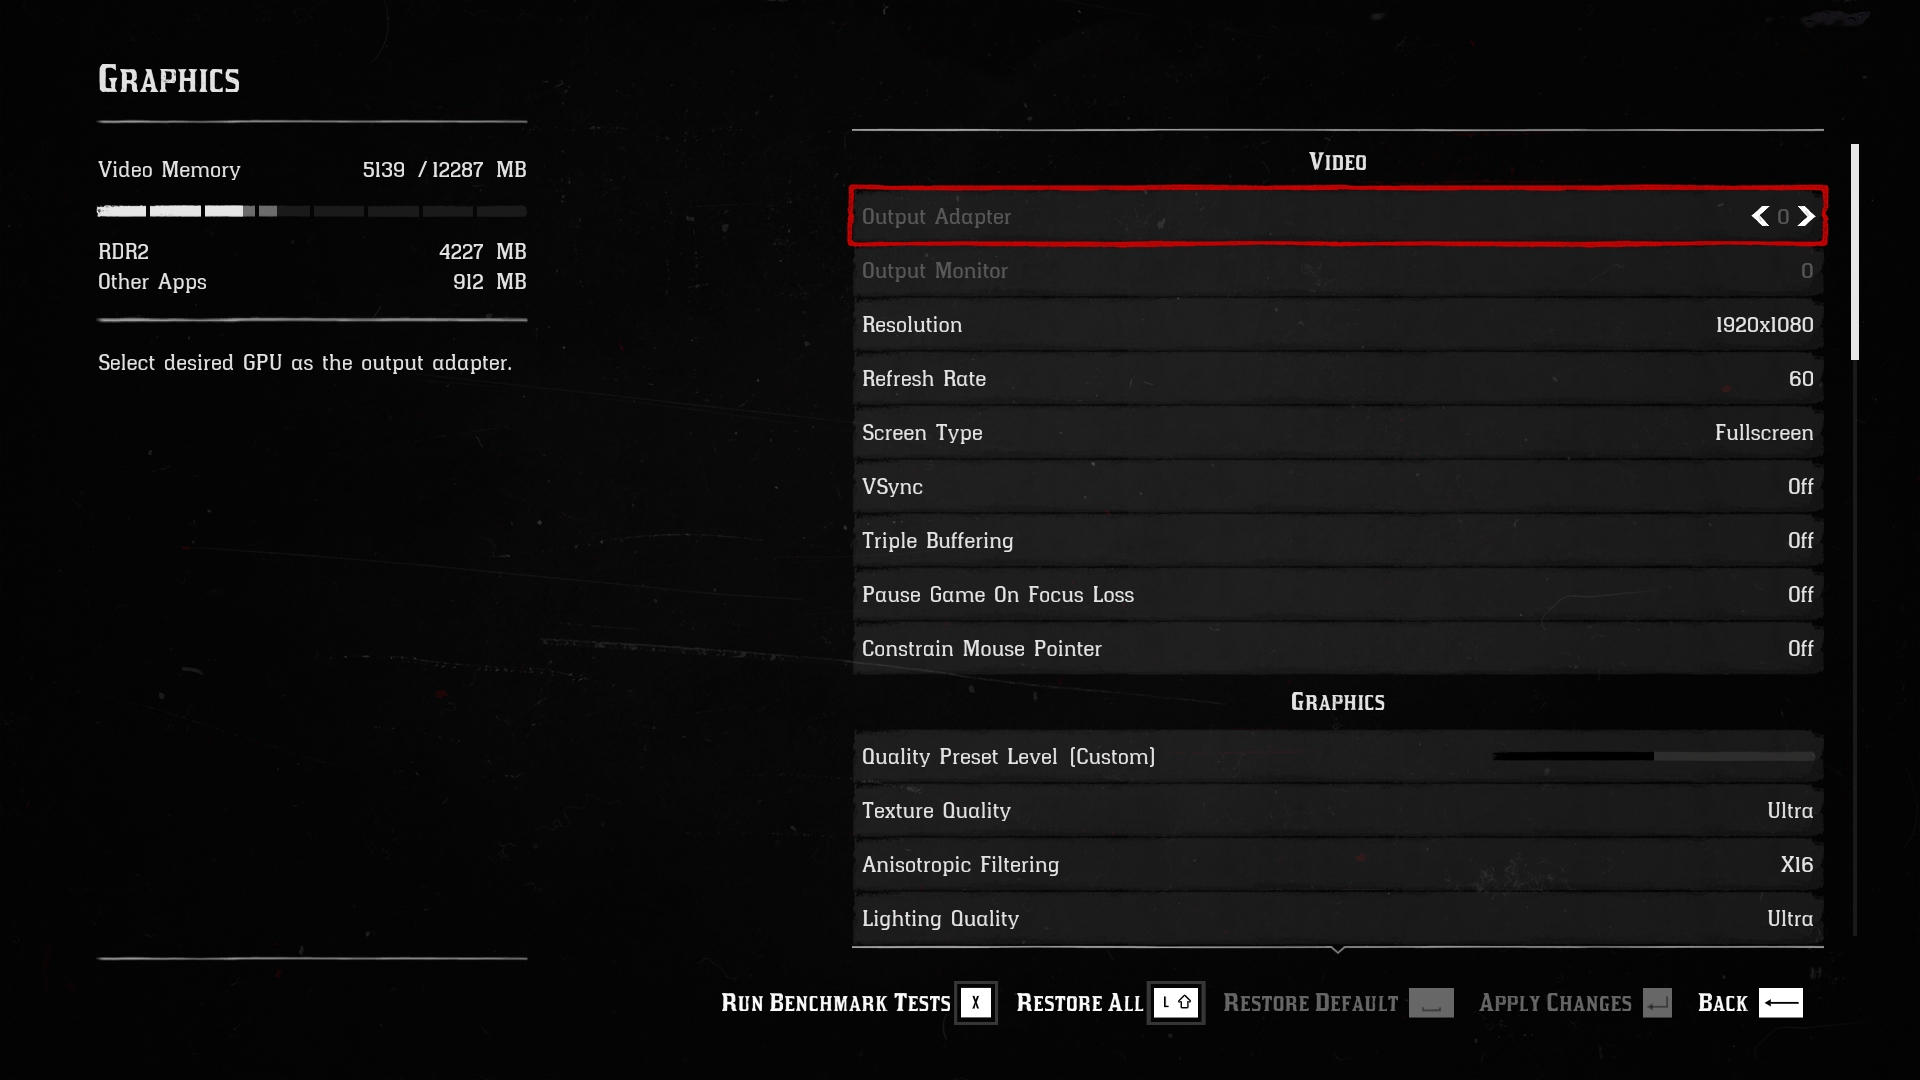
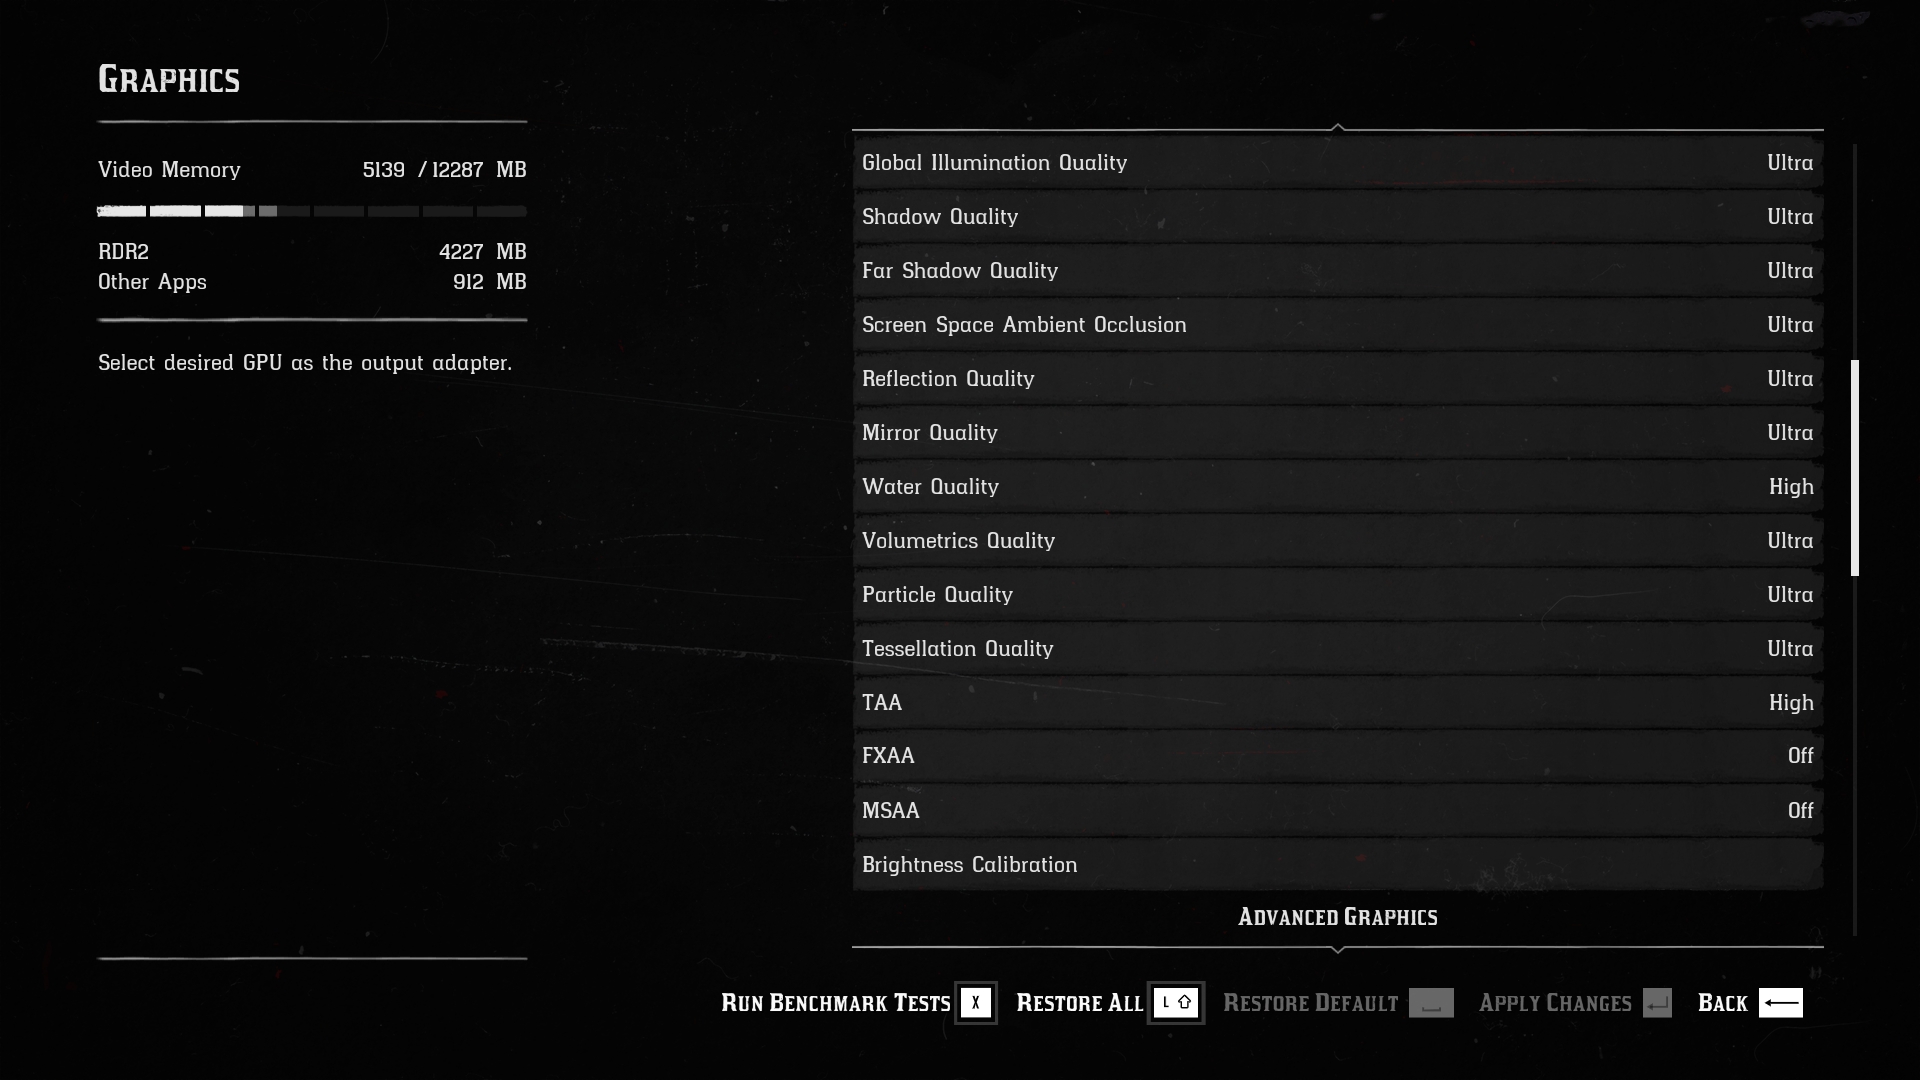
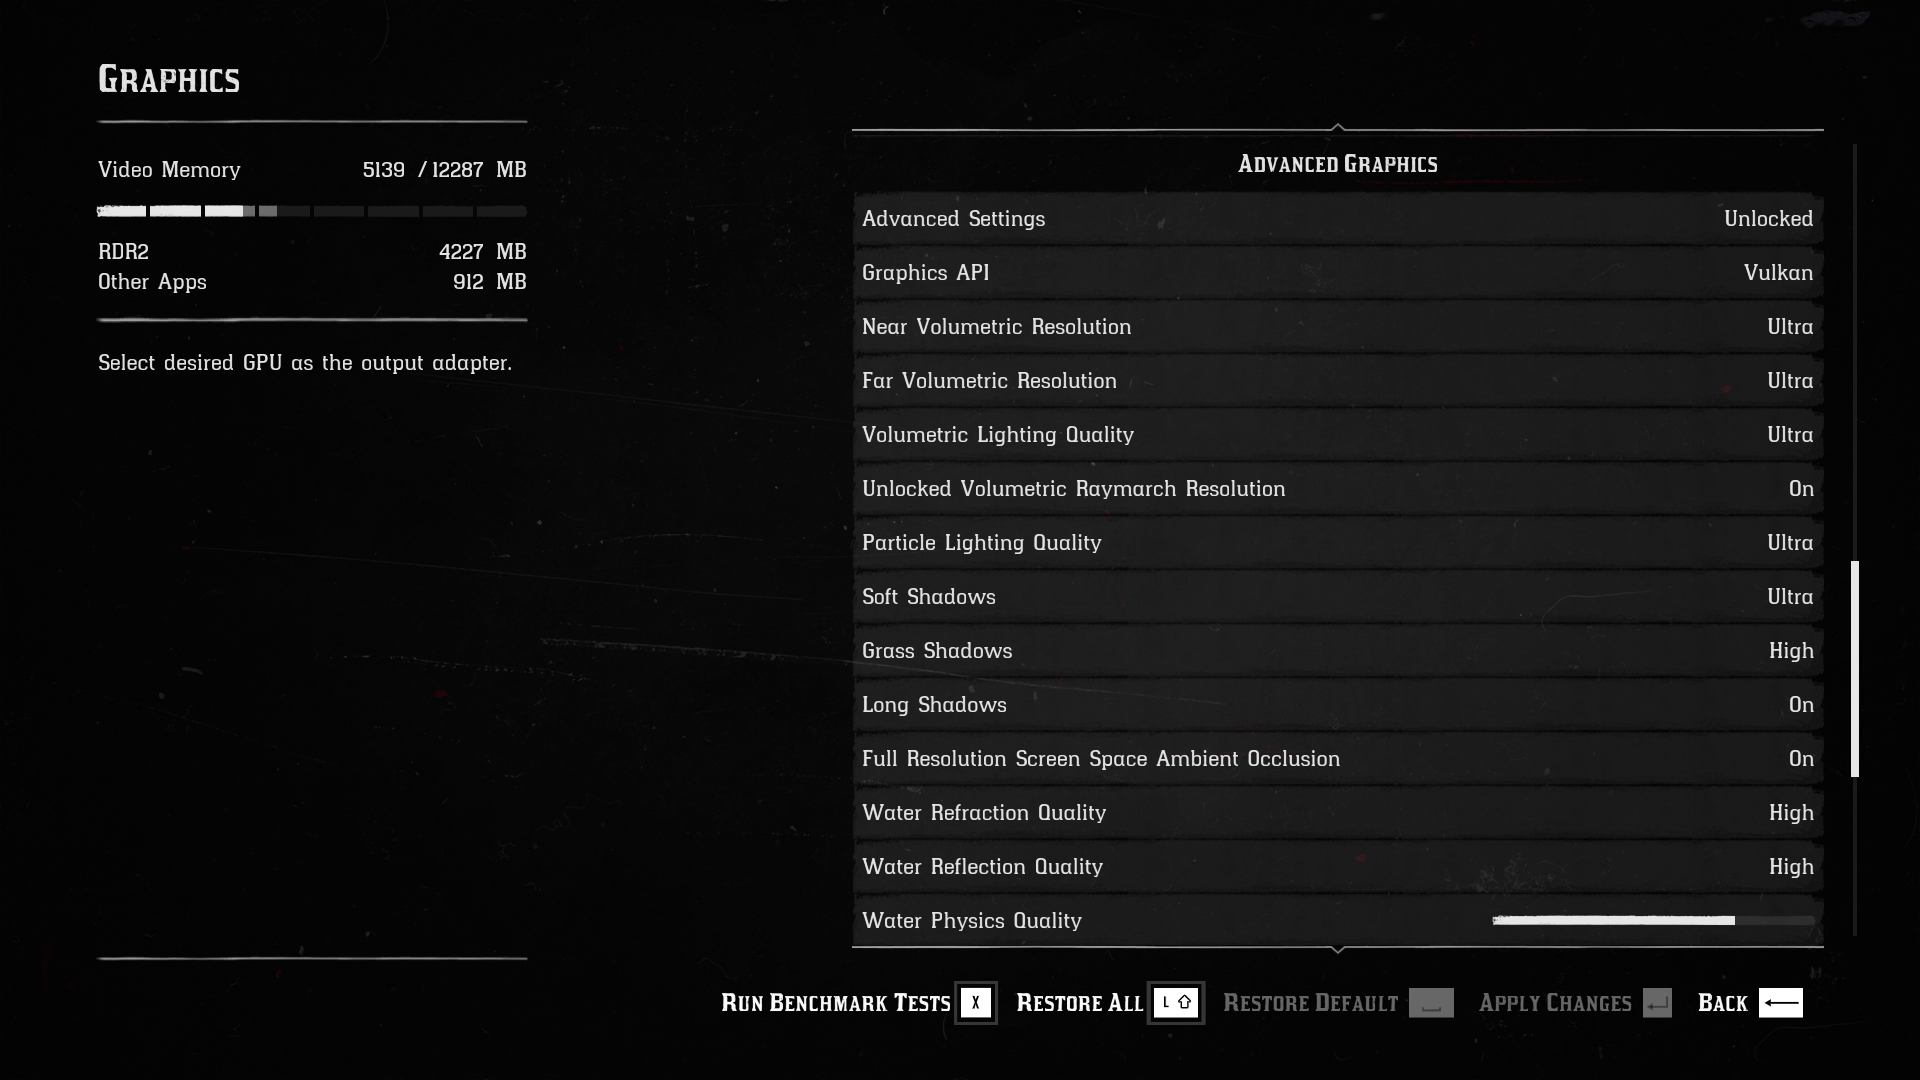
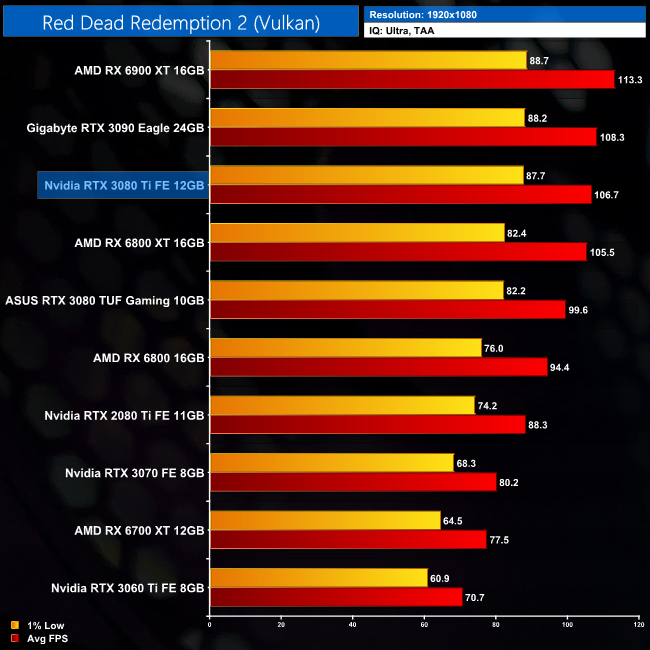

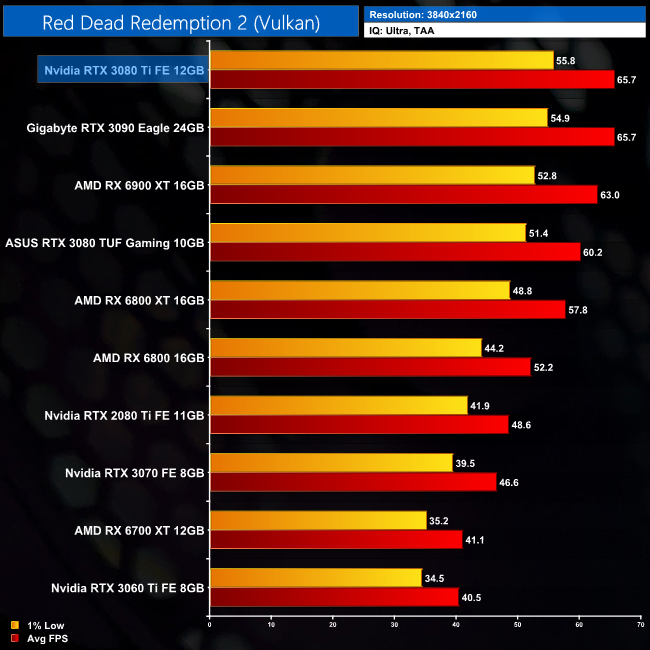
As for Red Dead Redemption 2, the differences between the RTX 3080 Ti and RTX 3090 are increasingly small in this title, to the point where we measured the same average frame rate between the two at 4K. This is the only game where this happened, but it does go to show we are talking about the finest of margins between the two Ampere GPUs.
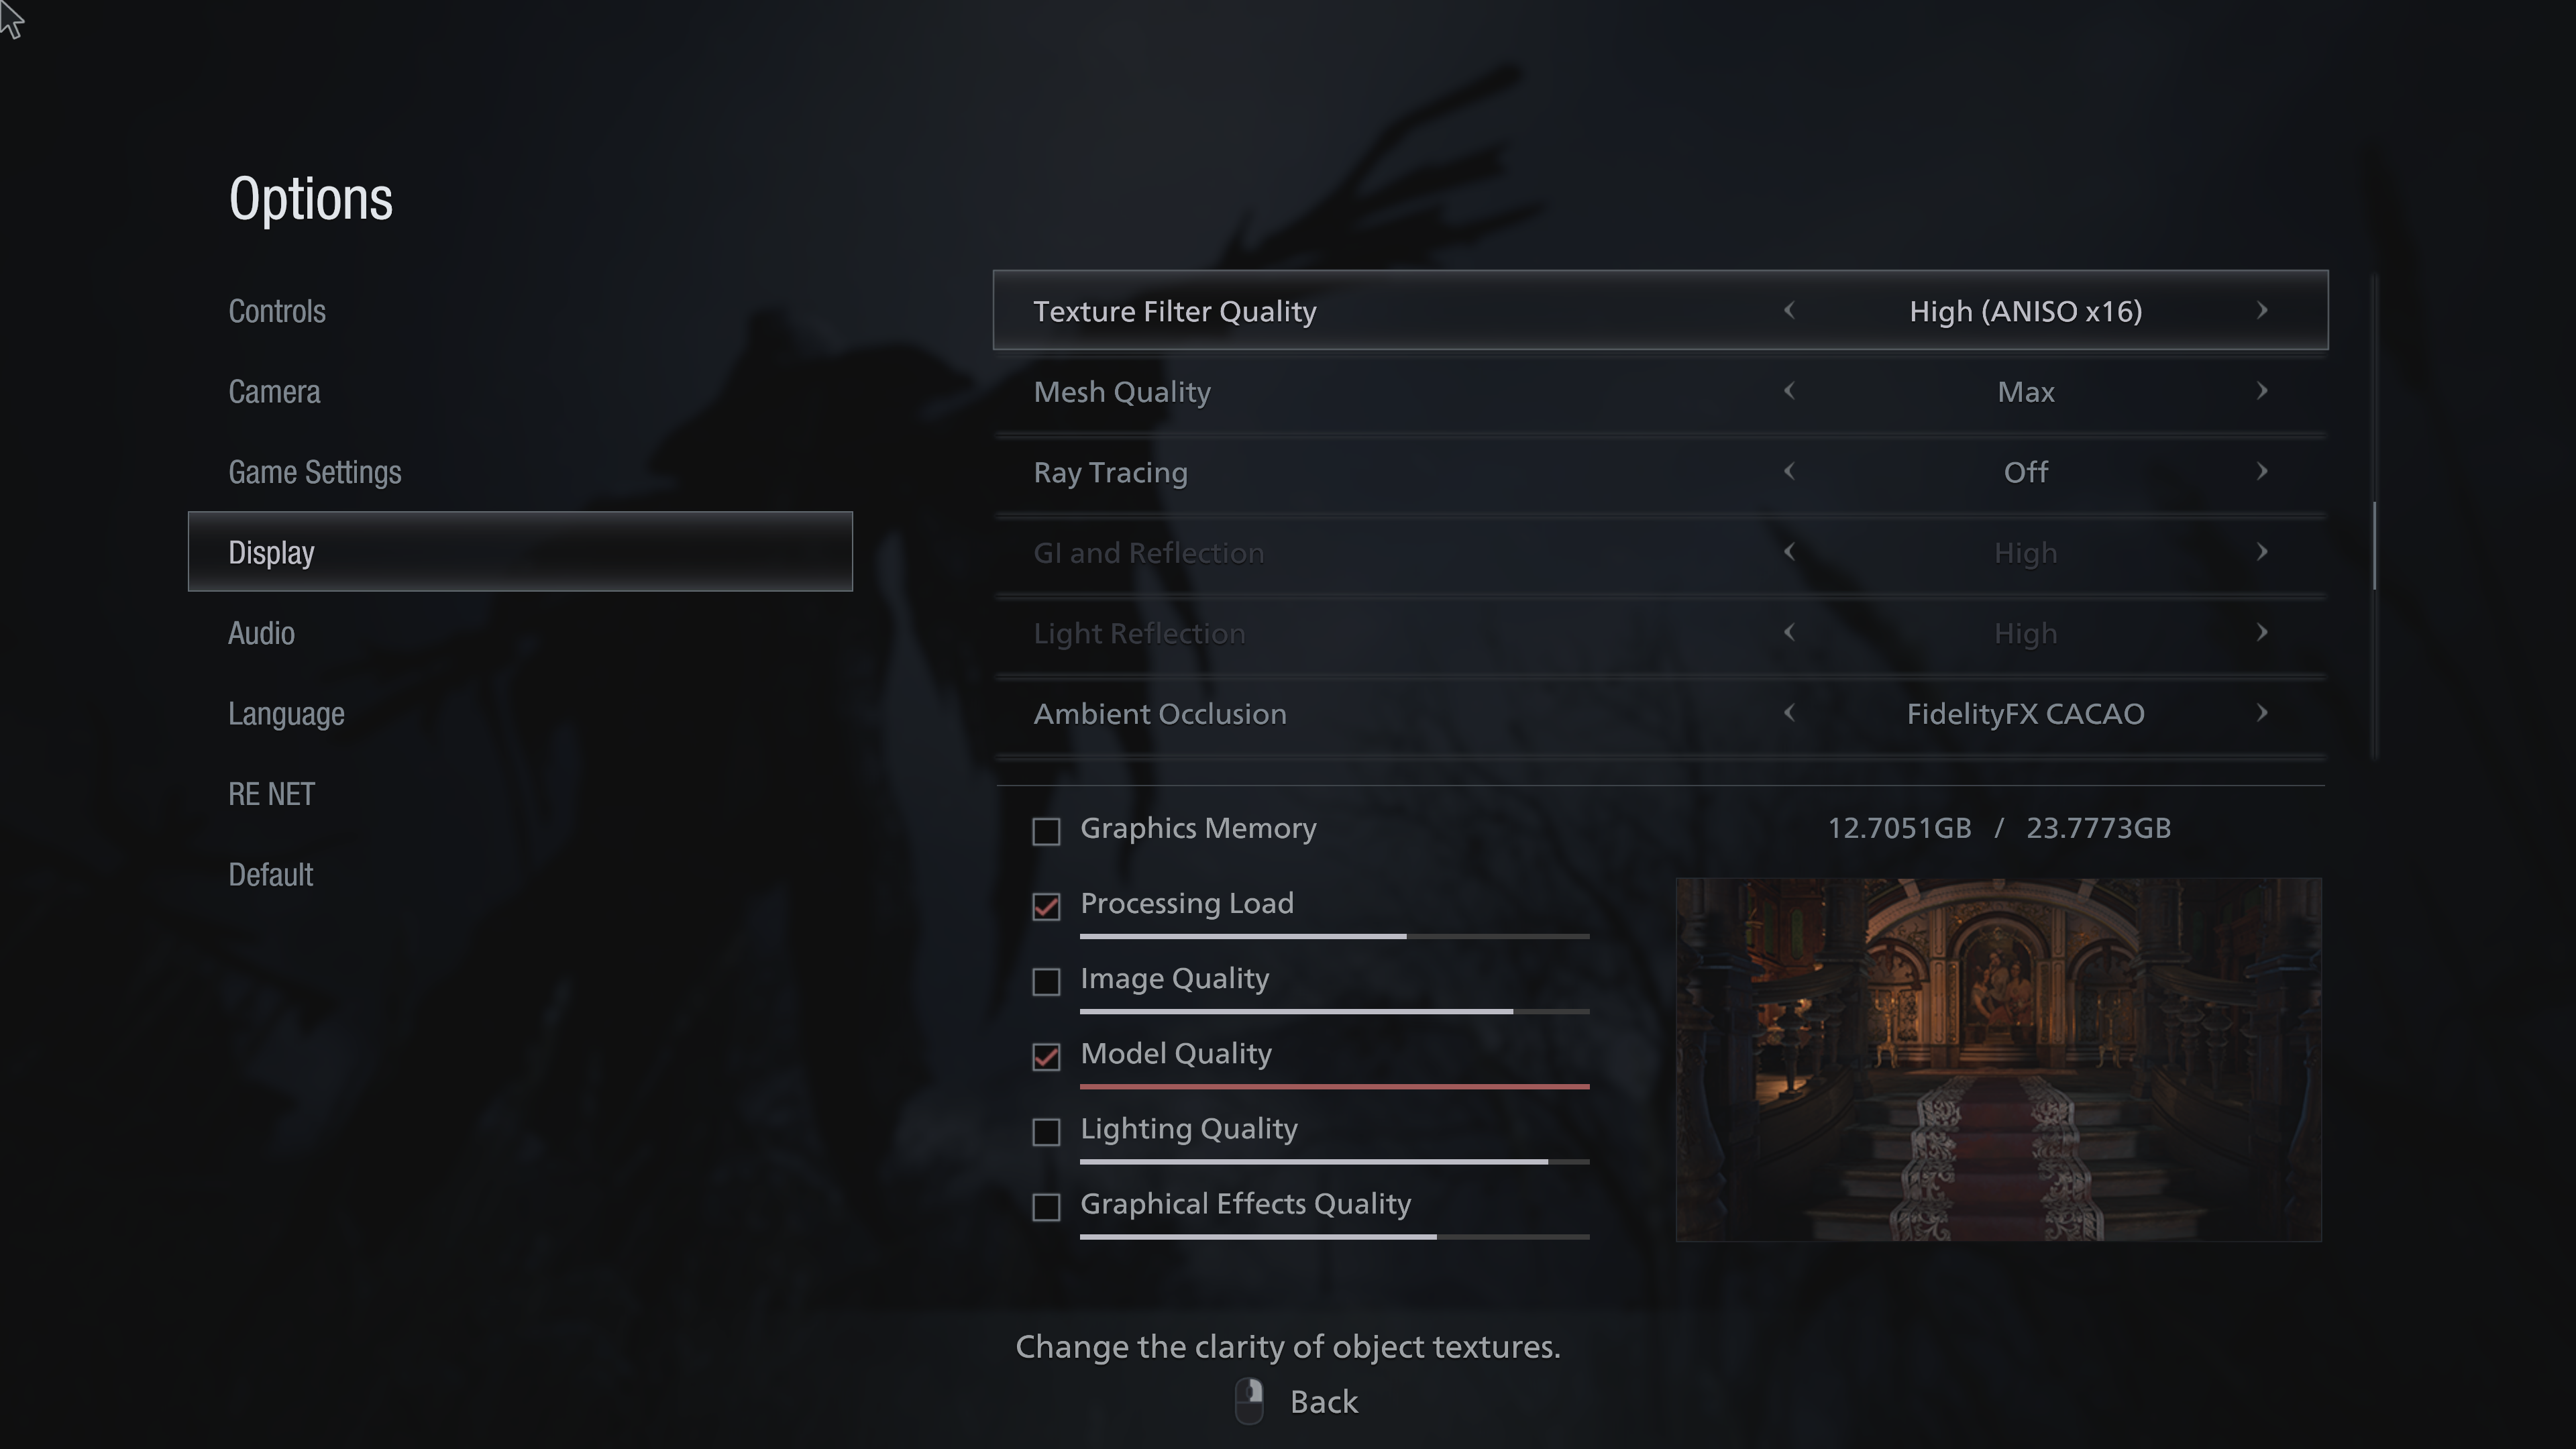
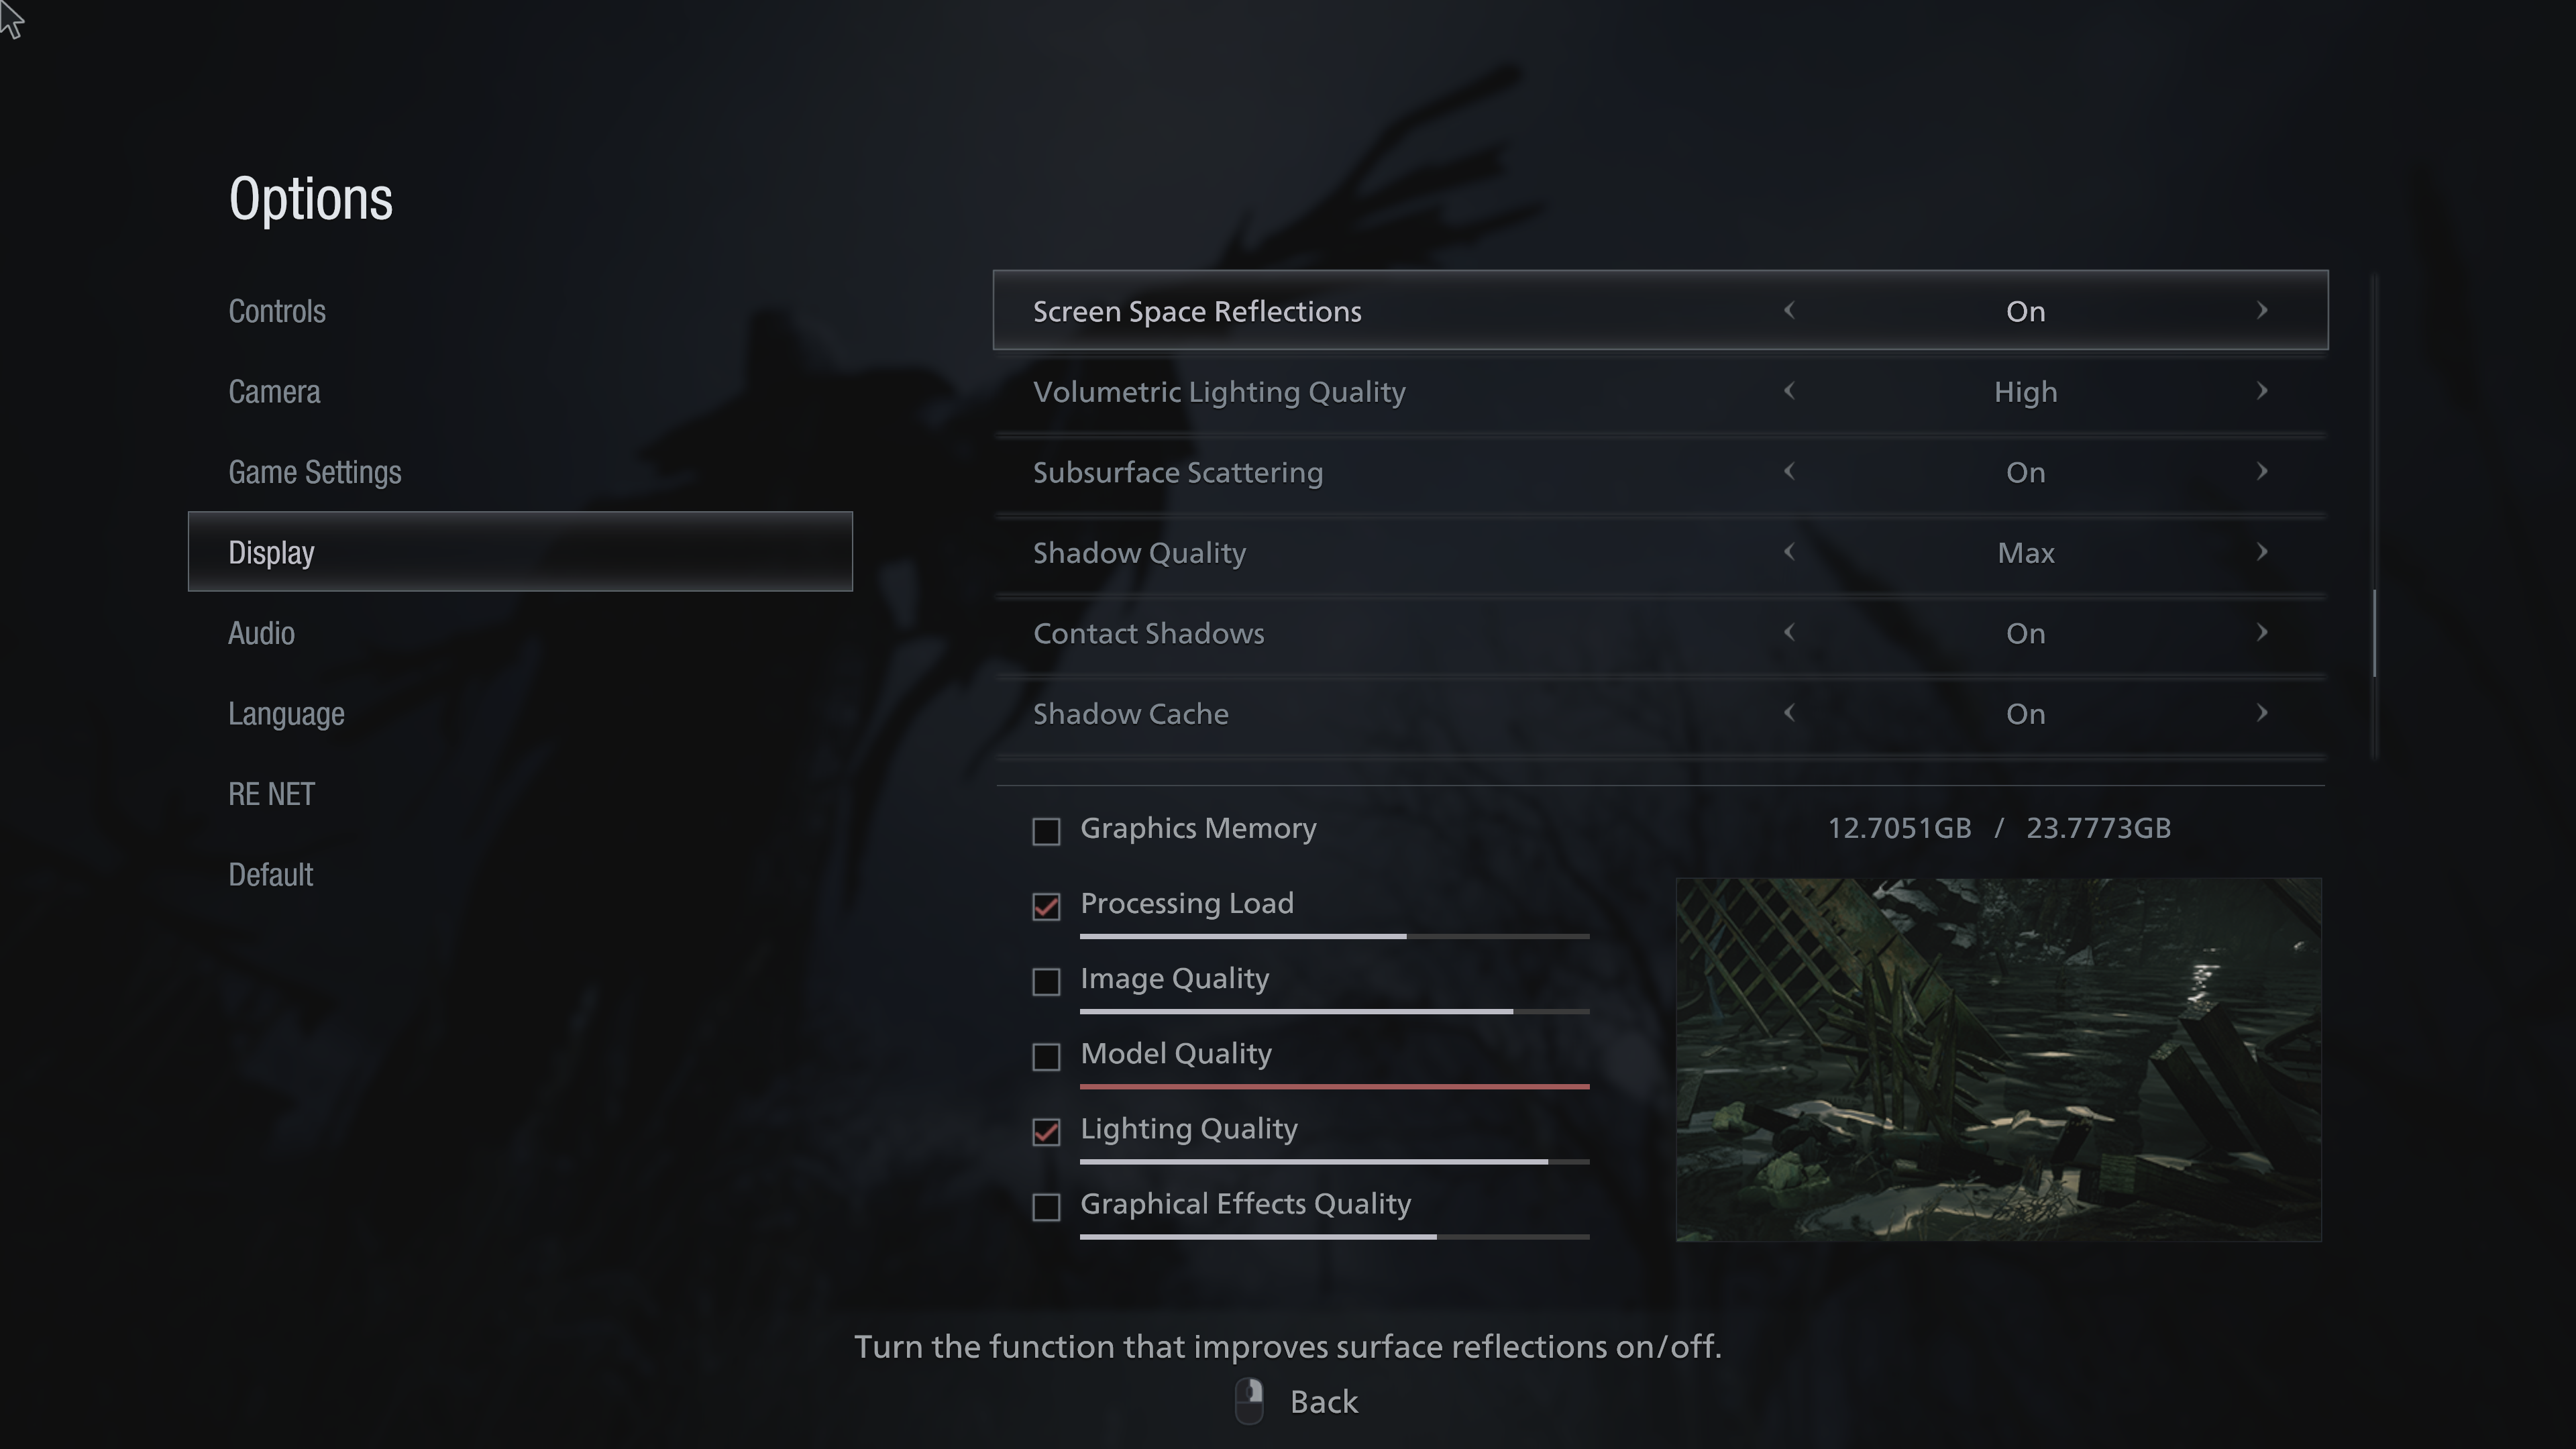
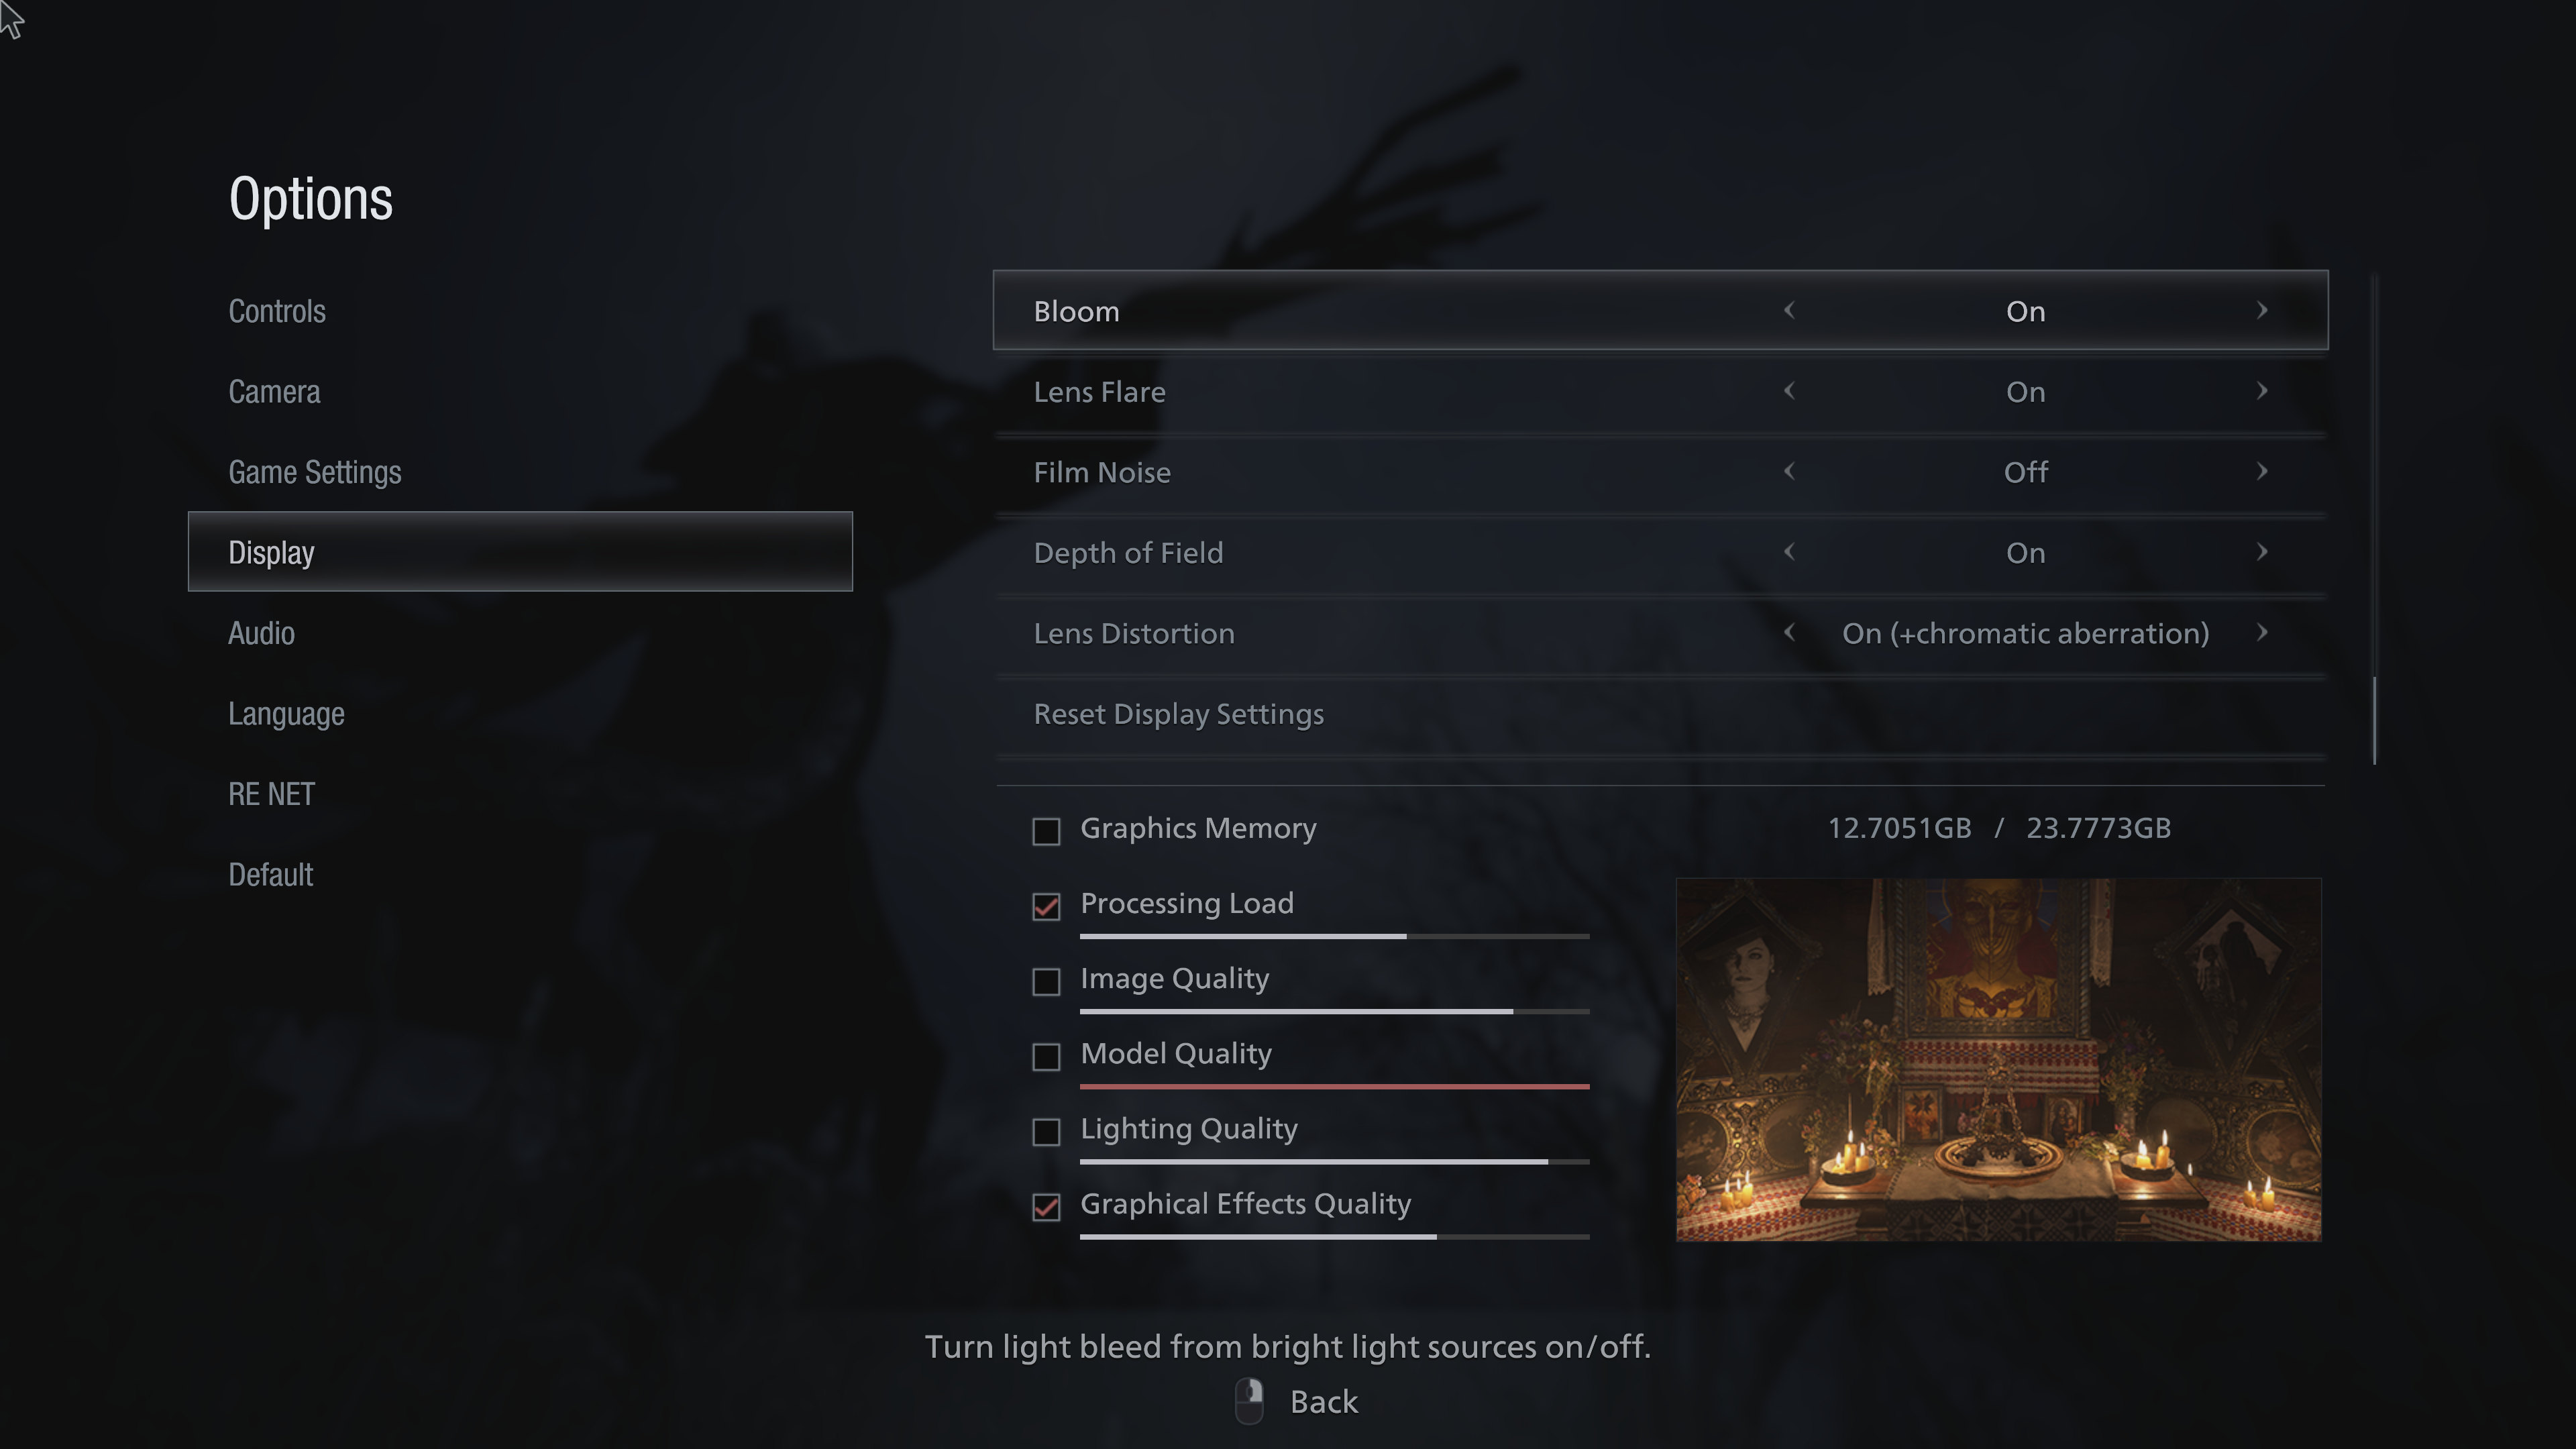
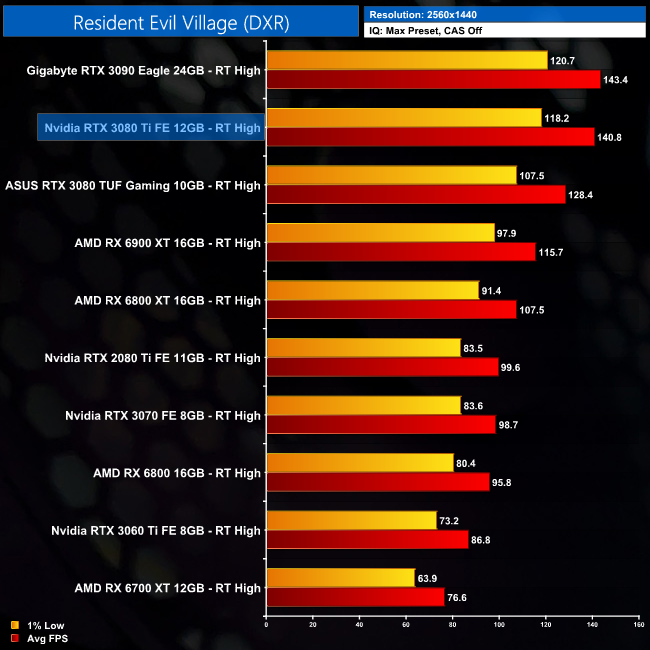
Resident Evil Village is a survival horror game developed and published by Capcom. The sequel to Resident Evil 7: Biohazard (2017), players control Ethan Winters, who is searching for his kidnapped daughter; after a fateful encounter with Chris Redfield, he finds himself in a village filled with mutant creatures. The game was announced at the PlayStation 5 reveal event in June 2020 and was released on May 7, 2021, for Windows, PlayStation 4, PlayStation 5, Xbox One, Xbox Series X/S and Stadia. (Wikipedia.)
Engine: RE Engine. We test using the Max preset, with V-Sync and CAS disabled, DX12 API.

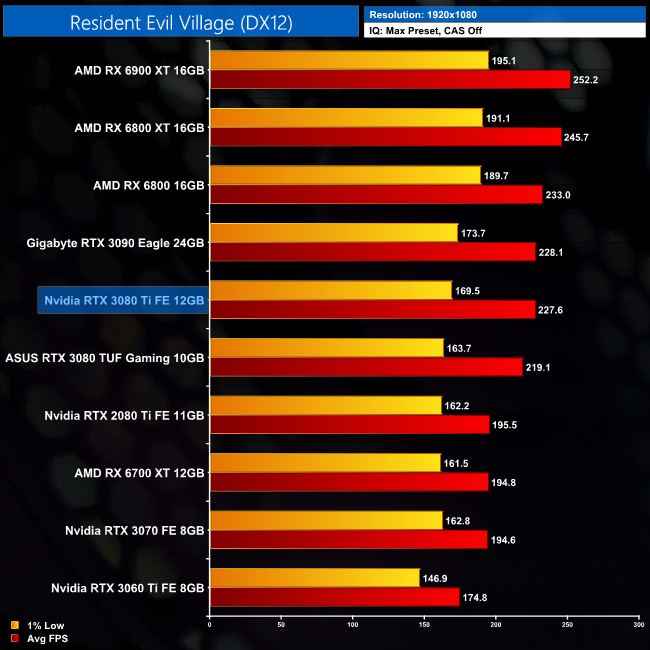

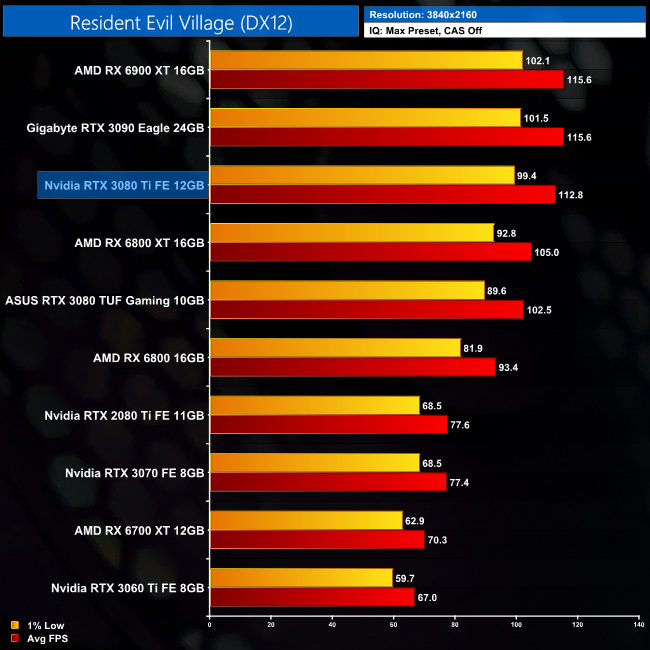
Resident Evil Village is another new addition to our test suite, and its preference for AMD GPUs is clear. At 1440p, the RTX 3080 Ti is a touch slower than the RX 6800 XT, while it's also 9% behind the RX 6900 XT.
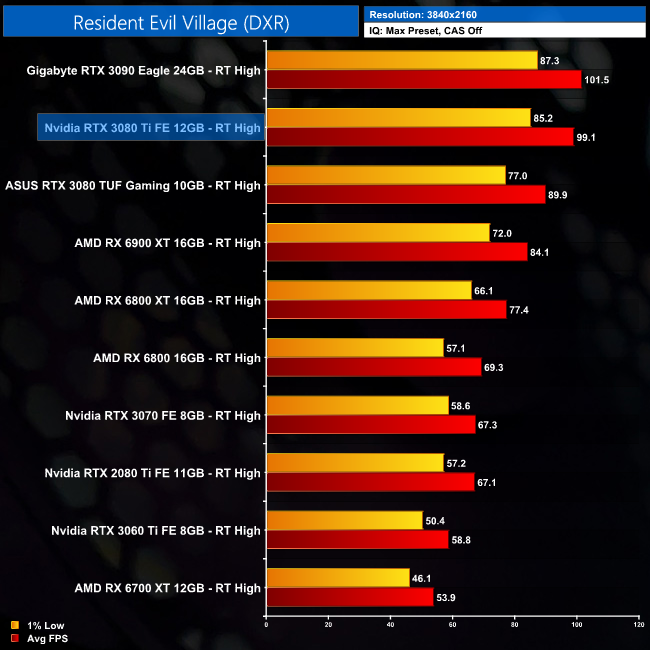
Increasing the resolution to 4K sees the RTX 3080 Ti close the gap on the RX 6900 XT to just 2%. Again though, the key to pick out is the 3080 Ti coming in just behind the RTX 3090, with a 2% margin of difference at both 1440p and 4K.
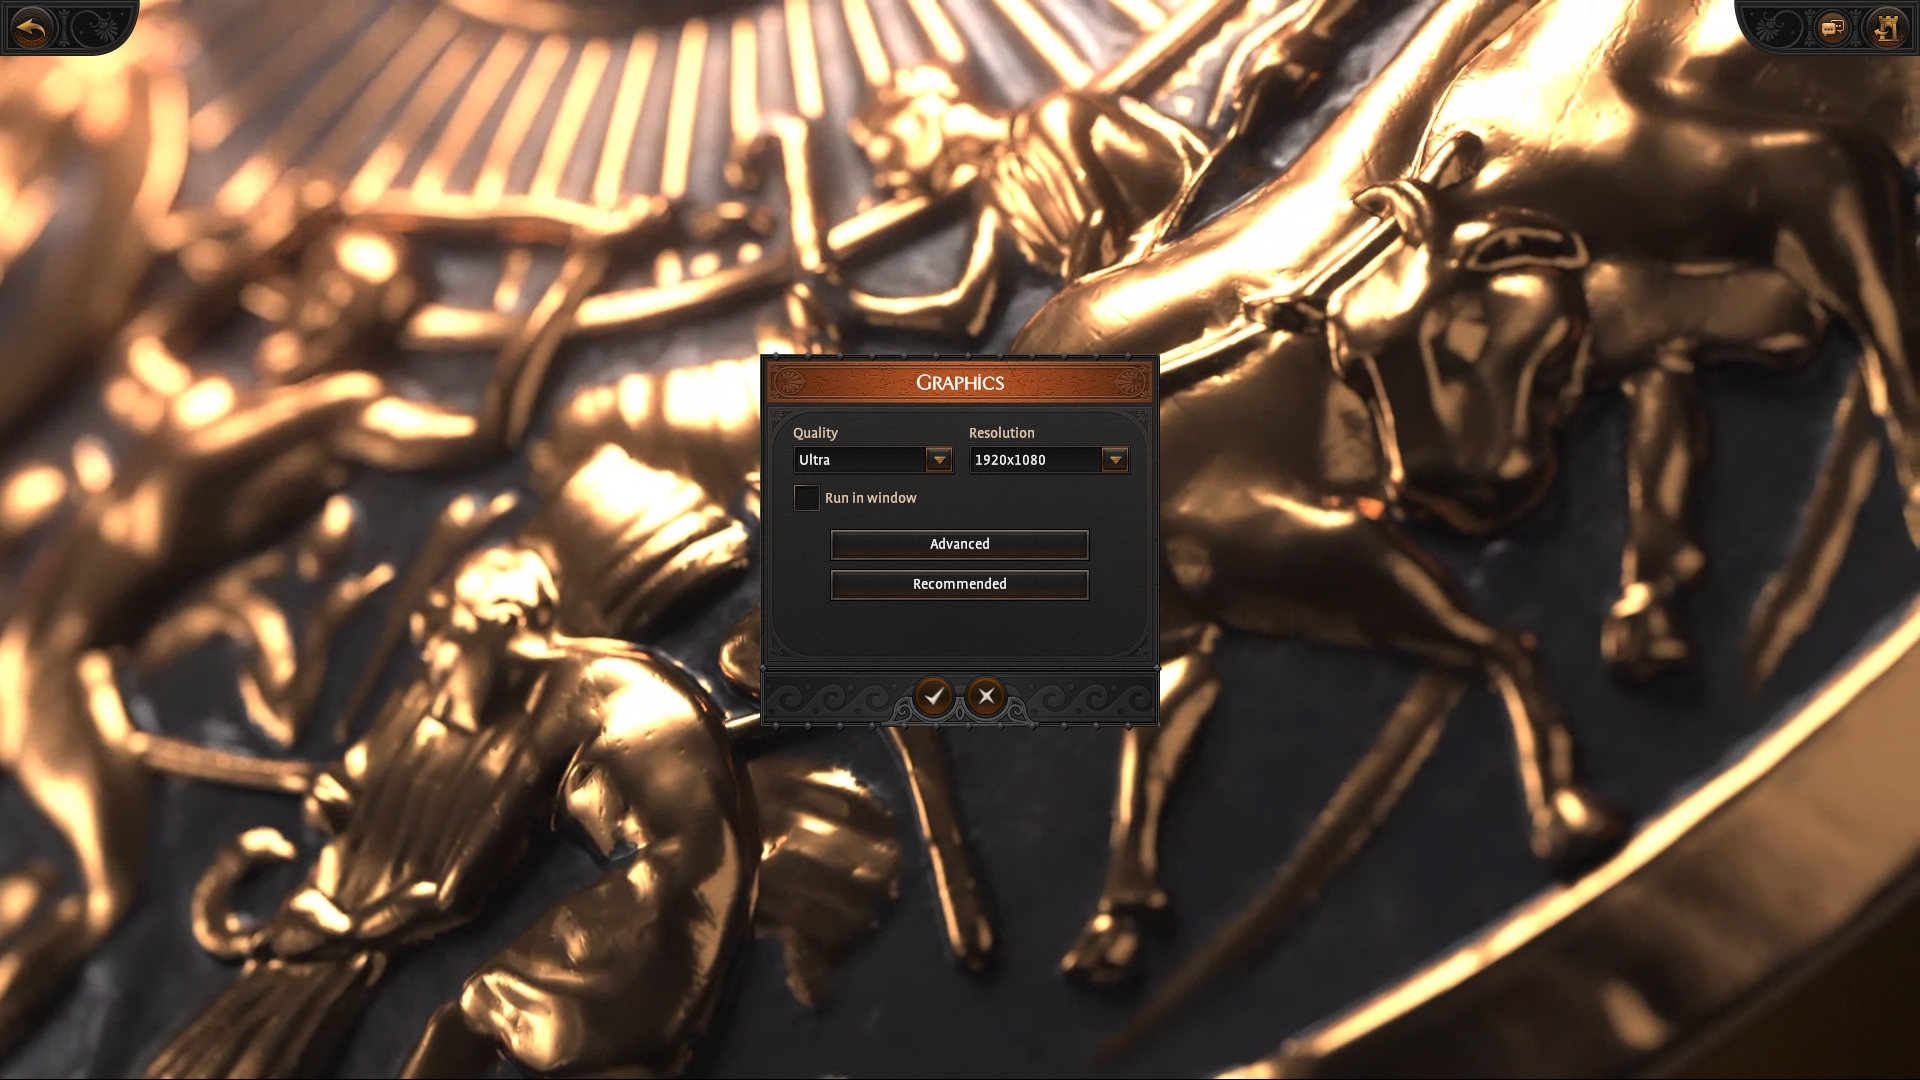
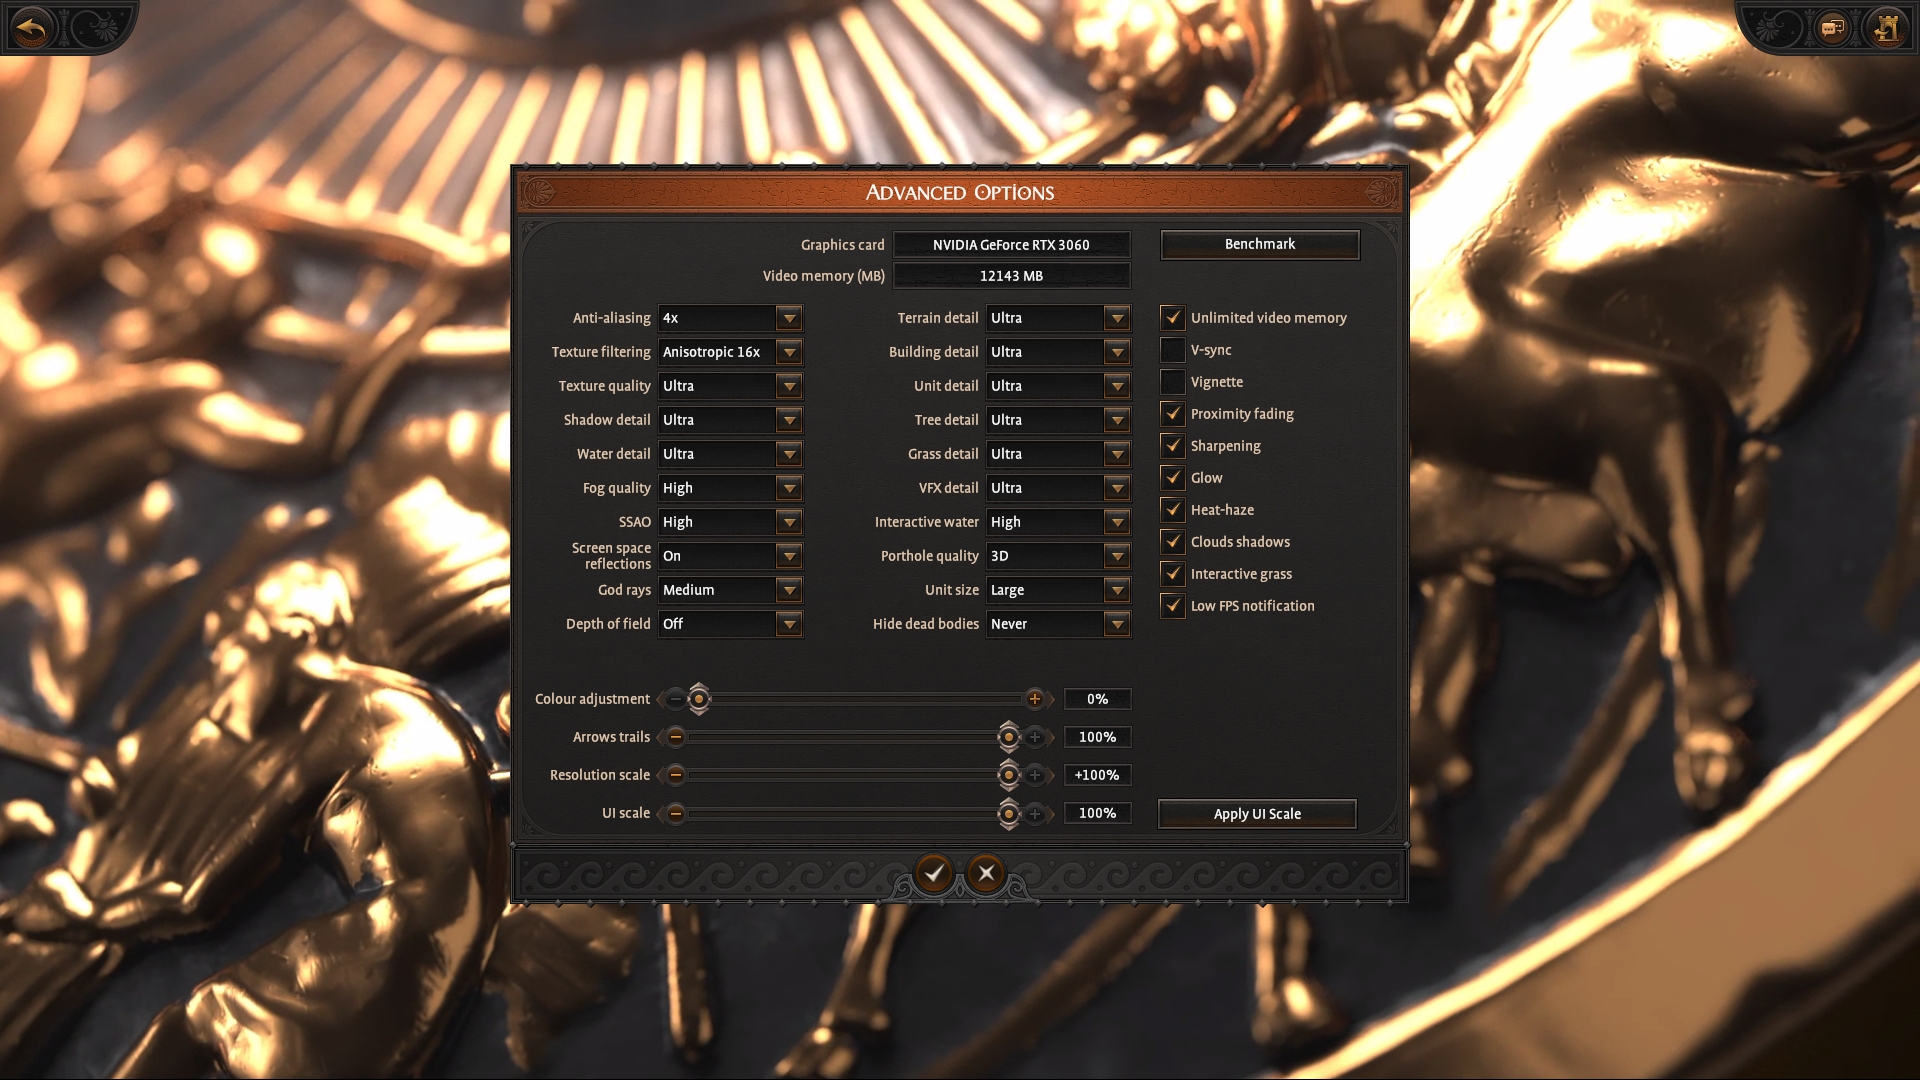
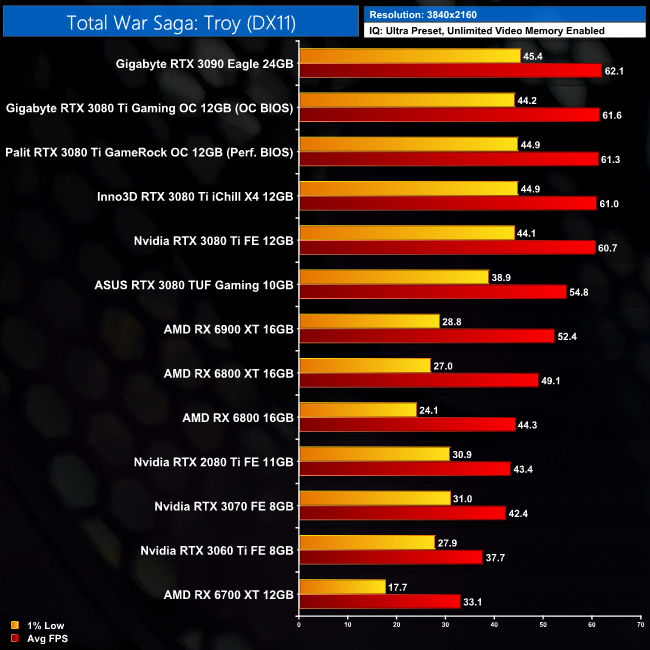
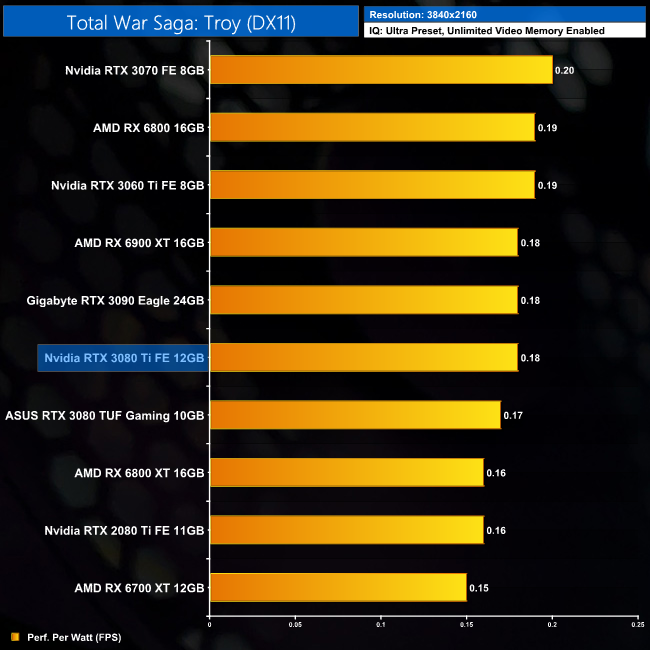
Total War Saga: Troy is a 2020 turn-based strategy video game developed by Creative Assembly Sofia and published by Sega. The game was released for Windows on 13 August 2020 as the second installment in the Total War Saga subseries, succeeding Thrones of Britannia (2018). (Wikipedia).
Engine: TW Engine 3 (Warscape). We test using the Ultra preset, with unlimited video memory enabled, DX11 API.
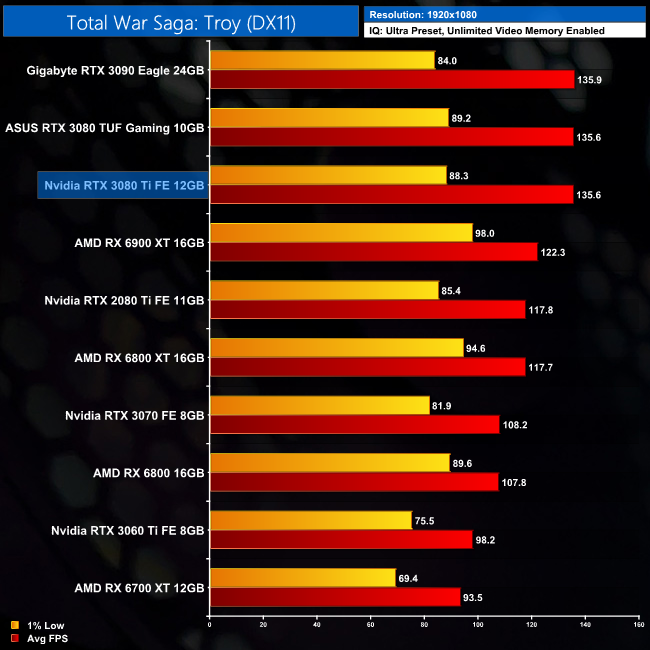
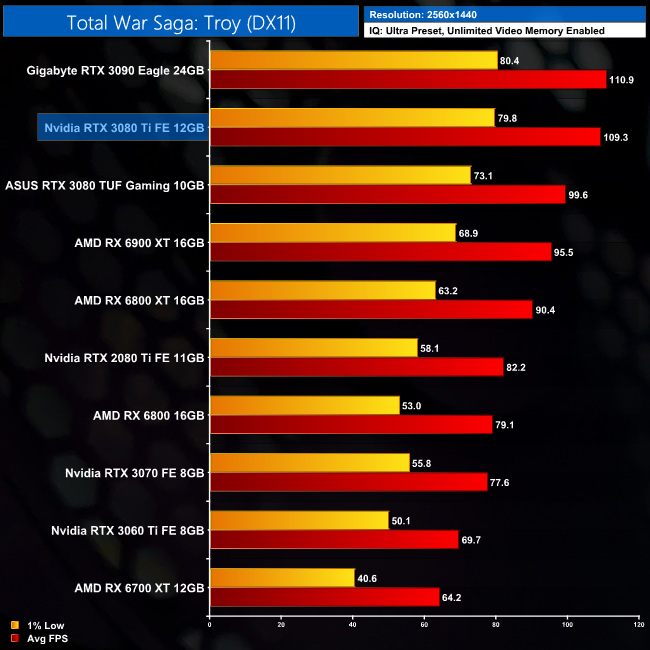
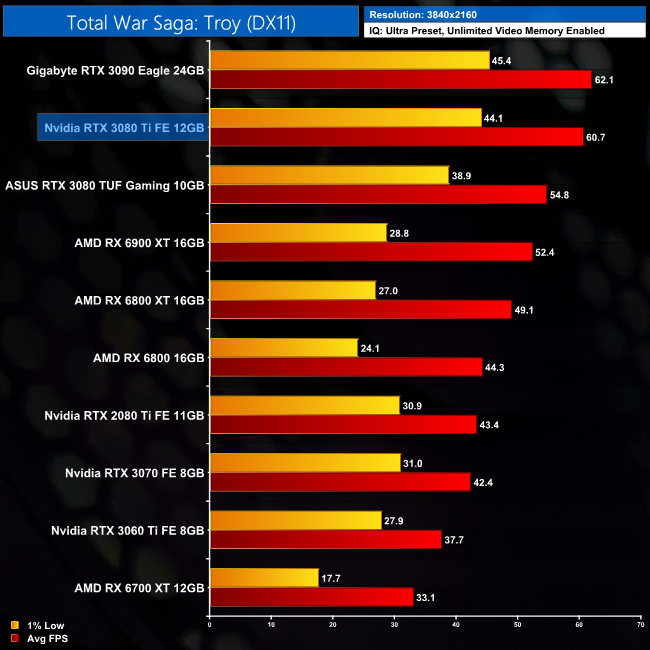
As for Total War Saga: Troy, we know this game favours Nvidia hardware, and that is clear to see with even the RTX 3080 beating the RX 6900 XT at 1440p. The RTX 3080 Ti is 10% faster than its non-Ti sibling, and just 1% slower than the RTX 3090. At 4K, that gap does widen to 2%, but clearly the RTX 3080 Ti is snapping right at the heels of the BFGPU.
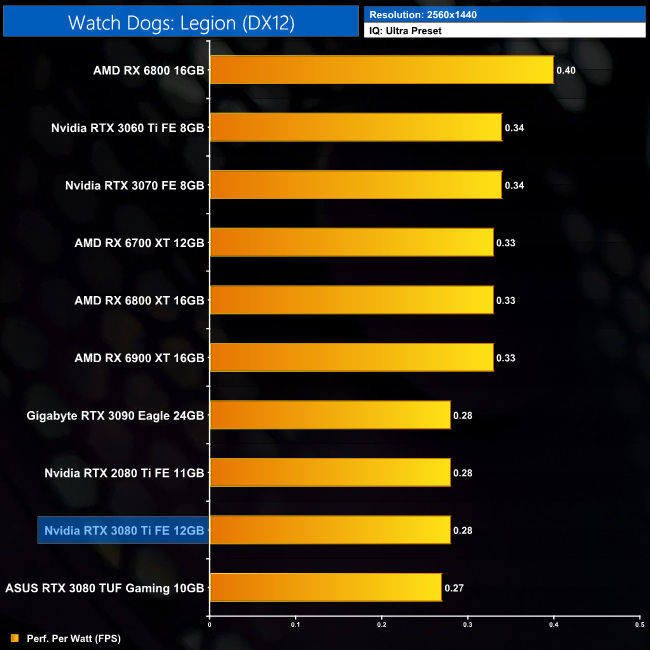
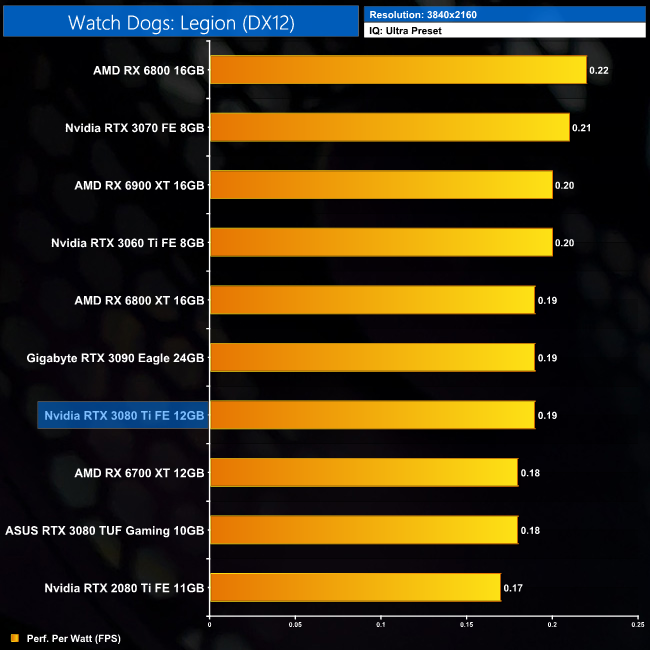
Watch Dogs: Legion is a 2020 action-adventure game published by Ubisoft and developed by its Toronto studio. It is the third instalment in the Watch Dogs series, and the sequel to 2016's Watch Dogs 2. Legion was released on October 29, 2020 for Microsoft Windows, PlayStation 4, Xbox One, and Stadia. (Wikipedia).
Engine: Disrupt. We test using the Ultra preset, DX12 API.
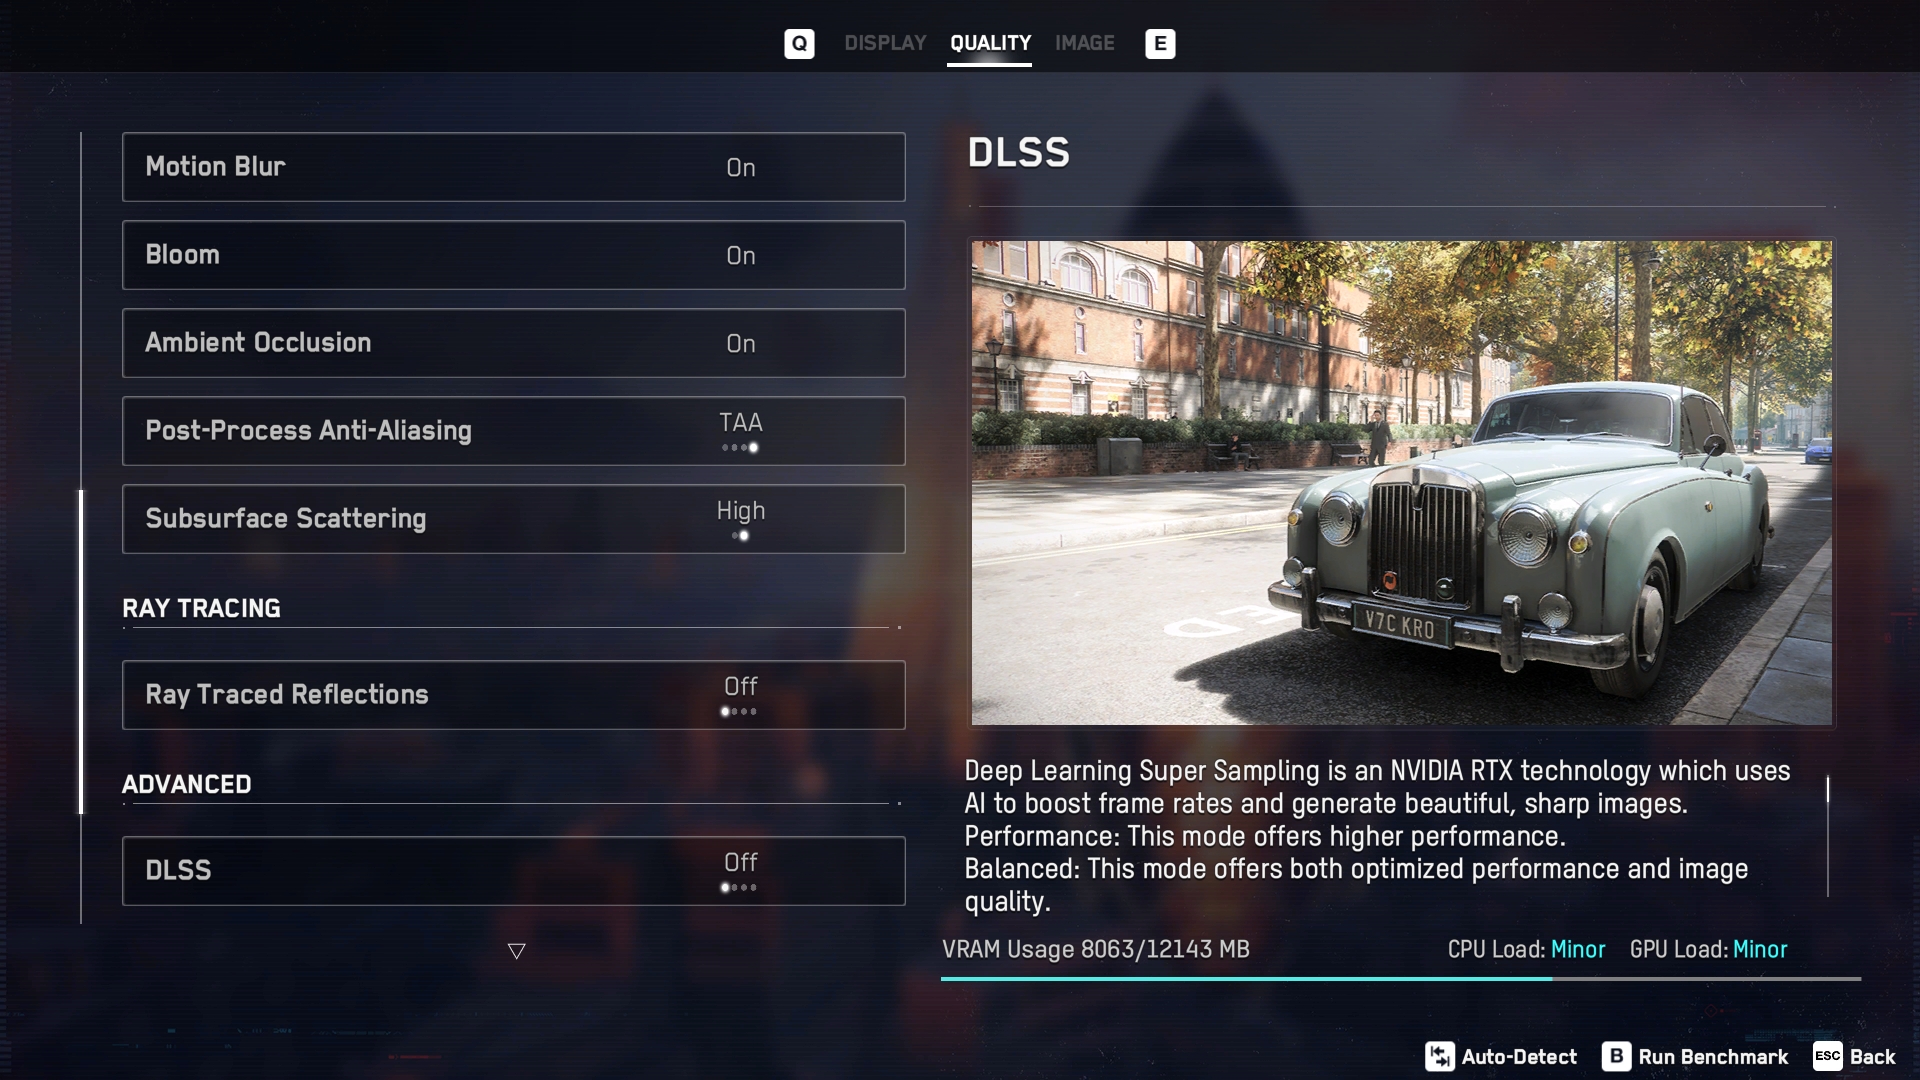
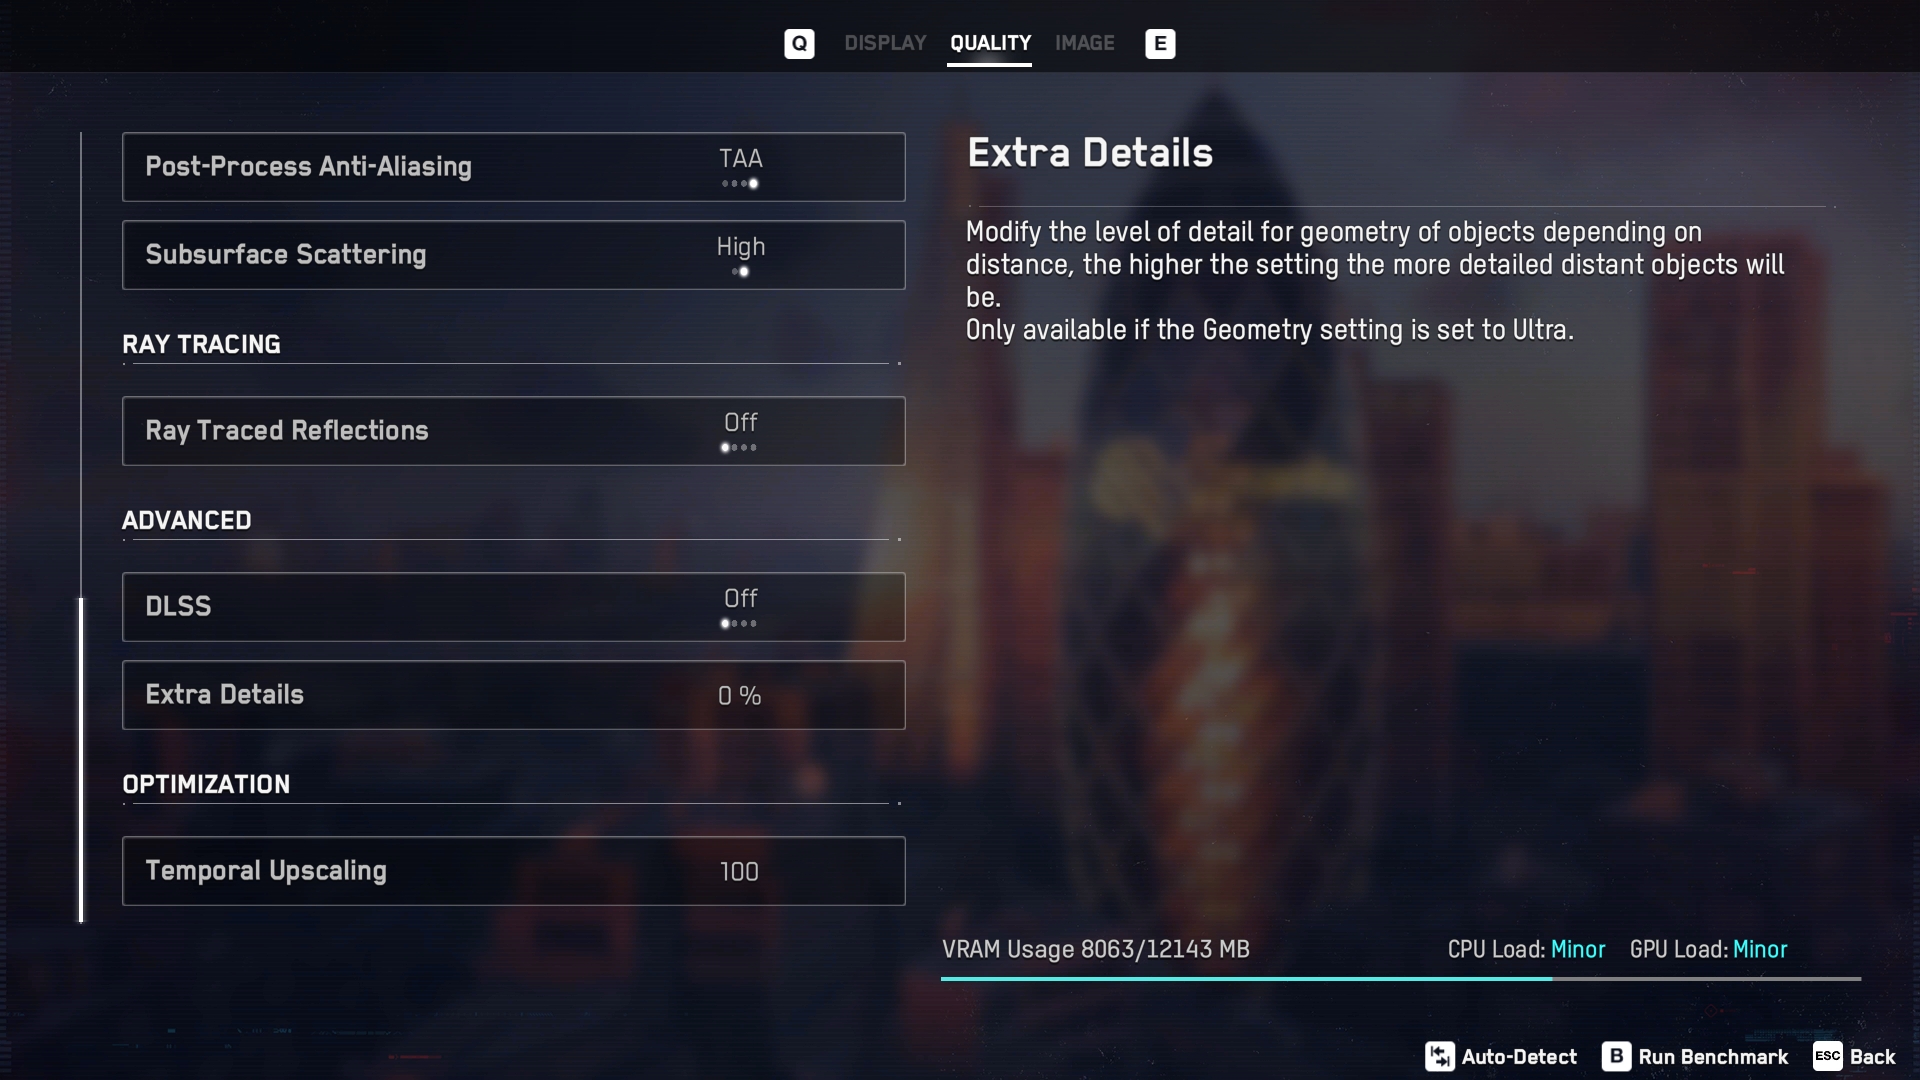
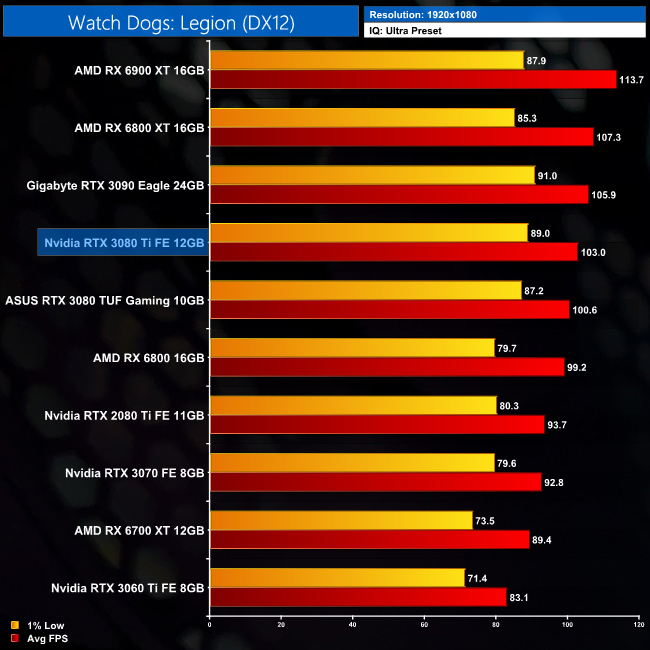
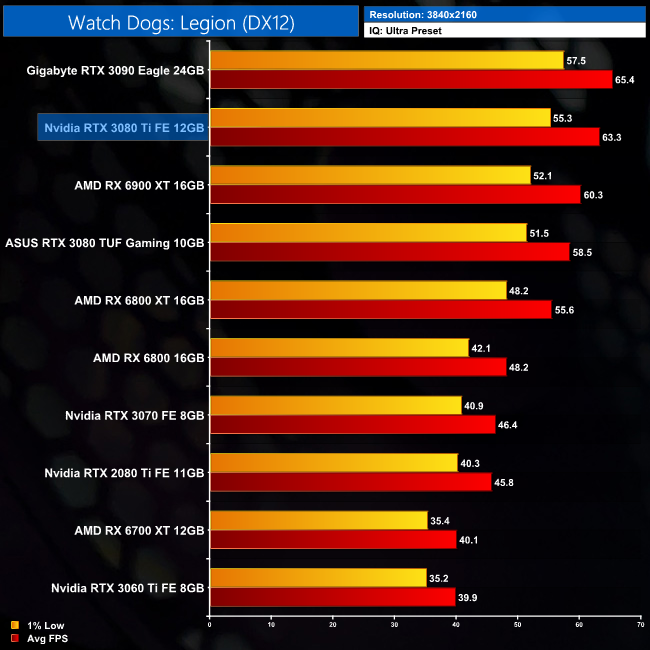
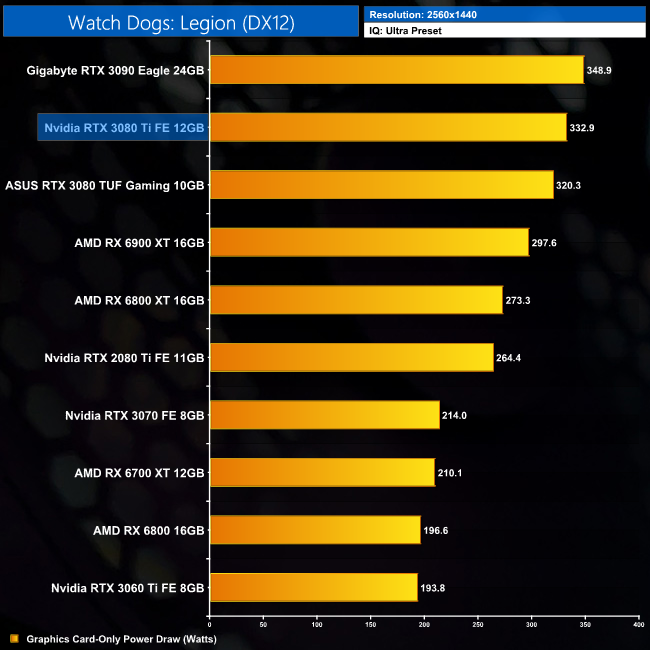
Finally, we close out our game testing with Watch Dogs: Legion. Interestingly enough, the RX 6900 XT is top dog at 1440p here, despite this being an Nvidia sponsored title, with the RTX 3080 Ti coming in 5% slower, while it's 3% behind the RTX 3090.
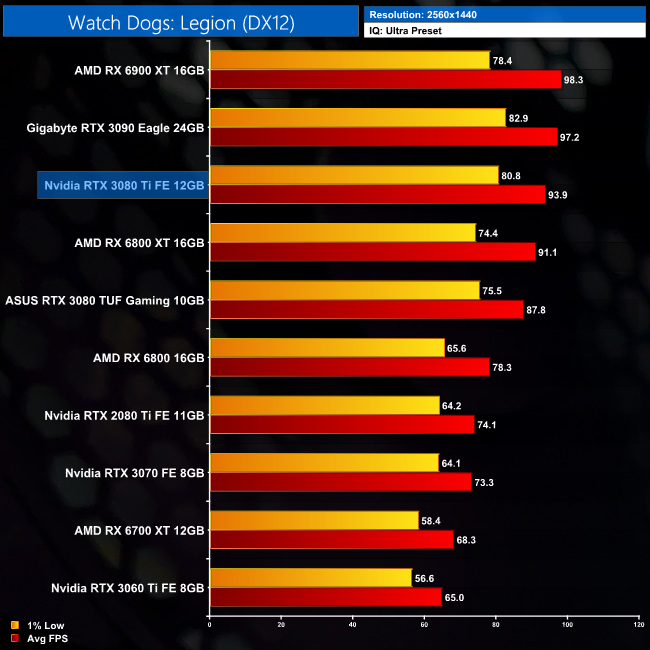
At 4K, the 3080 Ti does overtake the RX 6900 XT, leading it by a 5% margin, though that's only a difference of 3FPS. We're also still looking at a 3% difference between the RTX 3080 Ti and the RTX 3090, with just a couple of frames between those two GPUs.
Here we test Cyberpunk 2077, this time testing with the in-game ray tracing effects set to their highest values.
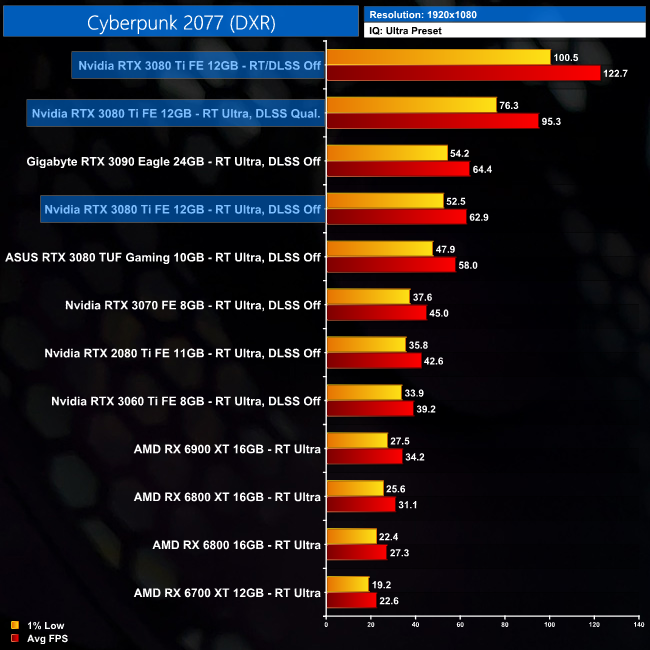
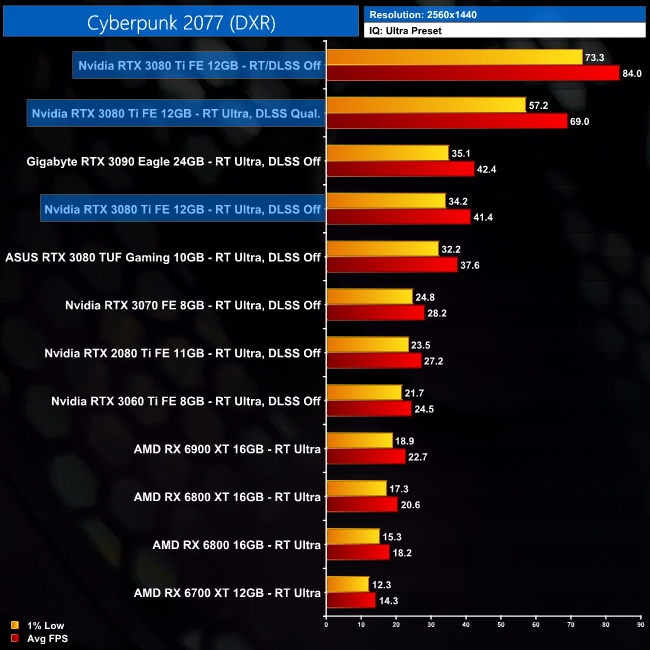
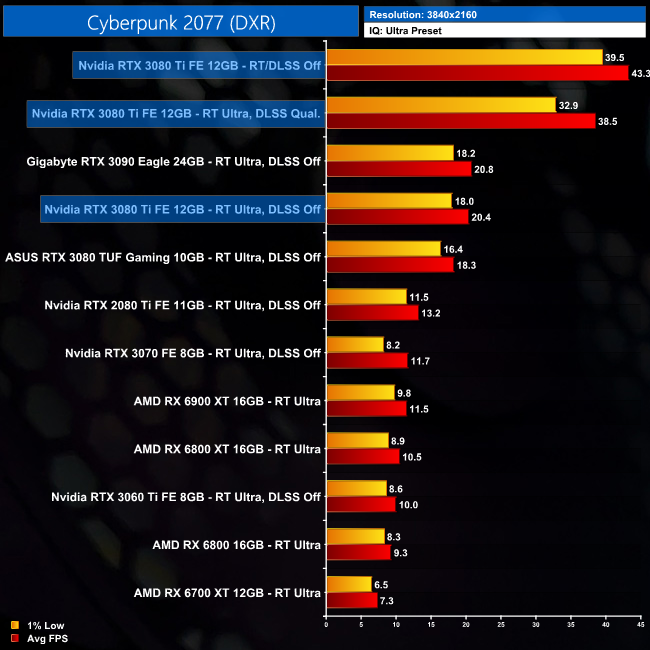
Ray tracing performance in Cyberpunk doesn't show us anything we wouldn't expect based on the rasterisation numbers. With two fewer RT cores compared to the RTX 3090, we can see the RTX 3080 Ti sitting just behind the RTX 3090 when ray tracing is set to Ultra. DLSS is on hand to also give performance a healthy boost when using the Quality mode, with a 67% increase to average frame rate at 1440p.
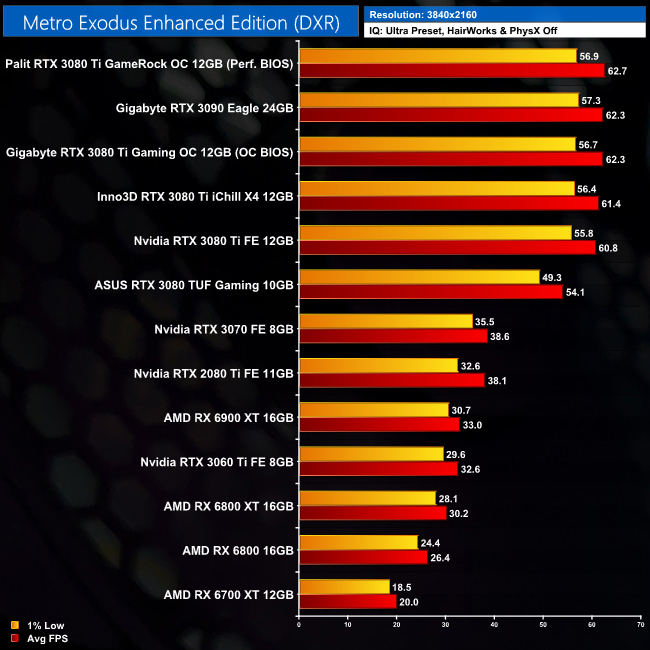
Here we test Metro Exodus Enhanced Edition, with the in-game ray tracing effects set to their highest values.
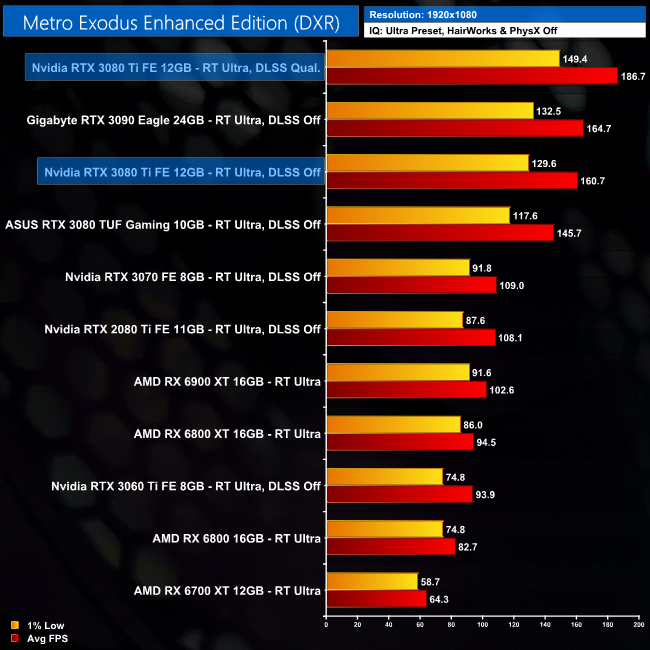
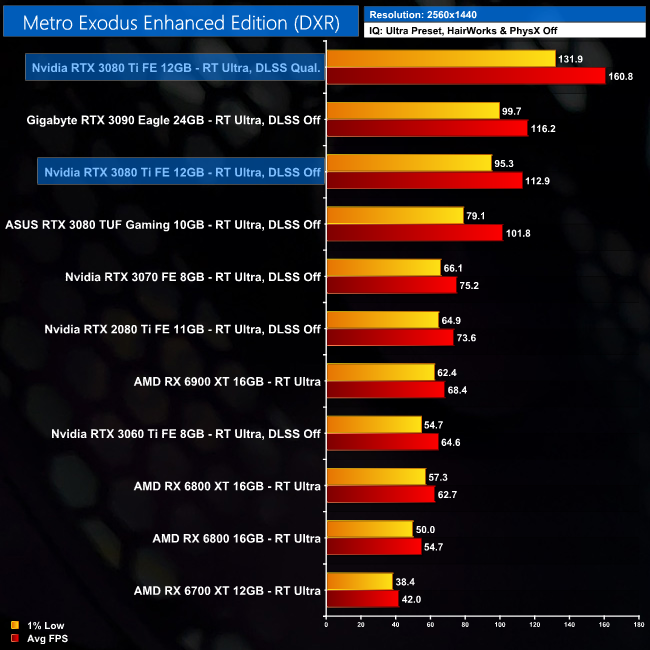
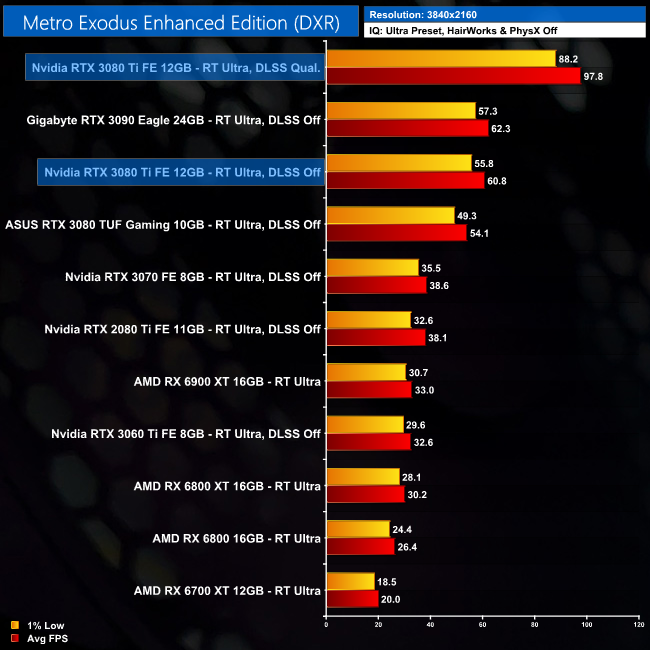
The same goes for Metro Exodus Enhanced Edition, where the RTX 3080 Ti is just a few frames behind the RTX 3090 with ray tracing set to ultra. DLSS Quality mode also provides a 42% boost to frame rates at 1440p.
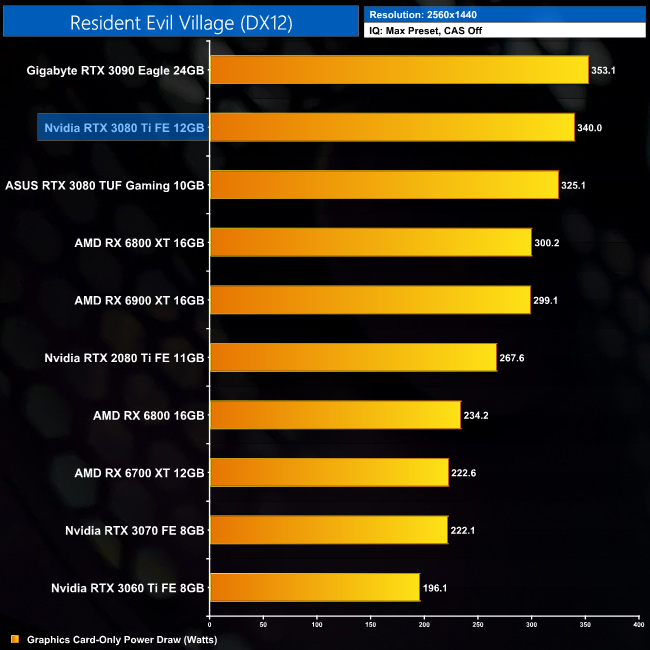
Here we test Resident Evil Village, this time testing with the in-game ray tracing effects set to their highest values.
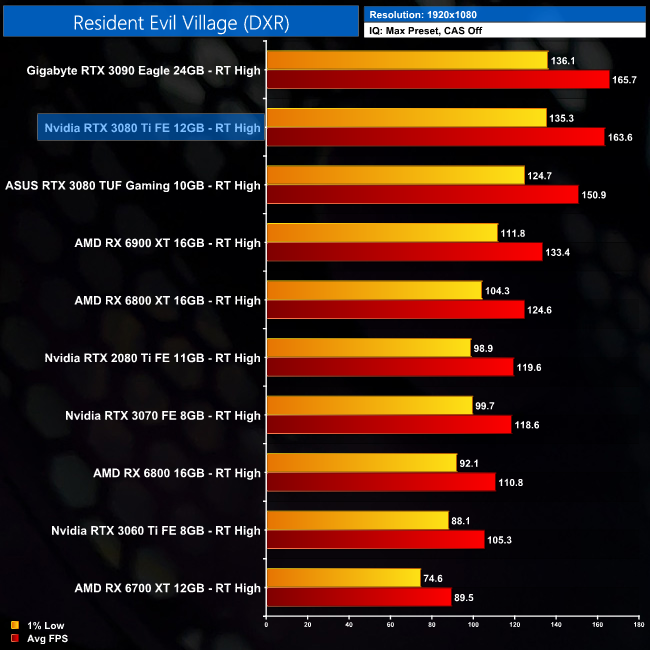
Resident Evil Village is our last test with ray tracing, and it's more of the same. The RTX 3080 Ti is snapping at the heels of the RTX 3090 the whole way, delivering just 2FPS less when testing at 4K, which puts it 18% ahead of the RX 6900 XT.
Here we present frame rate figures for each graphics card, averaged across all 12 games on test today. These figures can disguise significant variations in performance from game to game, but provide a useful overview of the sort of performance you can expect at each resolution tested.
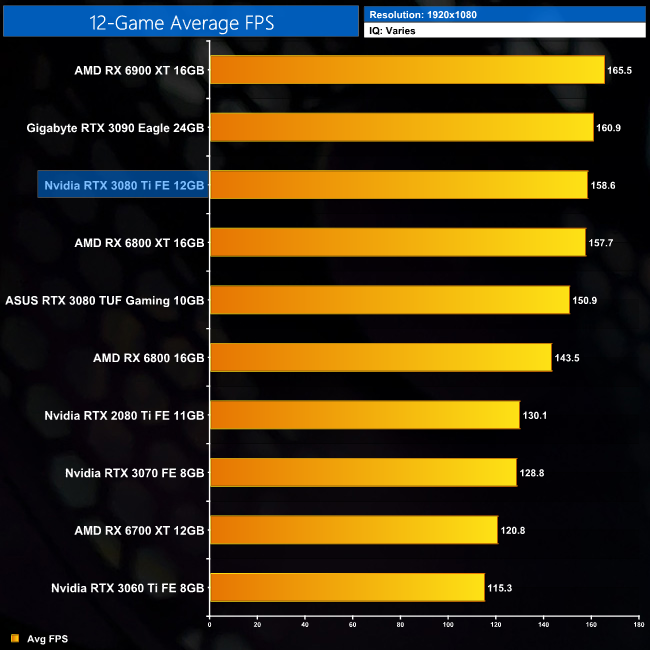
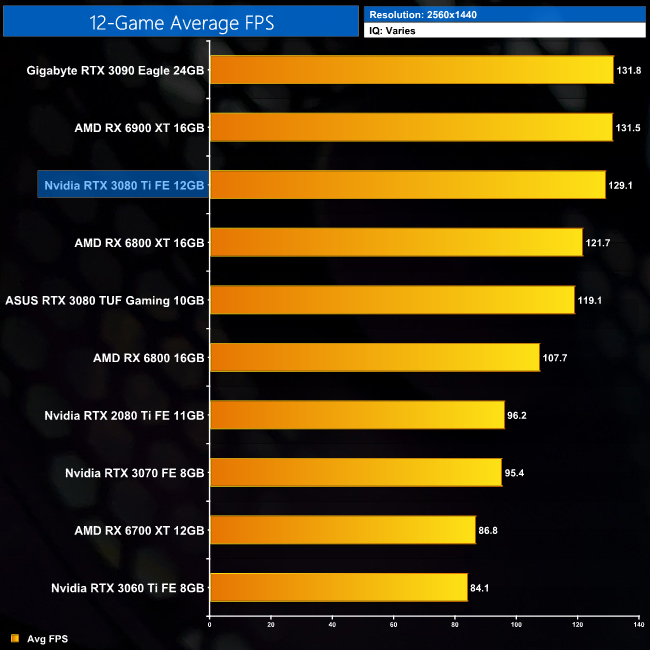
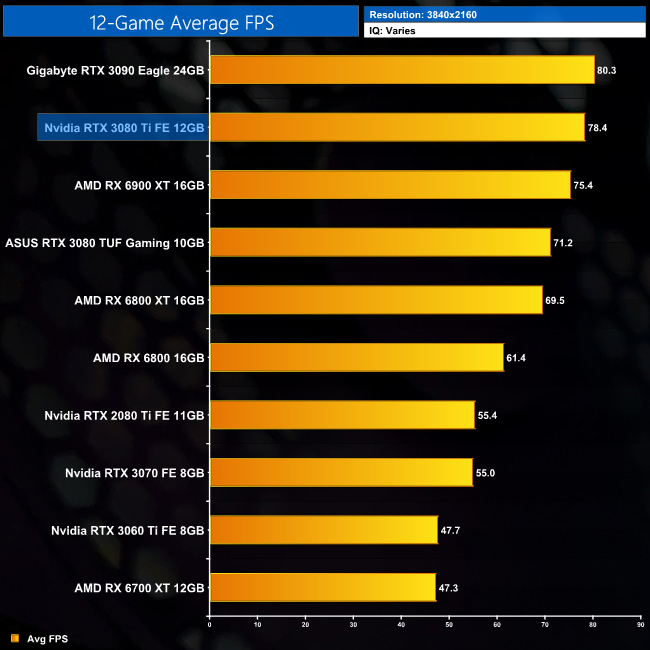
Averaged across the 12 games we have tested, it is clear to see the RTX 3080 Ti is essentially as fast as the RTX 3090, give or take a couple of percentage points. The difference is quite trivial, with a 2% margin between the two at 1440p and 4K. The differences versus the RX 6900 XT will be more variable depending on the games tested, but our sample sees the RTX 3080 Ti come in 4% faster on average at 4K. It's also 10% faster on average when compared to the RTX 3080.
While our primary focus so far has been on the gaming performance of the RTX 3080 Ti Founders Edition, here we include a select sample of 3DMark and 4K gaming benchmarks, testing all four RTX 3080 Ti cards featured in this review.
This data shows us there isn't a whole lot to be gained from a factory-overclocked AIB card. In some instances, the factory OC is enough to push the RTX 3080 Ti beyond the RTX 3090, as seen in Gears 5. In other examples however, such as Total War Saga: Troy, the added clock speed the partners have added really is inconsequential. The bottom line is an RTX 3080 Ti performs like an RTX 3080 Ti, and factory overclock or not, they are all very much in the same ballpark.
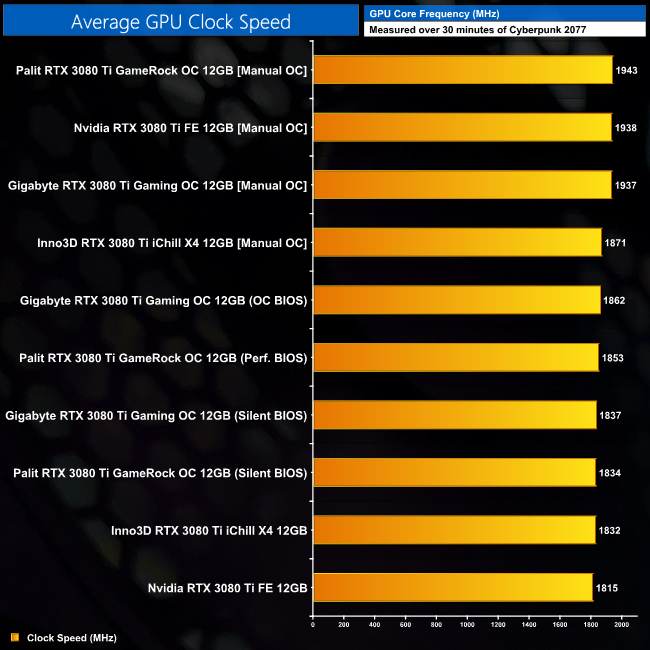
Here we present the average clock speed for each graphics card while running Cyberpunk 2077 for 30 minutes. We use GPU-Z to record the GPU core frequency during gameplay. We calculate the average core frequency during the 30 minute run to present here.
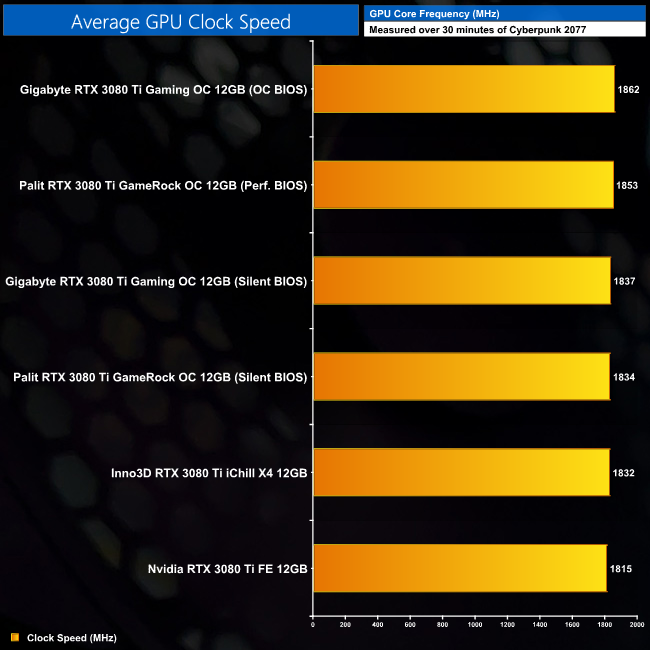
The reason we saw such similar gaming performance between all four RTX 3080 Ti cards tested, is that even the factory overclocked models don't run that much faster in terms of clock speed. The Gigabyte Gaming OC managed the highest frequency, averaging 1862MHz when using the card's OC BIOS, but that's still less than a 50MHz boost compared to the reference-clocked Founders Edition.
For our temperature testing, we measure the peak GPU core temperature under load. A reading under load comes from running Cyberpunk 2077 for 30 minutes.
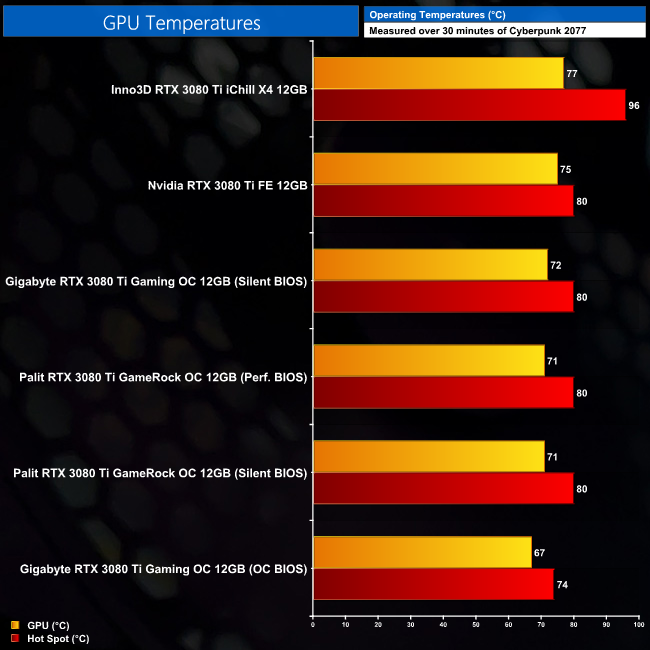
Temperature testing is where we can see more of a difference between the four cards tested. First of all, Nvidia's decision to use the RTX 3080 cooler for the RTX 3080 Ti is not problematic at all, as the GPU hot spot did not exceed 80C in our testing. The Palit and Gigabyte cards are able to better this, with the Gaming OC's OC BIOS delivering the coolest results, with a hot spot temperature of 74C.
On the other hand, the Inno3D iChill X4 is more problematic, with a hot spot hitting 96C, while the GPU temperature hit 77C. That's a large delta between the two measurements, possibly indicative of less-than-ideal mounting pressure, though Inno3D did ask us before we began testing to not disassemble the card, so we can't verify this theory.
Update 20/07/21: Inno3D have been in touch and sent us a second iChill X4 to test – the thermal results of which are below.
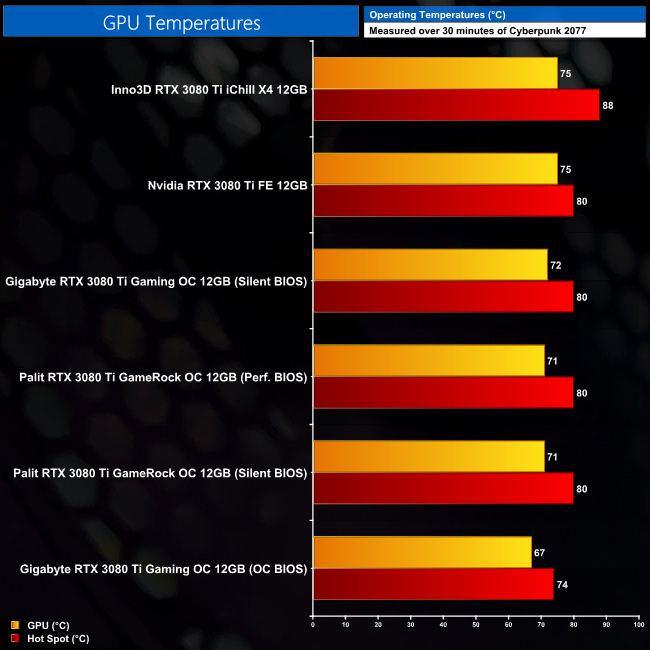
This sample is definitely an improvement, with a much lower hot spot temperature, potentially indicating poor mounting pressure on our original card. It's still not the best performer in terms of temperatures, but it is better.
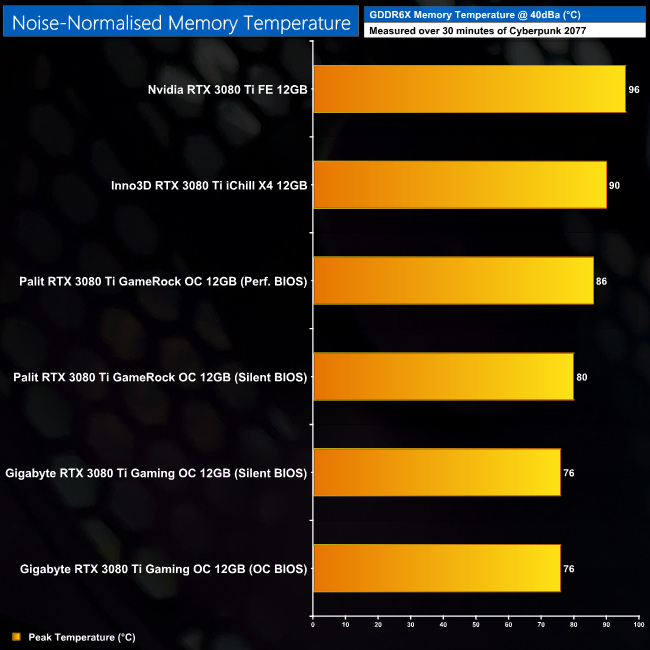
For our temperature testing, we measure the peak memory temperature under load. A reading under load comes from running Cyberpunk 2077 for 30 minutes.
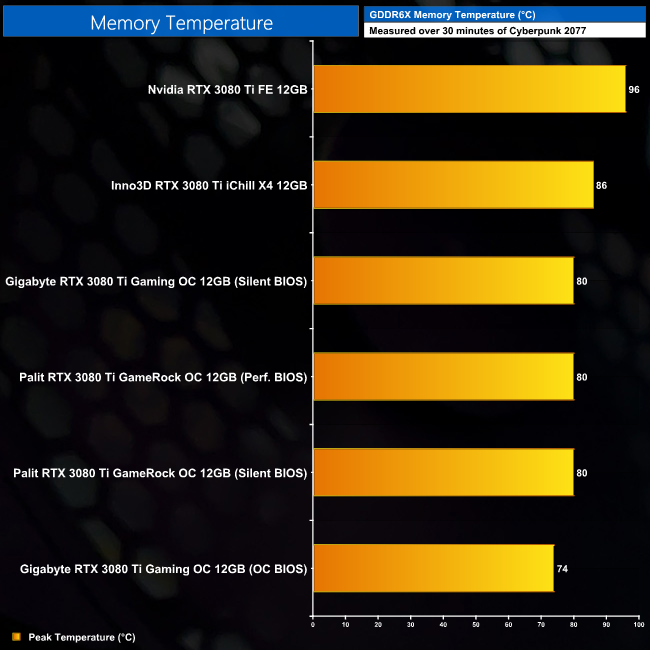
The first thing to note here is that Nvidia's Founders Edition still has some trouble with cooling the GDDR6X memory. It's not absolutely clear what TJMax is for Micron's GDDR6X, with 95C/105C listed for the memory case temperature, it's been speculated TJMax could be up to 120C.
Either way, the Founders Edition saw the highest memory temperature by a fair distance, with the iChill X4 hitting 86C. At the bottom, the Gaming OC's result of 74C is the coolest by a 6C margin.
Update 20/07/21: Inno3D have been in touch and sent us a second iChill X4 to test – but memory temperatures remained at 86C.
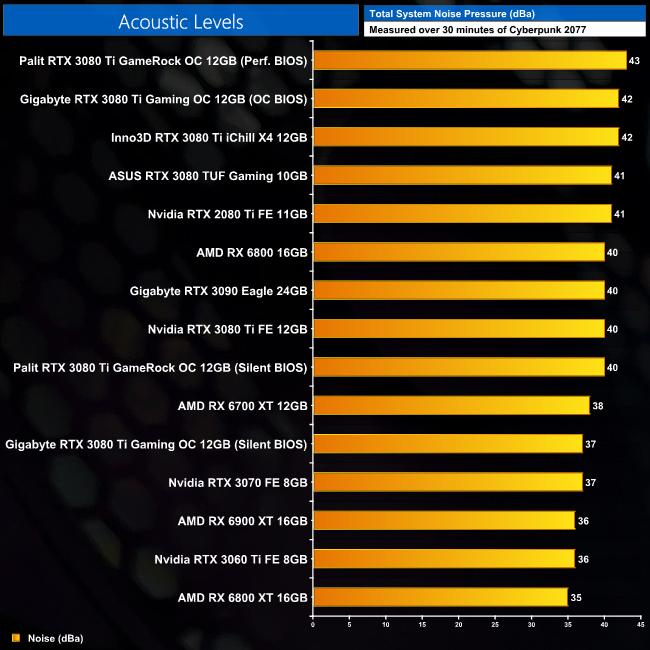
We take our noise measurements with the sound meter positioned 1 foot from the graphics card. I measured the noise floor to be 32 dBA, thus anything above this level can be attributed to the graphics cards. The power supply is passive for the entire power output range we tested all graphics cards in, while all CPU and system fans were disabled. A reading under load comes from running Cyberpunk 2077 for 30 minutes.
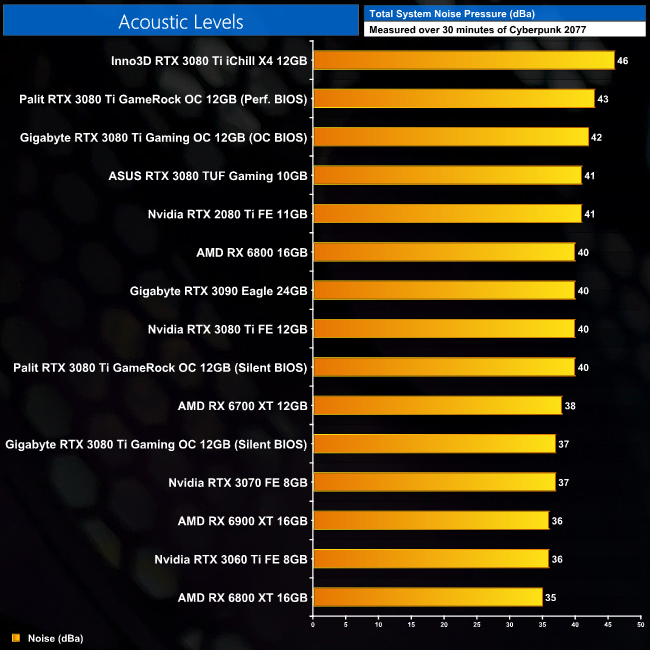
In terms of noise levels, there is again a good amount of variation between the cards tested. Top of the pile is the iChill X4 which produced 46dBa of noise with its fans spinning up to 59%, or 2150RPM. The Palit and Gigabyte models are next when using their OC, or Performance BIOS, as these modes do run a higher power limit than the Silent BIOS modes.
As for the Founders Edition, that hit 40dBa which is a bit louder than the likes of the RTX 3070 FE, but it's not terrible. Thankfully, we did get lower results from the Gaming OC's Silent BIOS, which produced 37dBa. It's still not exactly silent, but it is the lowest noise reading of all the RTX 3080 Tis we tested.
Update 20/07/21: Inno3D have been in touch and sent us a second iChill X4 to test – the acoustic results of which are below.
Our new sample produced noticeably less noise than our original, with the fans spinning at 53% – down from 59%. That put total noise output at 42dBa, so it's still relatively loud compared to the other models, but it is an improvement.
Following on from our stock thermal and acoustic testing, here we re-test the operating temperature of the GPU, but with noise levels normalised to 40dBa. This allows us to measure the efficiency of the overall cooling solution as varying noise levels as a result of more aggressive fan curves are no longer a factor.
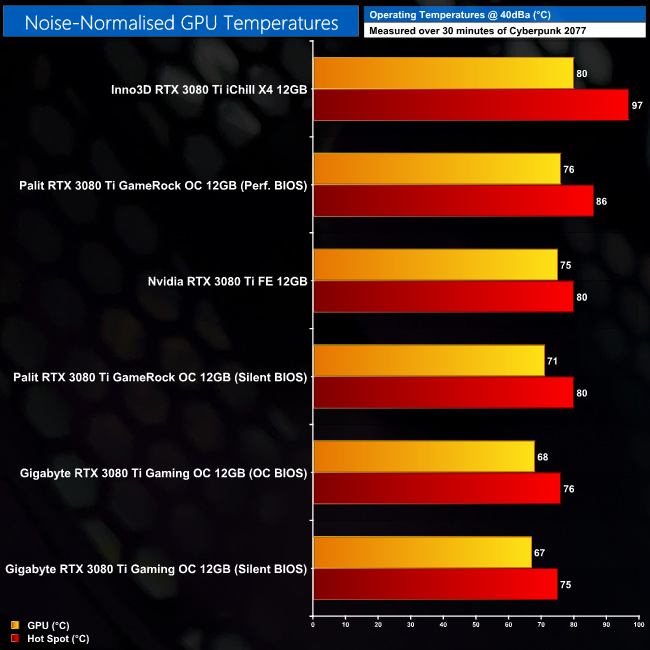
Noise-normalised testing is where we get the most apples-to-apples comparison, but do bear in mind different power limits can still affect things. That's proven by the Gaming OC's OC BIOS running 1C hotter than the card's Silent BIOS, despite both using the same fan speed – the OC BIOS has a 370W power limit, compared to 350W for the Silent BIOS. The same also goes for the GameRock OC, with its OC BIOS targeting 400W compared to 370W for the Silent BIOS. At the very top, the iChill X4 is suffering slightly, again with a large delta between the GPU and hot spot temperatures.
Noise-normalised memory temperatures meanwhile are mostly fine. Gigabyte is once again leading the pack, with both its BIOS keeping the memory at 76C when noise-normalised, while Palit saw a 6C delta between its two BIOS. The iChill X4's memory hit 90C, though that was still cooler than the Founders Edition.
Update 20/07/21: Inno3D have been in touch and sent us a second iChill X4 to test – the noise-normalised GPU thermal results of which are below. Noise-normalised memory temperatures remained the same.

Once more, the hot spot temperature is significantly reduced with our new sample. The iChill X4 still sits atop the chart, so it ran hottest when noise-normalised, but the delta between the GPU and hot spot temperatures is significantly reduced now.
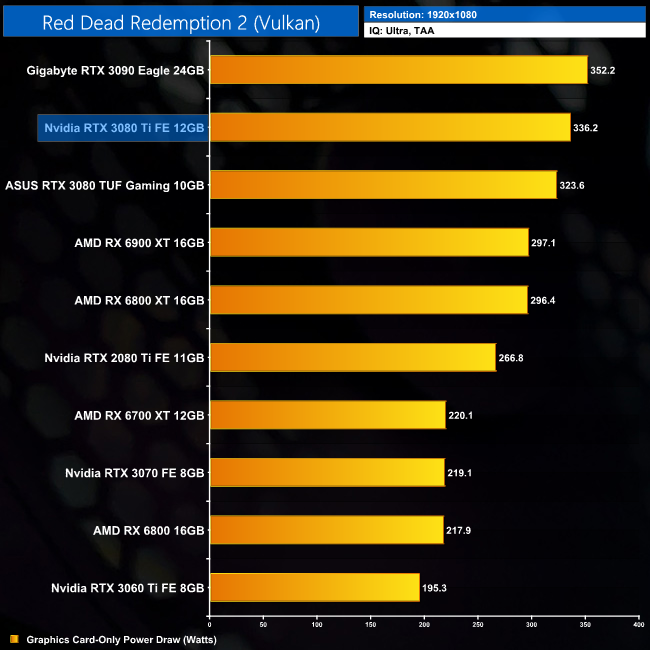
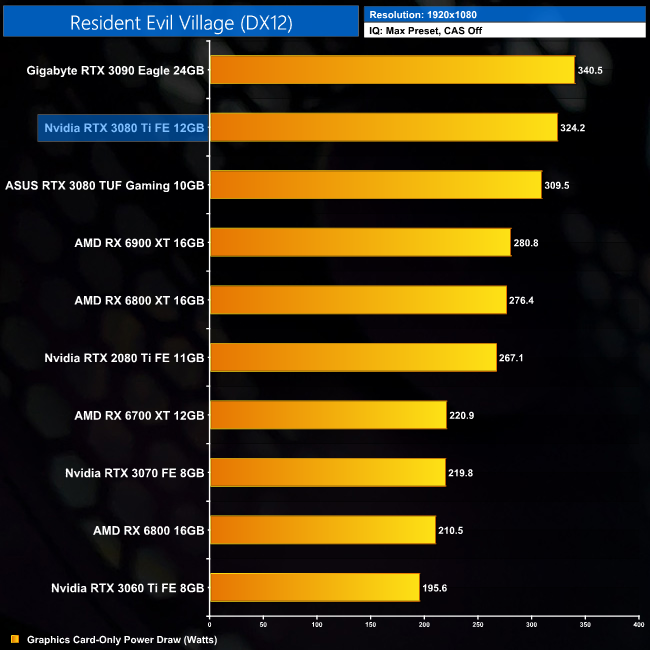
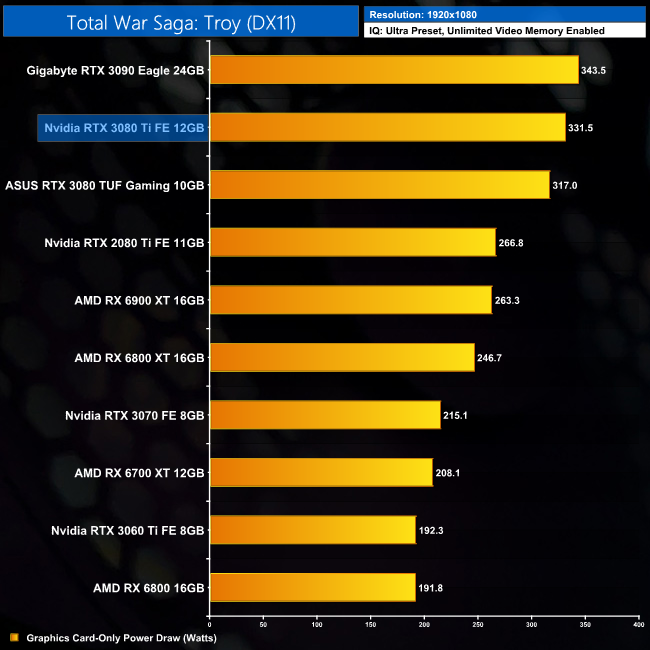
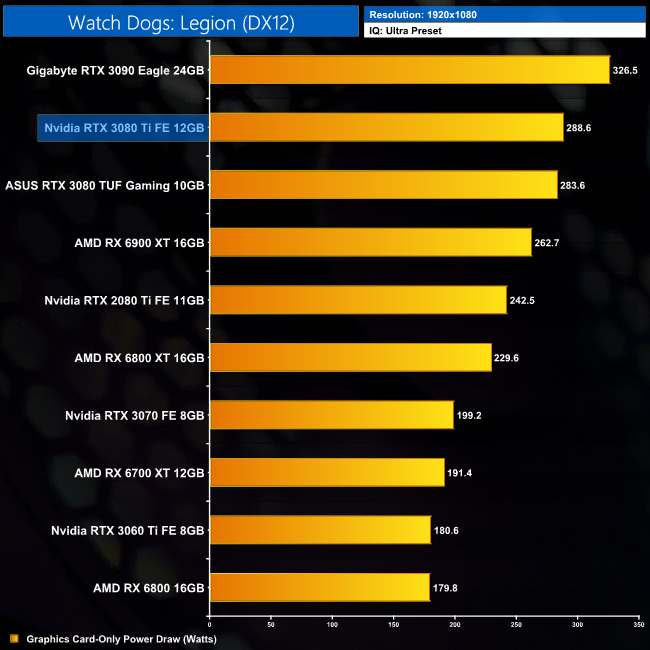
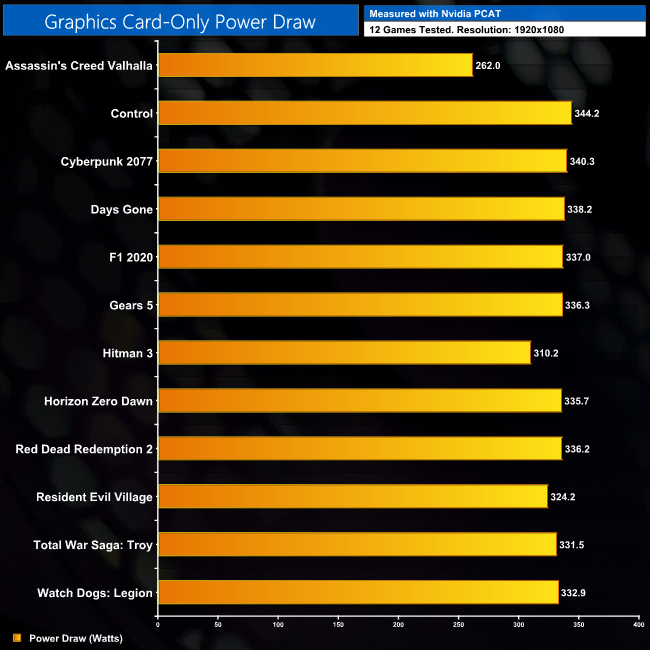
Here we present power draw figures for the graphics card-only, on a per-game basis for all twelve games we tested at 1080p. This is measured using Nvidia's Power Capture Analysis Tool, also known as PCAT. You can read more about our updated power draw testing methodology HERE.


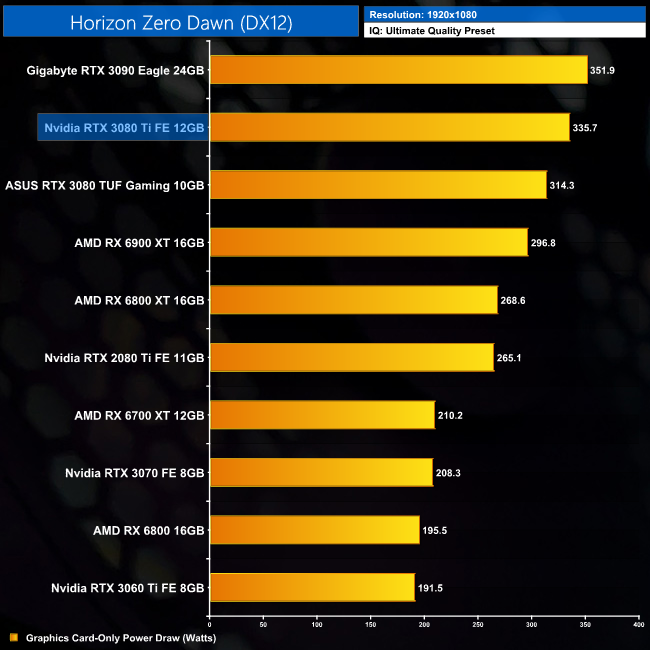
Click to enlarge.
Per-Game Results (RTX 3080 Ti Founders Edition Only) at 1080p:
12-Game Average at 1080p:
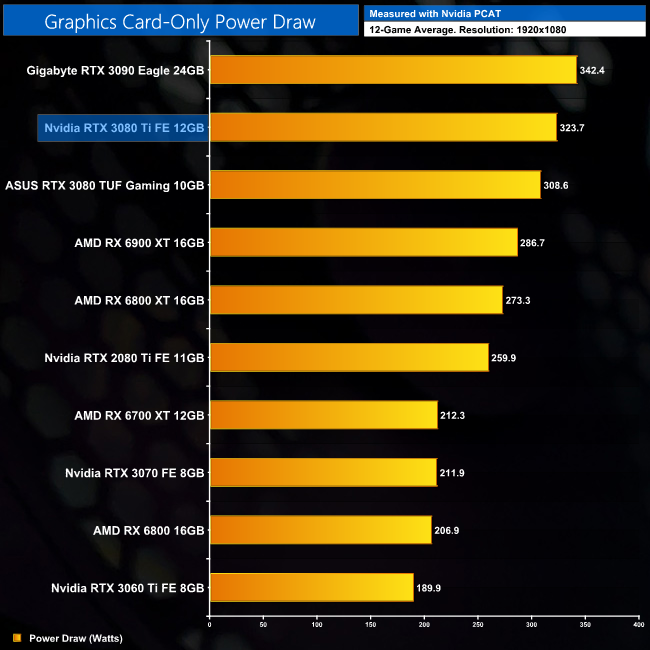
Despite a rated 350W TGP, power draw is typically lower than this at 1080p, where a GPU like the RTX 3080 Ti may not be fully utilised in certain titles. An average power reading of 323.7W illustrates this perfectly, though it's still the second highest result on our chart.
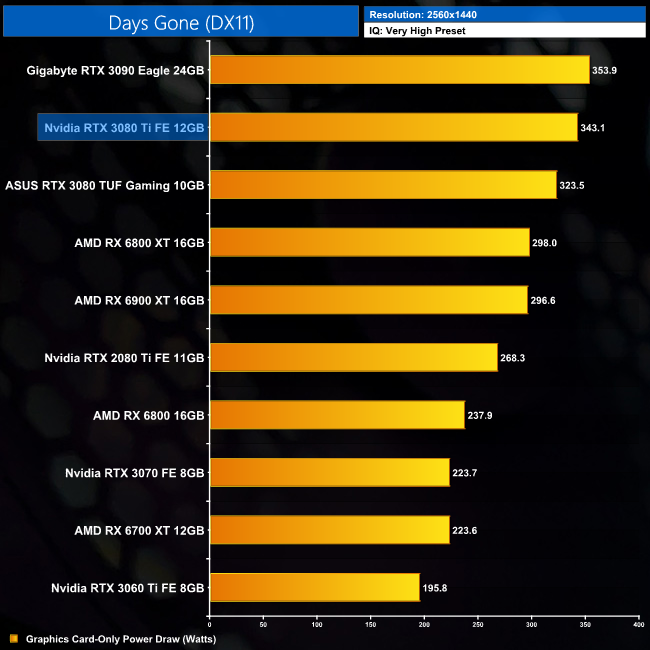
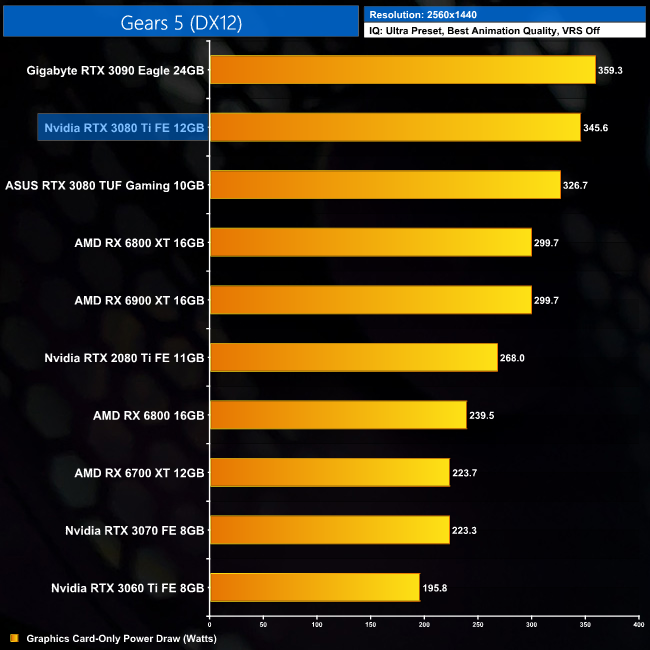
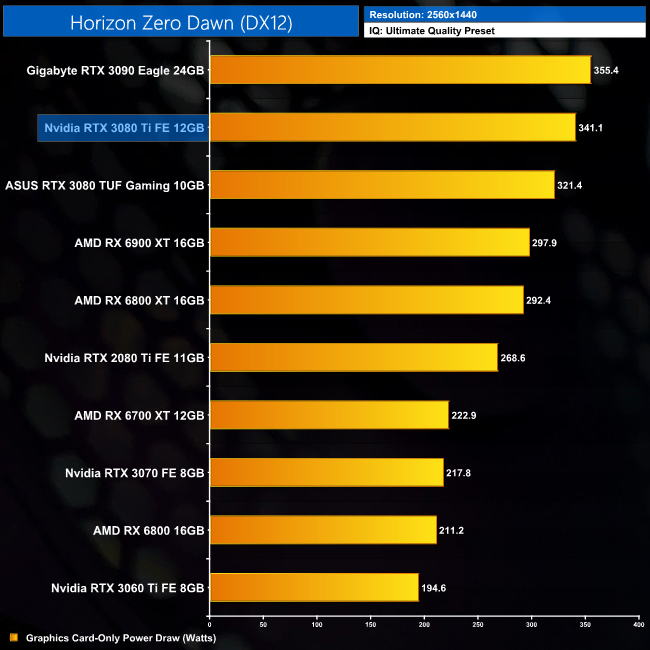
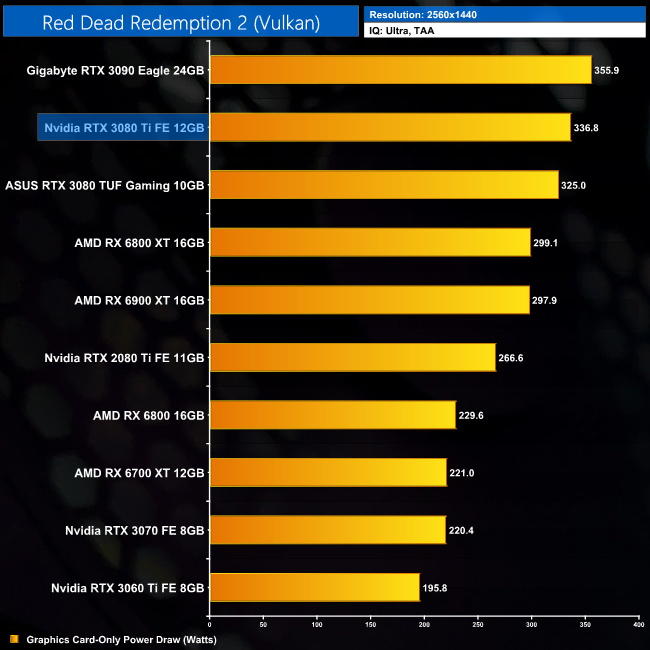
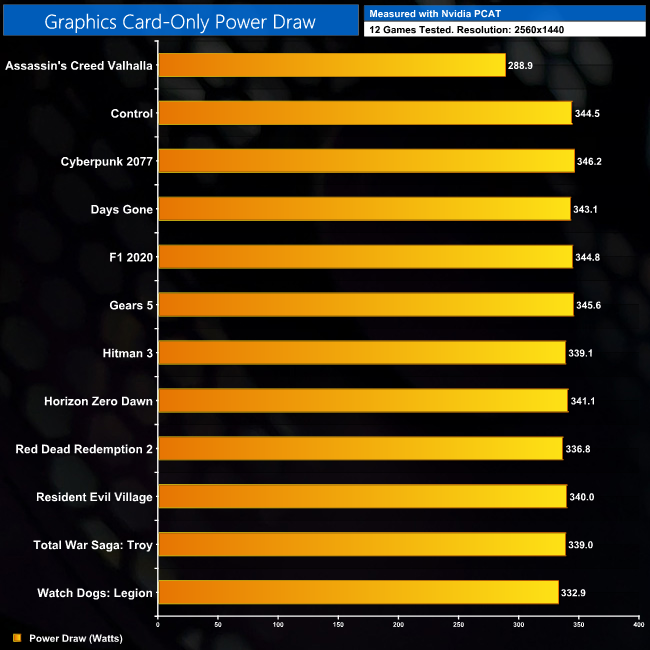
Here we present power draw figures for the graphics card-only, on a per-game basis for all twelve games we tested at 1440p. This is measured using Nvidia's Power Capture Analysis Tool, also known as PCAT. You can read more about our updated power draw testing methodology HERE.


Click to enlarge.
Per-Game Results (RTX 3080 Ti Founders Edition Only) at 1440p:
12-Game Average at 1440p:
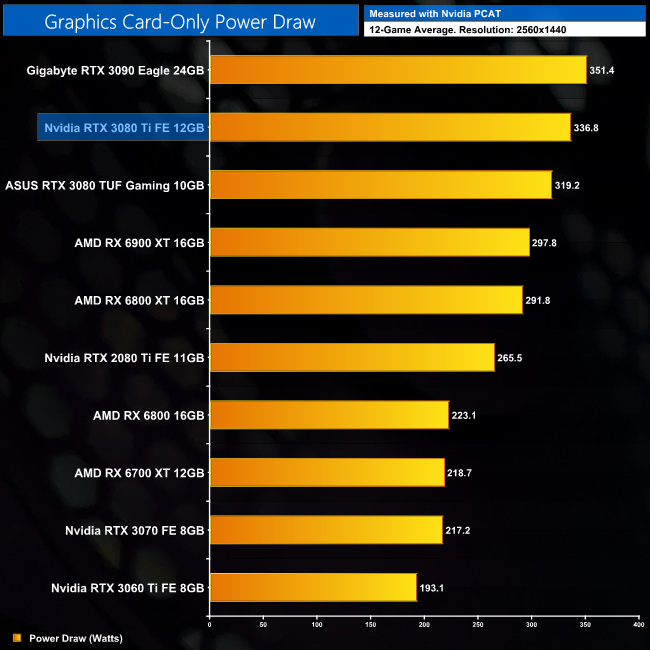
Power draw increases at 1440p to an average of 336.8W, though that's still 15-or-so Watts less than the RTX 3090.
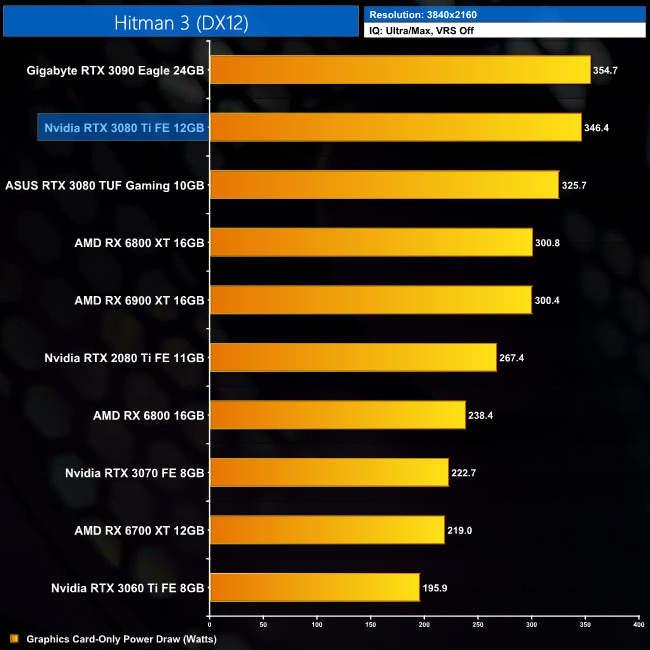
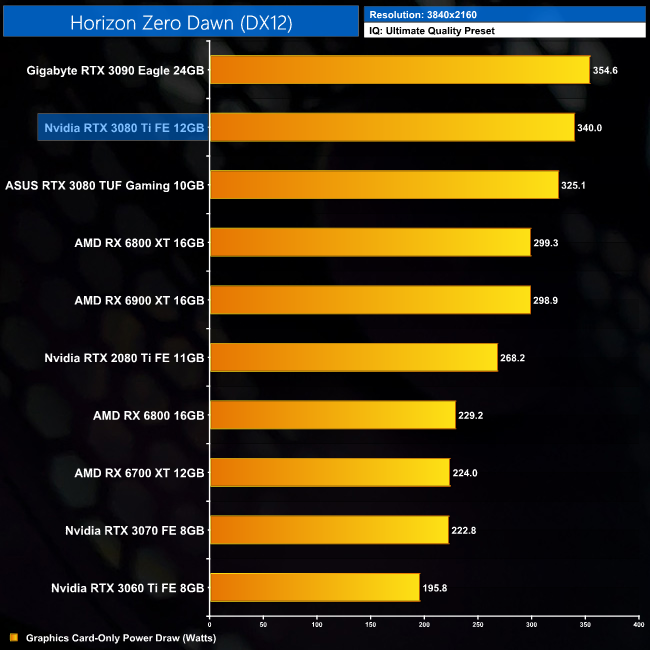
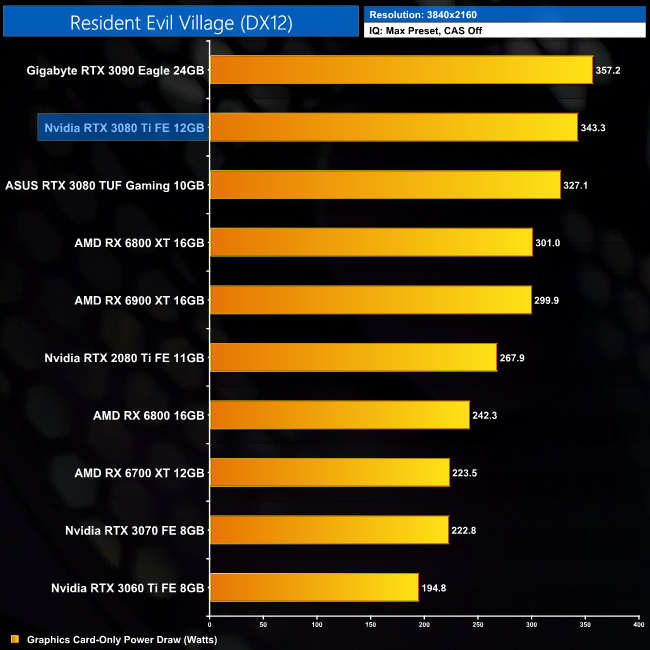
Here we present power draw figures for the graphics card-only, on a per-game basis for all twelve games we tested at 2160p (4K). This is measured using Nvidia's Power Capture Analysis Tool, also known as PCAT. You can read more about our updated power draw testing methodology HERE.


Click to enlarge.
Per-Game Results (RTX 3080 Ti Founders Edition Only) at 2160p (4K):
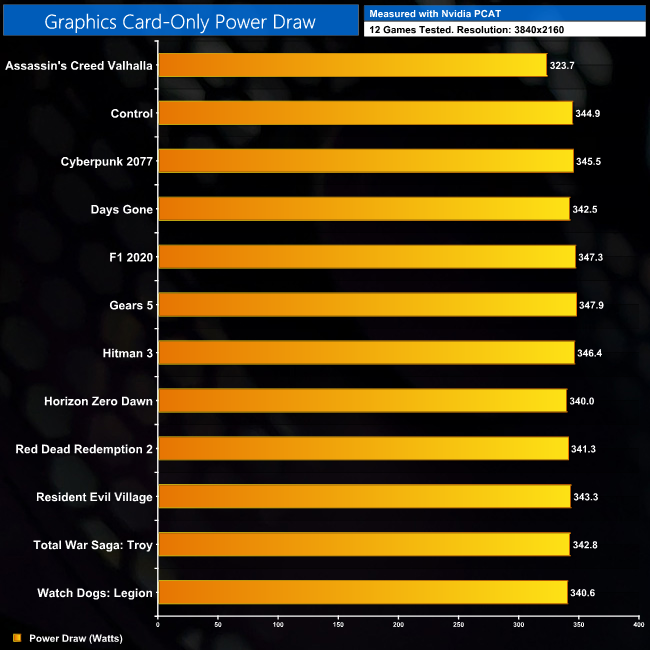
12-Game Average at 2160p (4K):
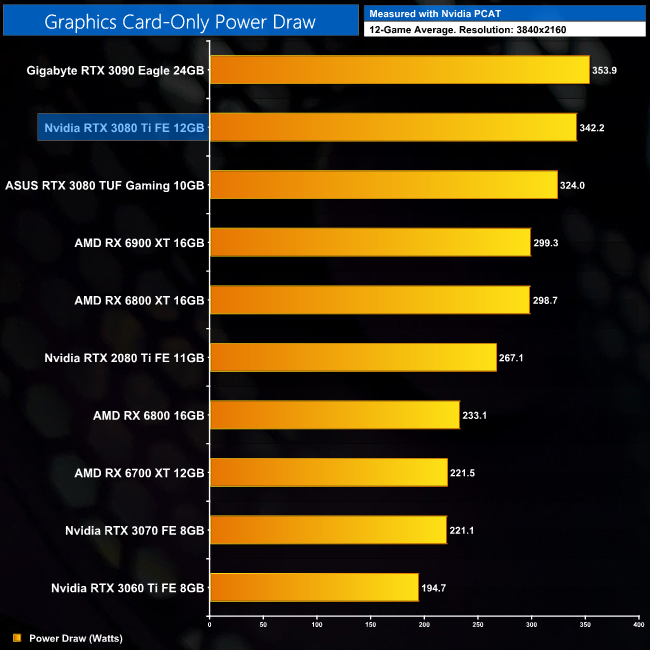
Up at 4K resolution, power draw is much more consistent across our 12-game sample, and we see an average draw of 342.2W. Again, this is still about 10W less than the RTX 3090, despite both sharing the same 350W TGP rating. We can likely put this small difference down to the fact RTX 3080 Ti has half the memory modules of the RTX 3090, which is likely to account for the small difference in power.
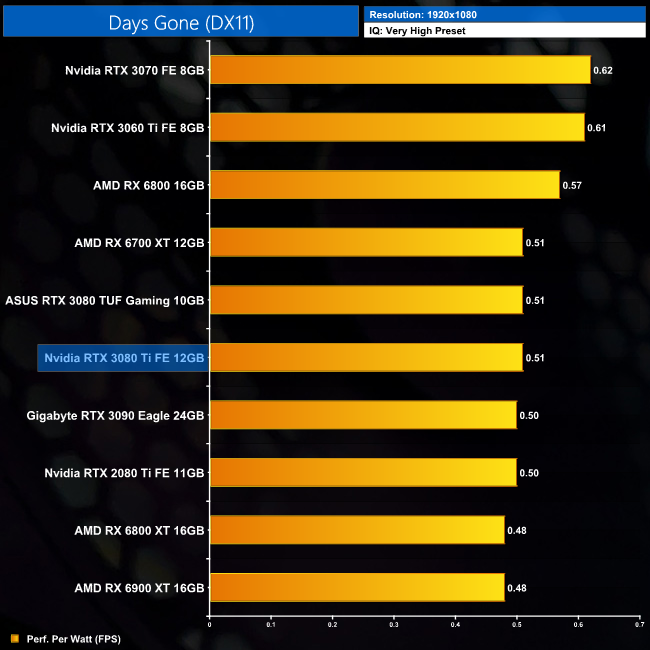
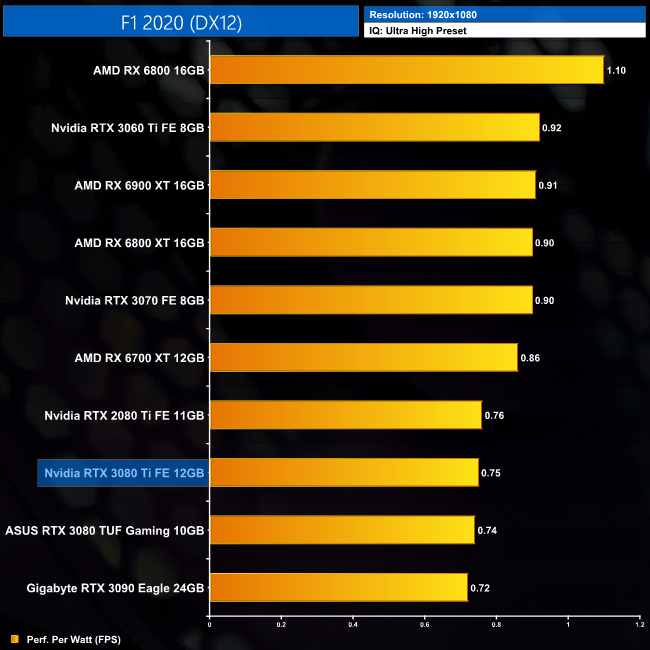
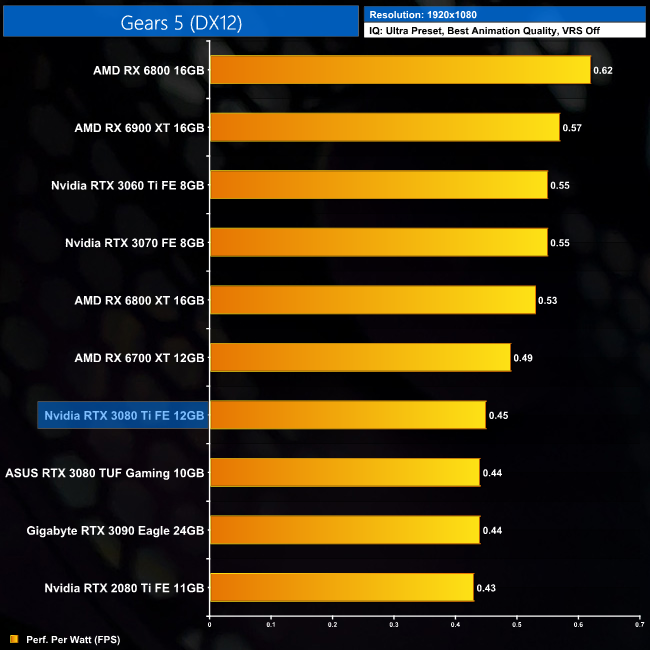
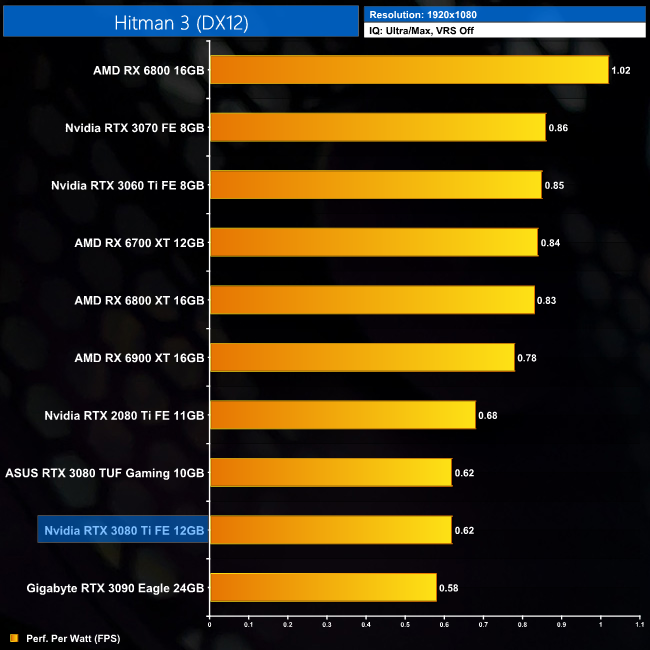
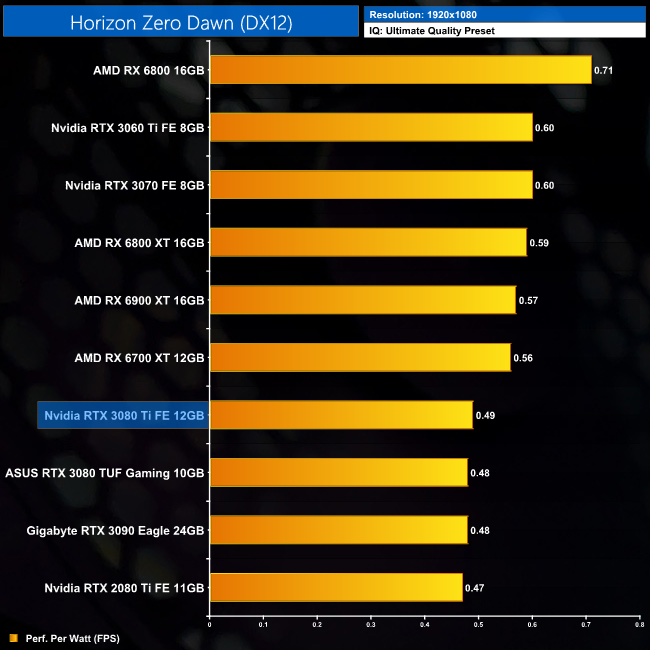
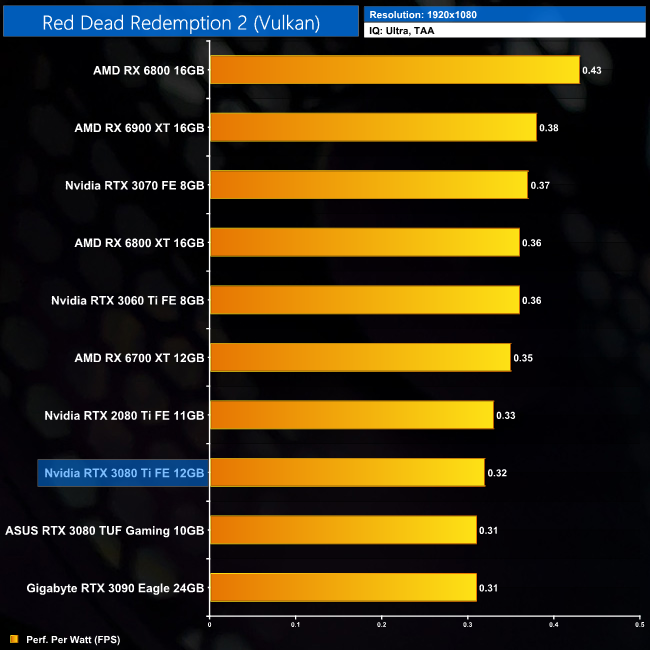
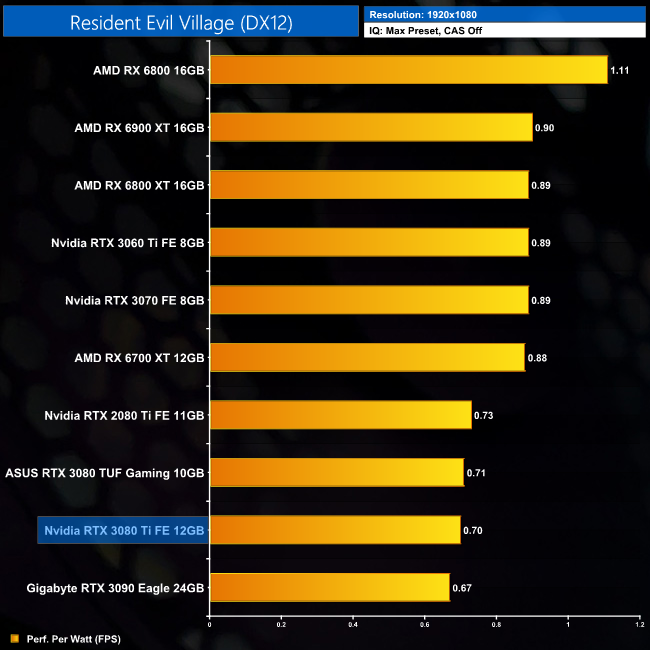
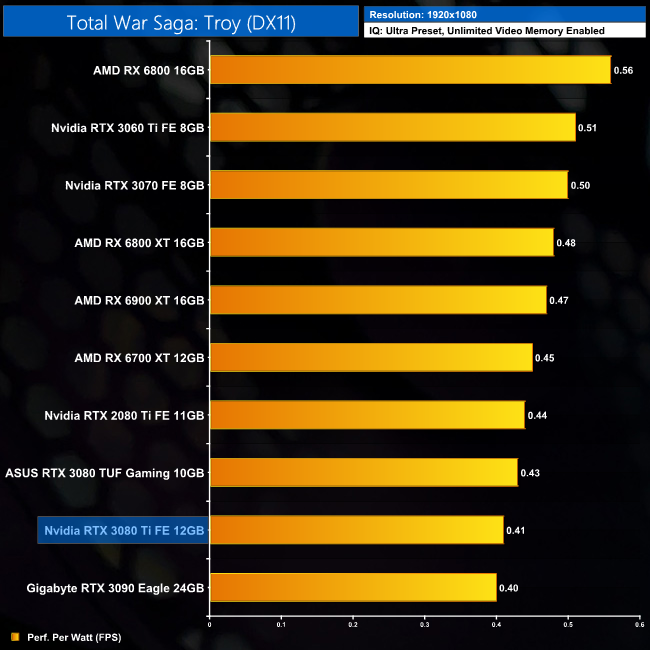
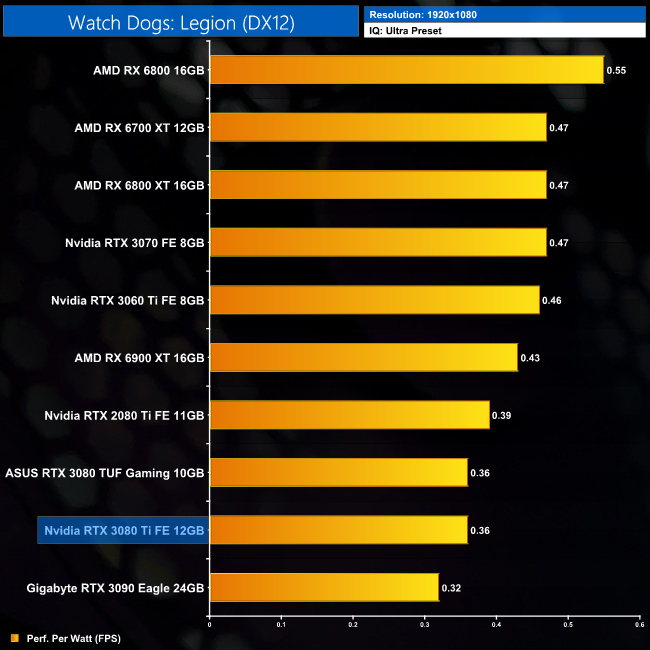
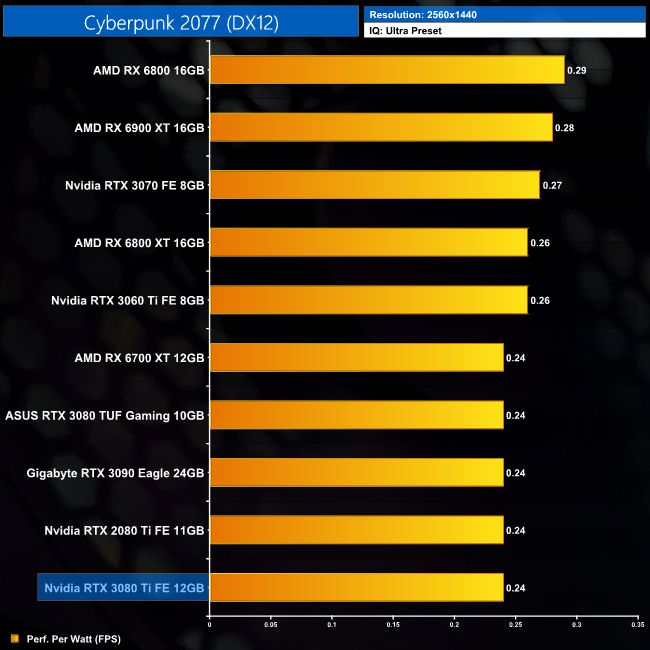
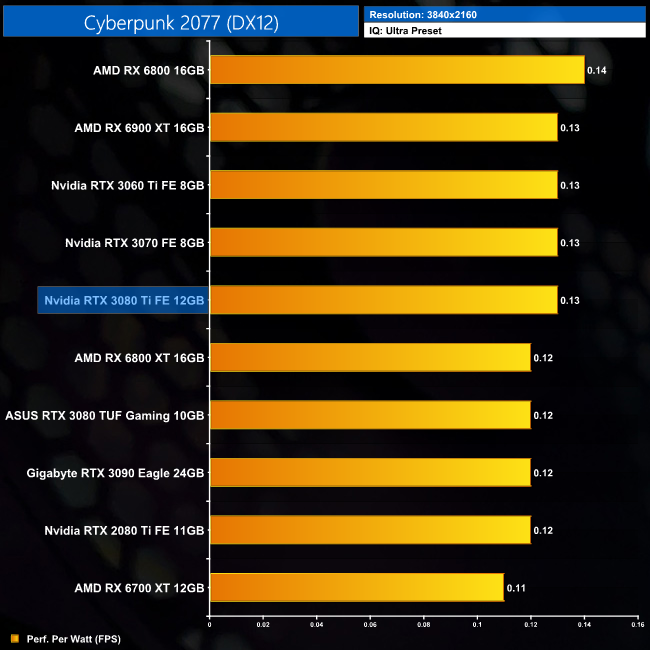
Using the graphics card-only power draw figures presented earlier in the review, here we present performance per Watt on a per-game basis for all twelve games we tested at 1080p.
Click to enlarge.
12-Game Average at 1080p:
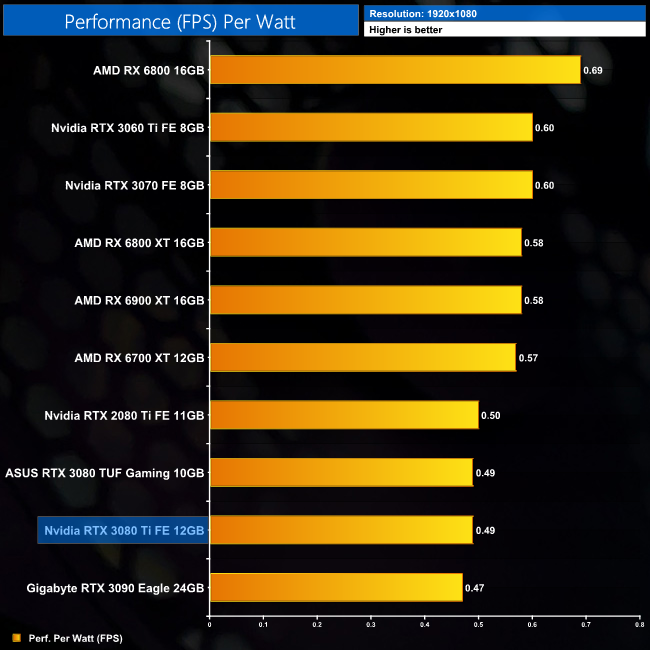
Performance per Watt at 1080p isn't particularly impressive, at least not compared to lower-power GPUs like the RTX 3060 Ti – though that is to be expected from a GPU like the RTX 3080 Ti which is really geared for use at higher resolutions.
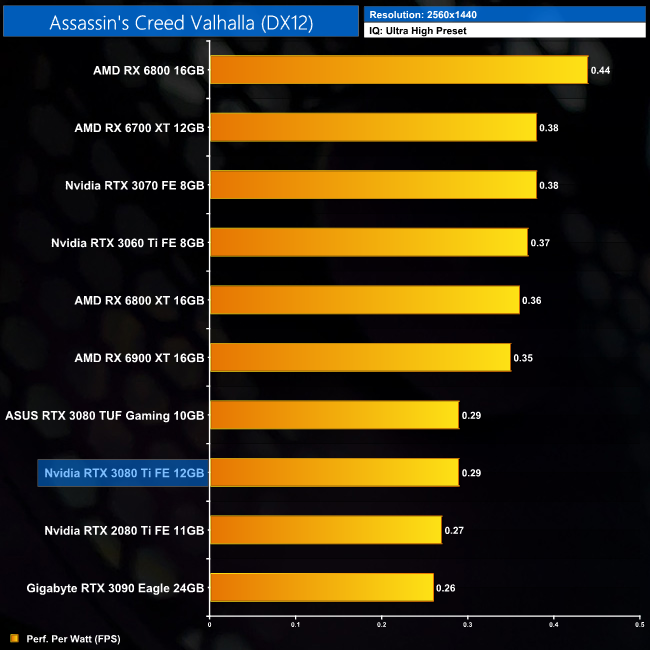
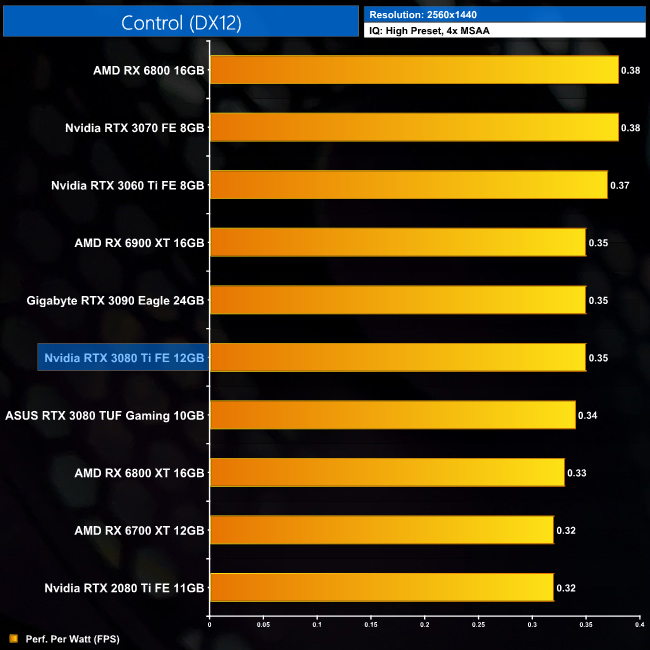
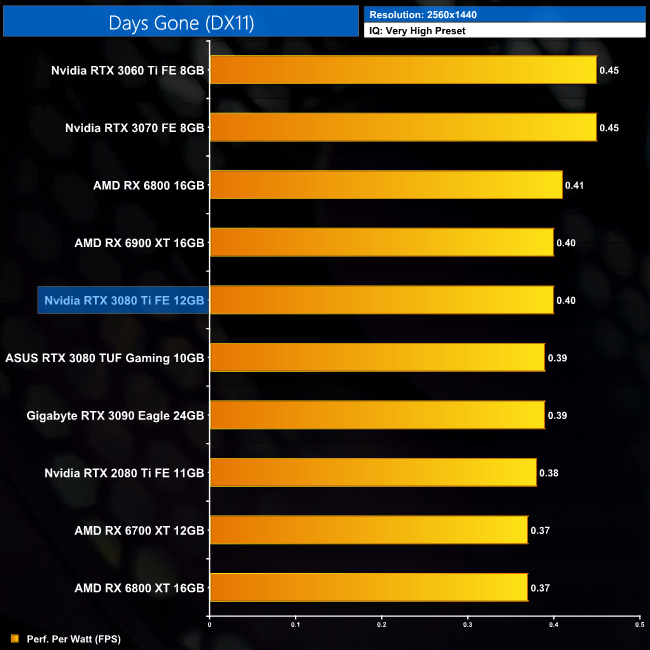
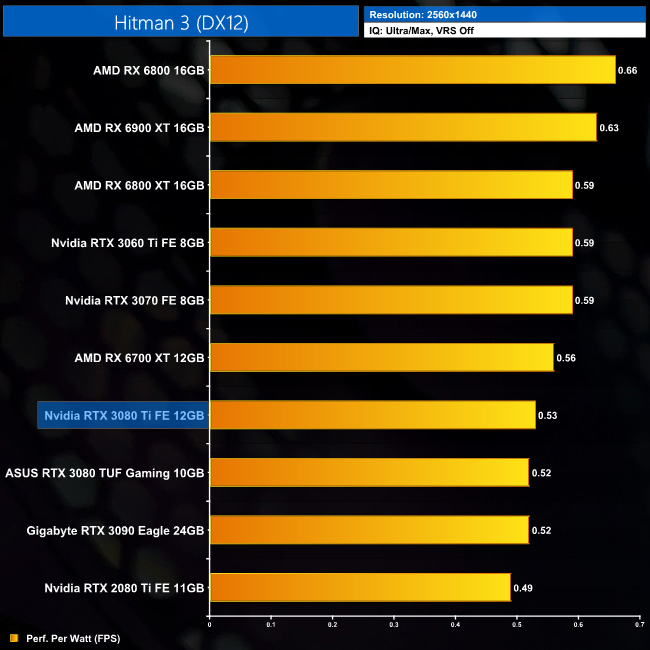
Using the graphics card-only power draw figures presented earlier in the review, here we present performance per Watt on a per-game basis for all twelve games we tested at 1440p.

Click to enlarge.
12-Game Average at 1440p:
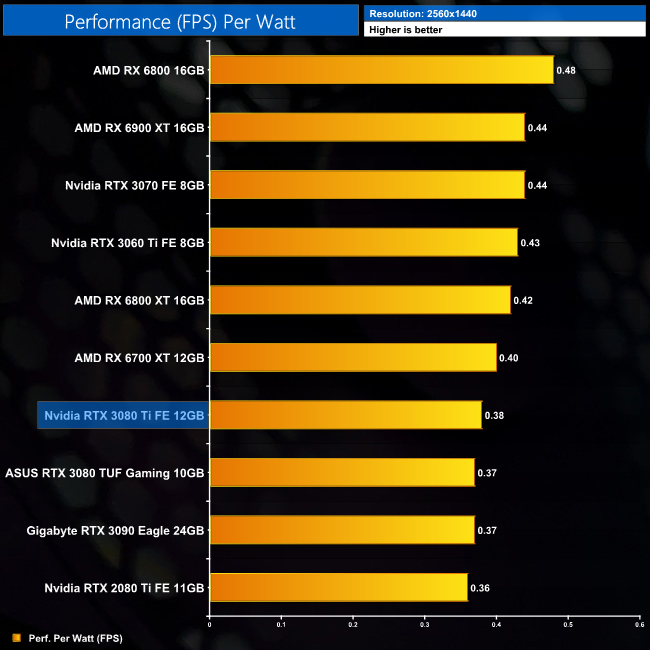
Power efficiency is better at 1440p, with less of a a gap between the RTX 3080 Ti and the likes of the RX 6700 XT. It's also fractionally more efficient than the RTX 3090 at this resolution.
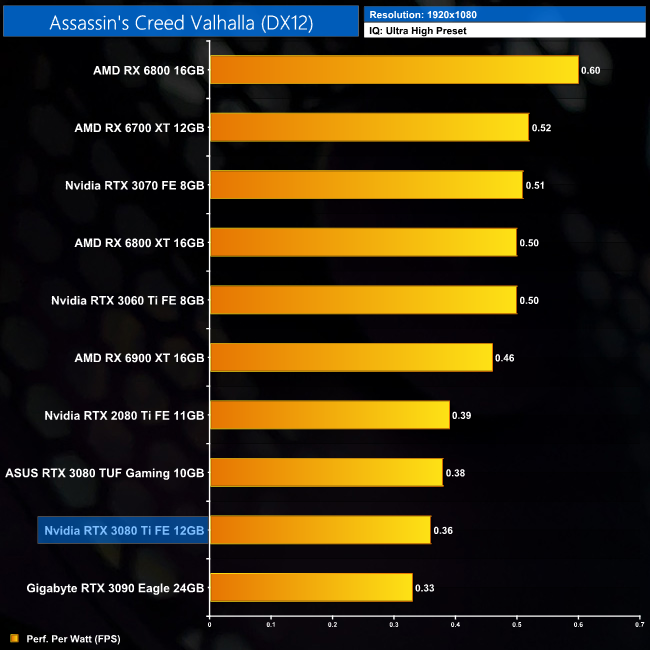
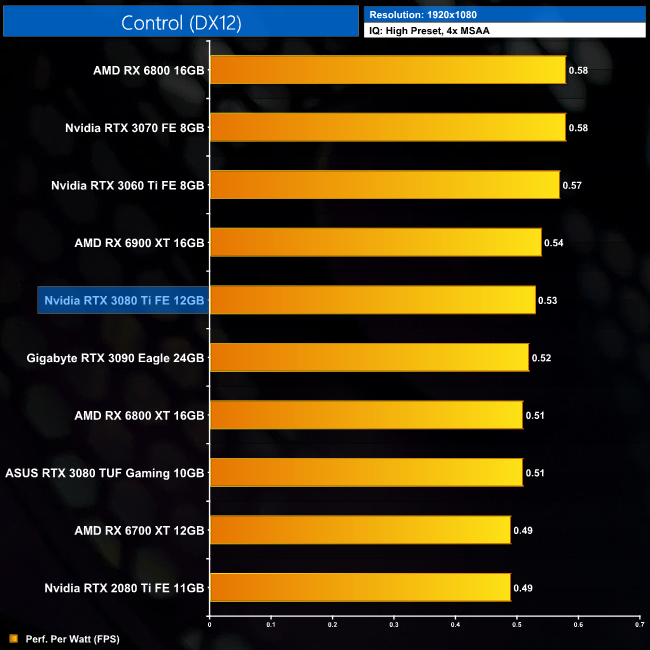
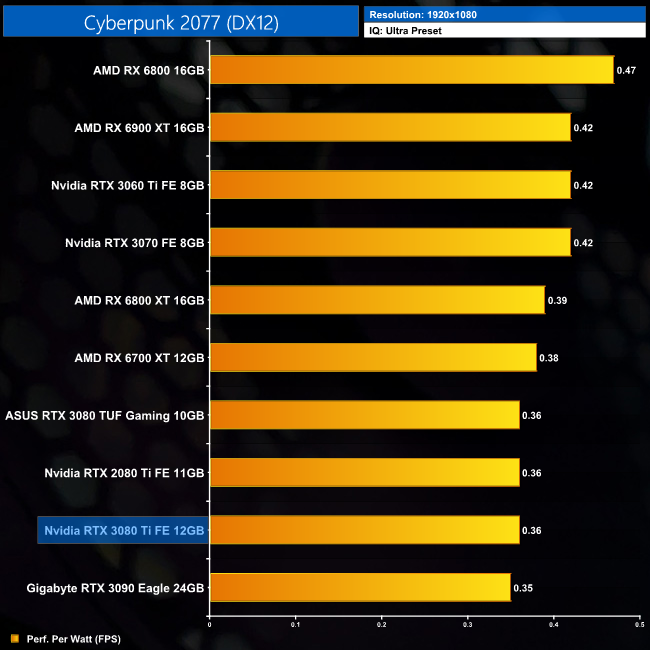
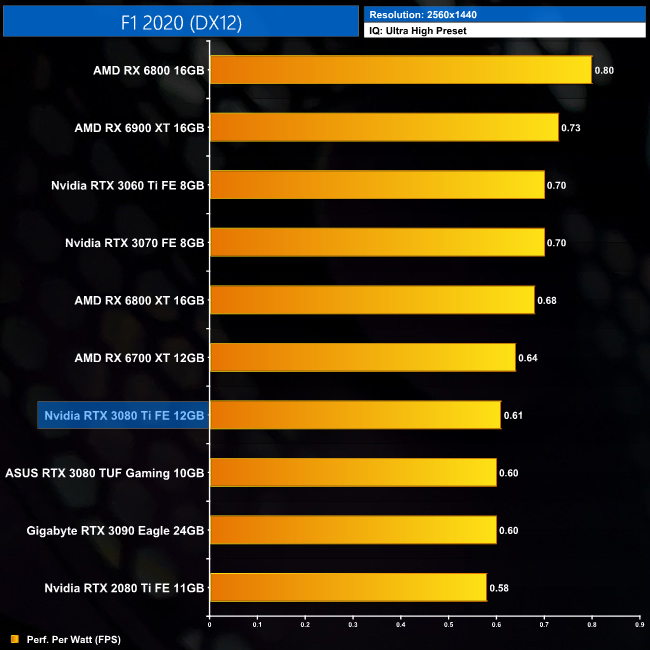
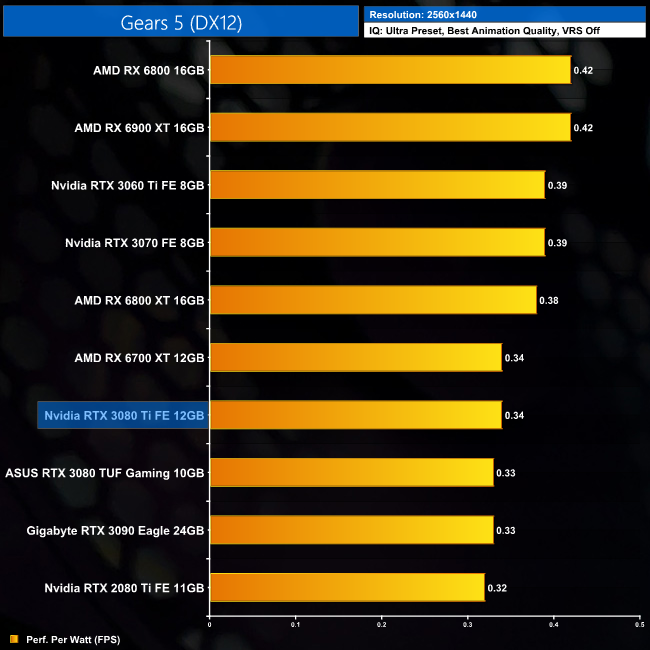
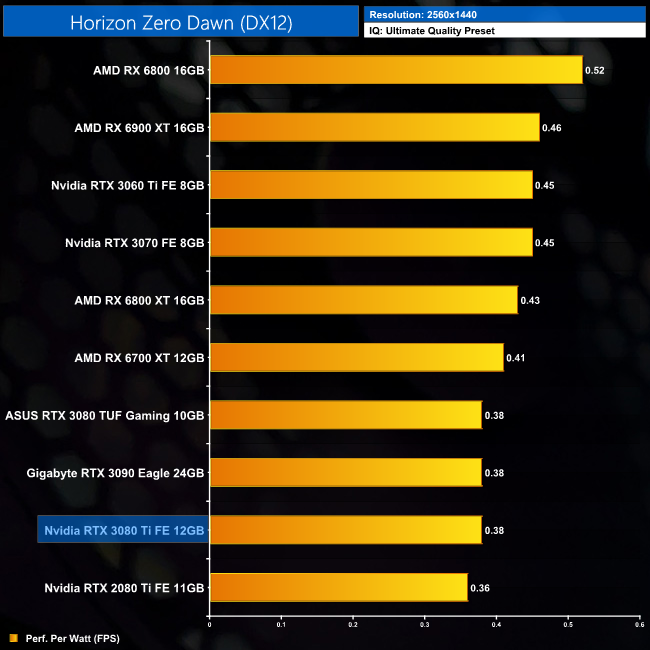
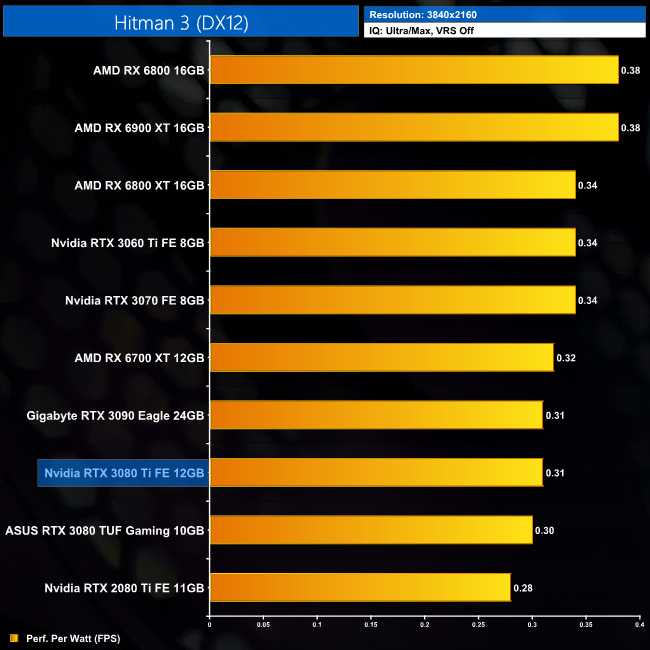
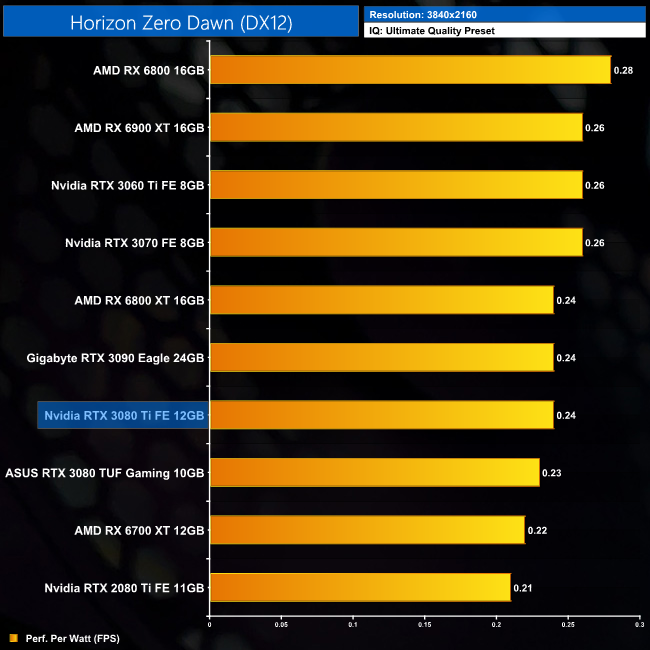
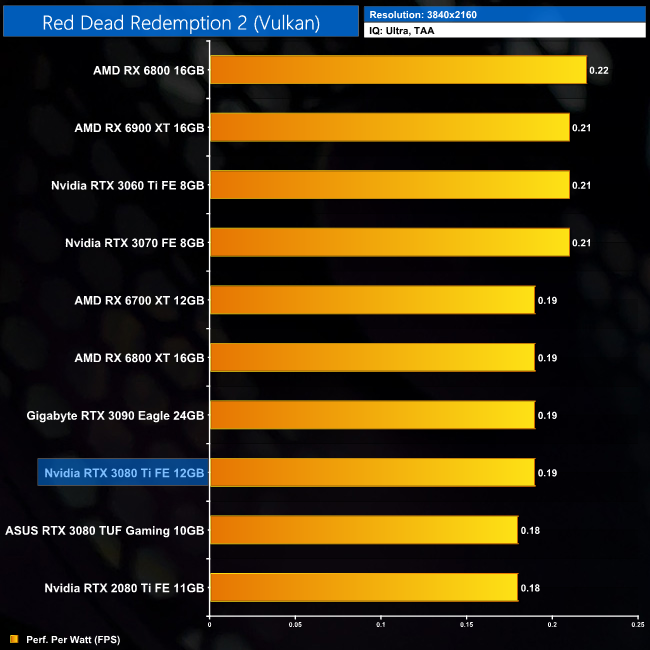
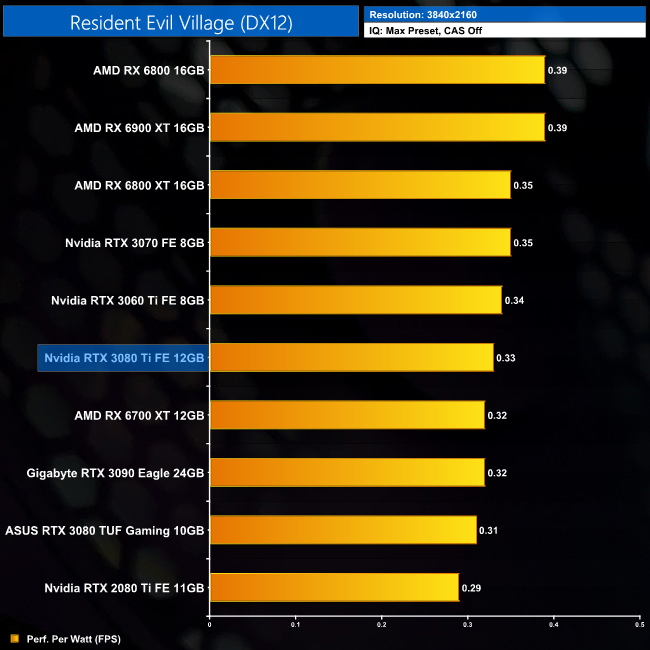
Using the graphics card-only power draw figures presented earlier in the review, here we present performance per Watt on a per-game basis for all twelve games we tested at 2160p (4K).
Click to enlarge.
12-Game Average at 2160p (4K):
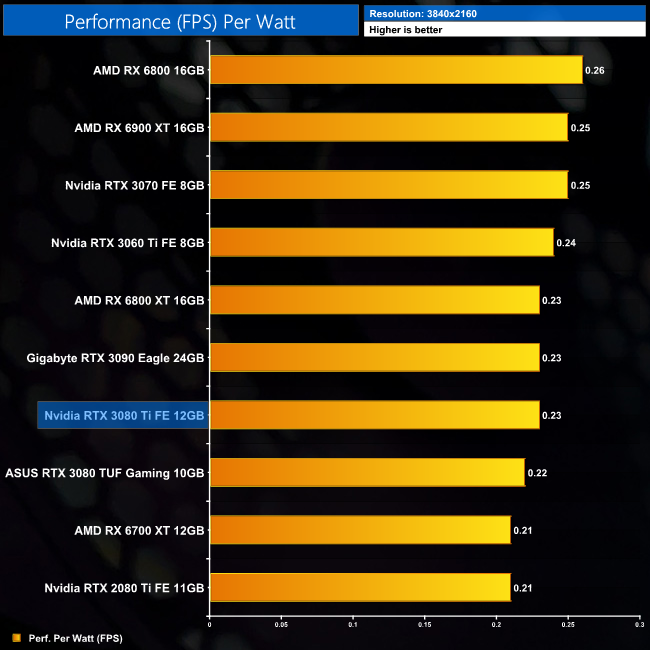
At 4K, performance per Watt numbers converge, and there aren't huge differences between any of the GPUs tested. That said, RX 6800 does prove the most efficient GPU, while the RTX 3080 Ti and RTX 3090 are both on level pegging.
We measure system-wide power draw from the wall while running Cyberpunk 2077 for 30 minutes.
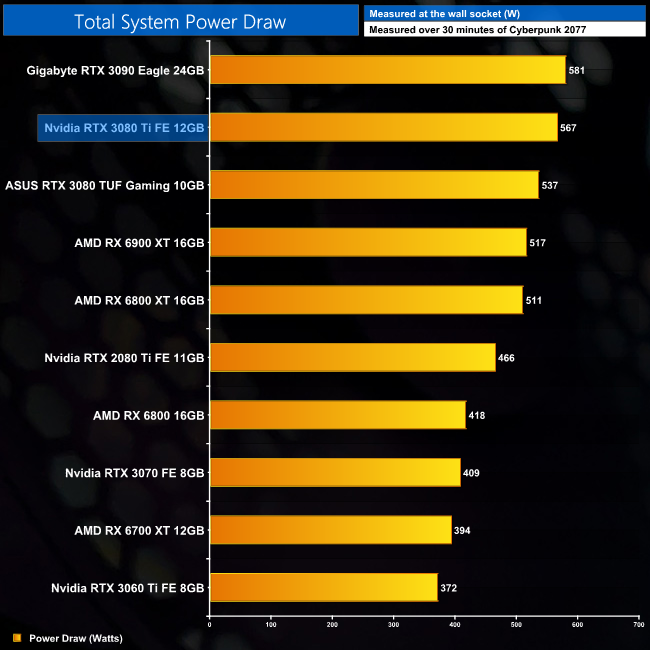
For those interested in total system power draw, with our i9-10900K running flat out at 5.1GHz, we observed power draw just below the 570W level. Nvidia officially recommends a 750W PSU for the RTX 3080 Ti which seems sensible to give you a bit of extra headroom.
Using the average frame rate data presented earlier in the review, here we look at the cost per frame using the UK MSRP launch prices for each GPU.
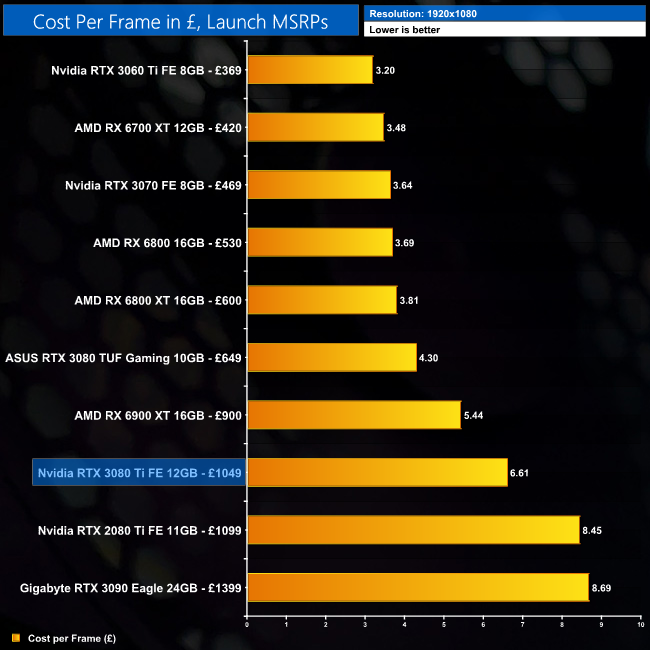
Our cost per frame data is based on UK MSRPs, which we know is meaningless right now as real-world prices are far higher. It does give us an idea of how the manufacturer wants to position their product however, so we will include the data for those interested.
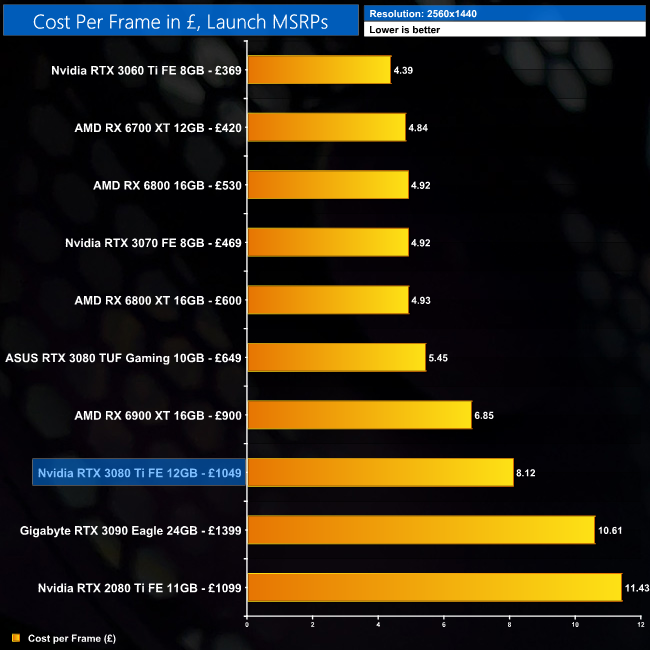
At 1440p, the RTX 3080 Ti has a cost per frame of £8.12, so it's about 23% cheaper per frame when compared to the RTX 3090. Value is still very tough against the RTX 3080 at £650, however, which itself is over 30% cheaper per frame up against the RTX 3080 Ti.
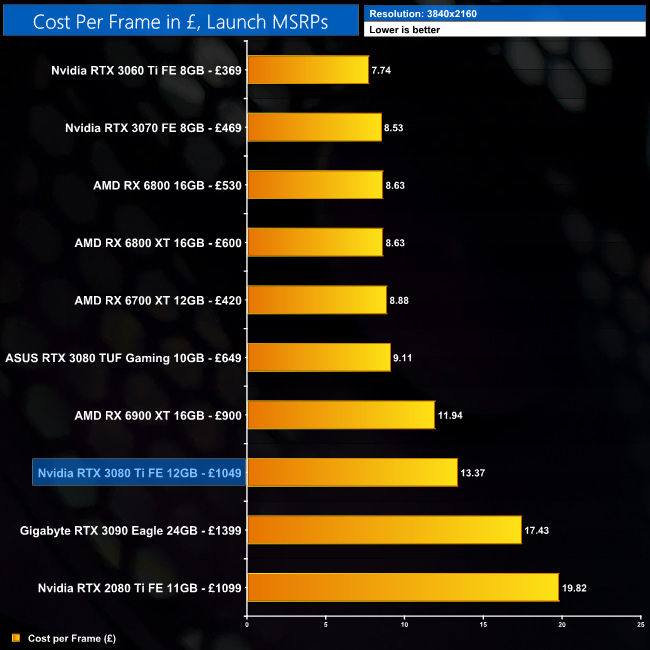
It's a similar story at 4K. Yes, the value proposition is improved from the RTX 3090, but RTX 3090 was never good value to begin with. The cost per frame increase of 47% compared to the RTX 3080 is what causes problems, especially considering the RTX 3080 Ti is only 10% faster on average.
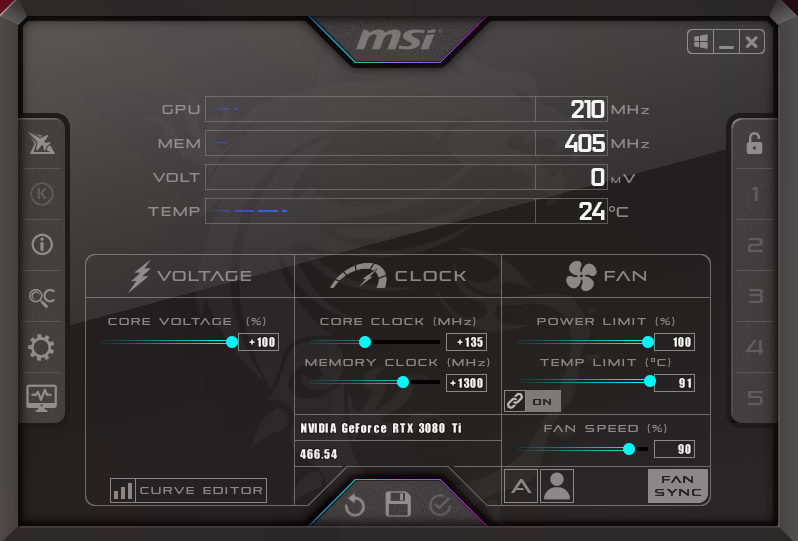
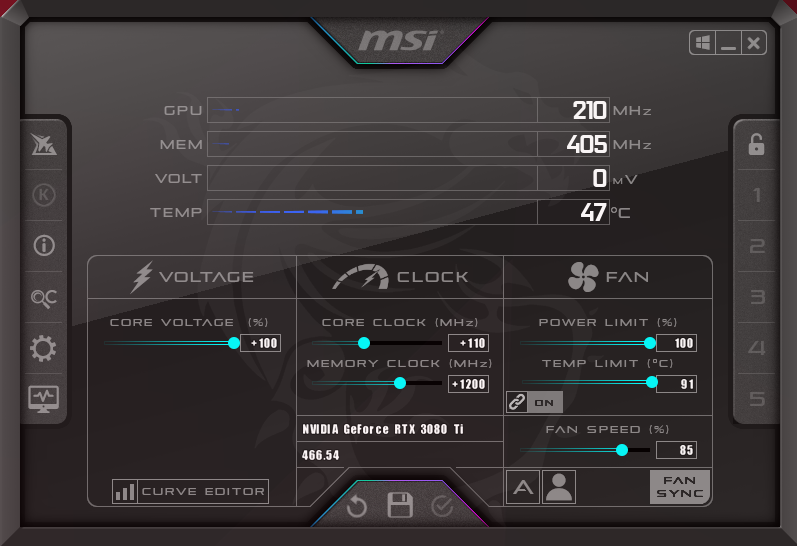
For our manual overclocking tests, we used MSI Afterburner. Our best results are as below.
Nvidia RTX 3080 Ti Founders Edition:

Gigabyte RTX 3080 Ti Gaming OC:
Inno3D RTX 3080 Ti iChill X4:
Palit RTX 3080 Ti GameRock OC:
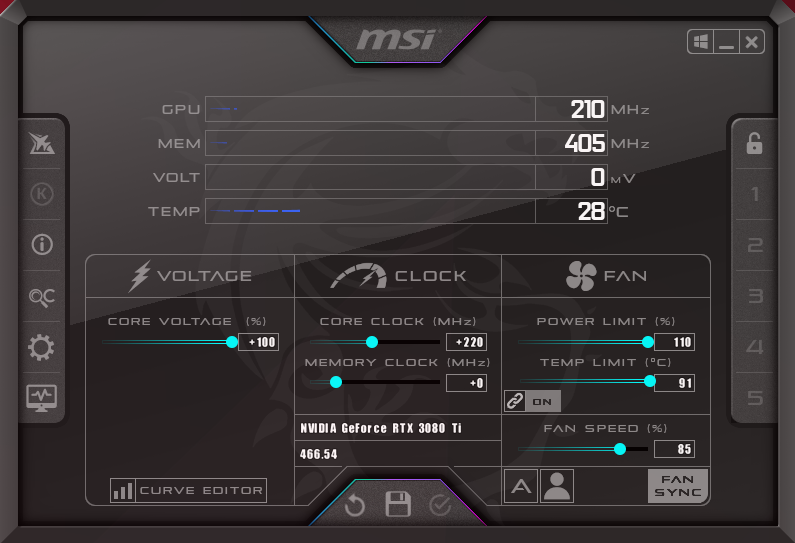
Three of our cards overclocked to basically the same speeds, with the exception being the Inno3D iChill X4. We were able to add 110MHz to the core, but as the power limit cannot be adjusted above 350W, the GPU was unable to sustain as higher of a clock speed as the other three cards.
That difference is reflected in the benchmarks, as the iChill X4 wasn't able to quite match performance of the other three cards. It still provided a small boost over stock clocks, but nothing major.
Even the likes of the Palit and Gigabyte cards didn't massive increases to frame rates, with anything from 4-9% being observed in our tests. This really is just typical of Ampere, with fairly limited headroom overall.
After plenty of rumours and leaks, Nvidia officially announced the RTX 3080 Ti at virtual Computex 2021, and today reviews go live ahead of retail availability on June 3. With an MSRP of £1049/$1199, the RTX 3080 Ti is targeting those who aren't quite willing to stump up £1399/$1499 for the RTX 3090, but still want something faster than the RTX 3080.
And faster than the RTX 3080 it is. Averaged across our 12-game sample, we found the RTX 3080 Ti to be 10% faster at 4K. In fact, it is very close to the RTX 3090, proving just 2% slower on average at both 1440p and 4K. This does make complete sense though, as the RTX 3080 Ti only has two SMs fewer than the RTX 3090, while the memory and GPU are also clocked fractionally slower.
Versus its AMD competition, here we found some fairly significant swings. Against the RX 6900 XT, for instance, the RTX 3080 Ti came in anywhere from 19% slower (in Assassin's Creed Valhalla at 1440p), to 22% faster (Days Gone at 4K). Averaged across our twelve games though, the Nvidia GPU is 4% faster at 4K.
It is, for all intents and purposes, RTX 3090-level performance, never coming in more than 3% slower compared to that GPU. In fact, on several occasions the three AIB cards we also tested today were able to exceed the RTX 3090's performance thanks to their factory overclocks. That just goes to show how small the differences are between these GPUs.
As mentioned, our testing today was not limited to just the Founders Edition, but we also assessed Gigabyte's RTX 3080 Ti Gaming OC, the Palit RTX 3080 Ti GameRock OC and the Inno3D RTX 3080 Ti iChill x4. Thermals from these cards were generally solid, with the Gaming OC offering the best balance of performance to noise, with the Palit proving slightly hotter when noise-normalised, but still offering good results. We did have some trouble with the iChill X4 however, as it saw the hot spot temperature hit 97C, and it also ran the hottest when noise-normalised. *See update below.*
We also used this review to debut our new GPU power testing methodology, so if you want to see power draw figures on a per-game and per-resolution basis, you can find that starting on page 31 of this review. In a nutshell, the RTX 3080 Ti didn't quite live up to its 350W rating, instead drawing about 10W less than the RTX 3090 when testing at 4K.
That small differential, coupled with the fractional difference in gaming performance, means overall efficiency of the RTX 3080 Ti and RTX 3090 is equal. Nvidia's lower-power parts, like the RTX 3060 Ti, are more efficient, but it's always been the case that you need to squeeze out a bit more juice to get the most performance.
We also tried overclocking all four of our RTX 3080 Ti cards, with results proving pretty consistent across the board, with typical performance gains of between 4-9%. This lines up well with what we've come to expect from other Ampere GPUs, so while you can extract some extra performance, don't be expecting a radical boost to frame rates.
All in all, the fact that the RTX 3080 Ti is able to offer what is essentially RTX 3090 levels of performance, but for a £350 discount, may well seem like a positive taken in isolation. The thing I don't like about the RTX 3080 Ti however, is that is is another GA102 GPU, but this time priced over £1000. Every GA102 die going into the RTX 3080 Ti could have been a more affordable £650 RTX 3080, and I know which I think is the better deal.
In an ordinary market, with plentiful supply, it wouldn't be a problem – this situation would simply result in more choice for the consumer. Right now however, it is nigh impossible to get your hands on an RTX 3080, and the addition of another GA102 SKU certainly won't make that any easier.
Even if we do take these MSRPs at face value, I do also have to question who this GPU is really for. It seems to be aimed at the customer who wants more performance than the RTX 3080, who is unwilling to spend £1399 on the RTX 3090, but would happily still spend over £1000 for a card which is 10% faster than the RTX 3080.
Maybe there is some small group of buyers who fit that description, but the way I see it, if you’re already spending over £1000 on a GPU, value for money surely does not matter to you, so you may as well get the best of the best and go for the RTX 3090. If you do care about value, then the RTX 3080 Ti looks very poor against the RTX 3080 as it's 10% faster but 61% more expensive.
The thing is, the market is in such a state right now that any GPU will sell, regardless of pricing or supposed value. It makes complete business sense from Nvidia's perspective to do what they are doing. For gamers though, the addition of another GA102 SKU priced at over £1000 is hardly the news we wanted to hear right now.
Discuss on our Facebook page HERE.
Update 20/07/21: Inno3D have been in touch and sent us a second iChill X4 to test, the result of which we have added into this review. The second card is a better performer, offering lower noise levels and improved thermal results, backing up our original suggestion of a mounting pressure issue with the first sample we tested. The iChill X4 still proved the hottest-running 3080 Ti we tested however, so our original conclusions stands, but the second sample we tested was a clear improvement over the first.
Nvidia RTX 3080 Ti Founders Edition
Pros
- Smart Founders Edition styling.
- Cool, quiet and compact.
- Basically as fast as RTX 3090.
Cons
- Very poor value against the RTX 3080 (based on MSRP).
- Another GA102 SKU surely means less allocation for RTX 3080.
Score:

Gigabyte RTX 3080 Ti Gaming OC
Pros
- Best performing AIB tested in terms of noise-normalised thermals.
- Dual-BIOS.
- Factory overclock puts performance even closer to RTX 3090.
Cons
- Likely to be even more expensive than the baseline MSRP.
Score:
Inno3D RTX 3080 Ti iChill X4
Pros
- Unique aesthetic.
- Factory overclock puts performance even closer to RTX 3090.
Cons
High hot spot temperature of 97C was observed when gaming.*See update above.*- Memory temperature also ran the hottest of the three AIB cards tested.
- No dual-BIOS.
- Likely to be even more expensive than the baseline MSRP.
Score:
Palit RTX 3080 Ti GameRock OC
Pros
- Dazzling RGB implementation.
- Dual-BIOS
- Factory overclock puts performance even closer to RTX 3090.
Cons
- Not quite as cool as the Gaming OC
- Likely to be even more expensive than the baseline MSRP.
Score:
KitGuru says: RTX 3080 Ti is a very fast GPU, but at over £1000 you may as well go all-out on the RTX 3090, or save some cash with the RTX 3080.