
Enthusiasts have pinned hope on AMD's eagerly-anticipated Ryzen 5 line-up as a set of processors that can offer competitive performance at an affordable, mid-range price point. The price range in question is currently dominated by Intel's quad-core Core i5 CPUs that do not feature Hyper-Threading and only get an unlocked multiplier for the highest-end option.
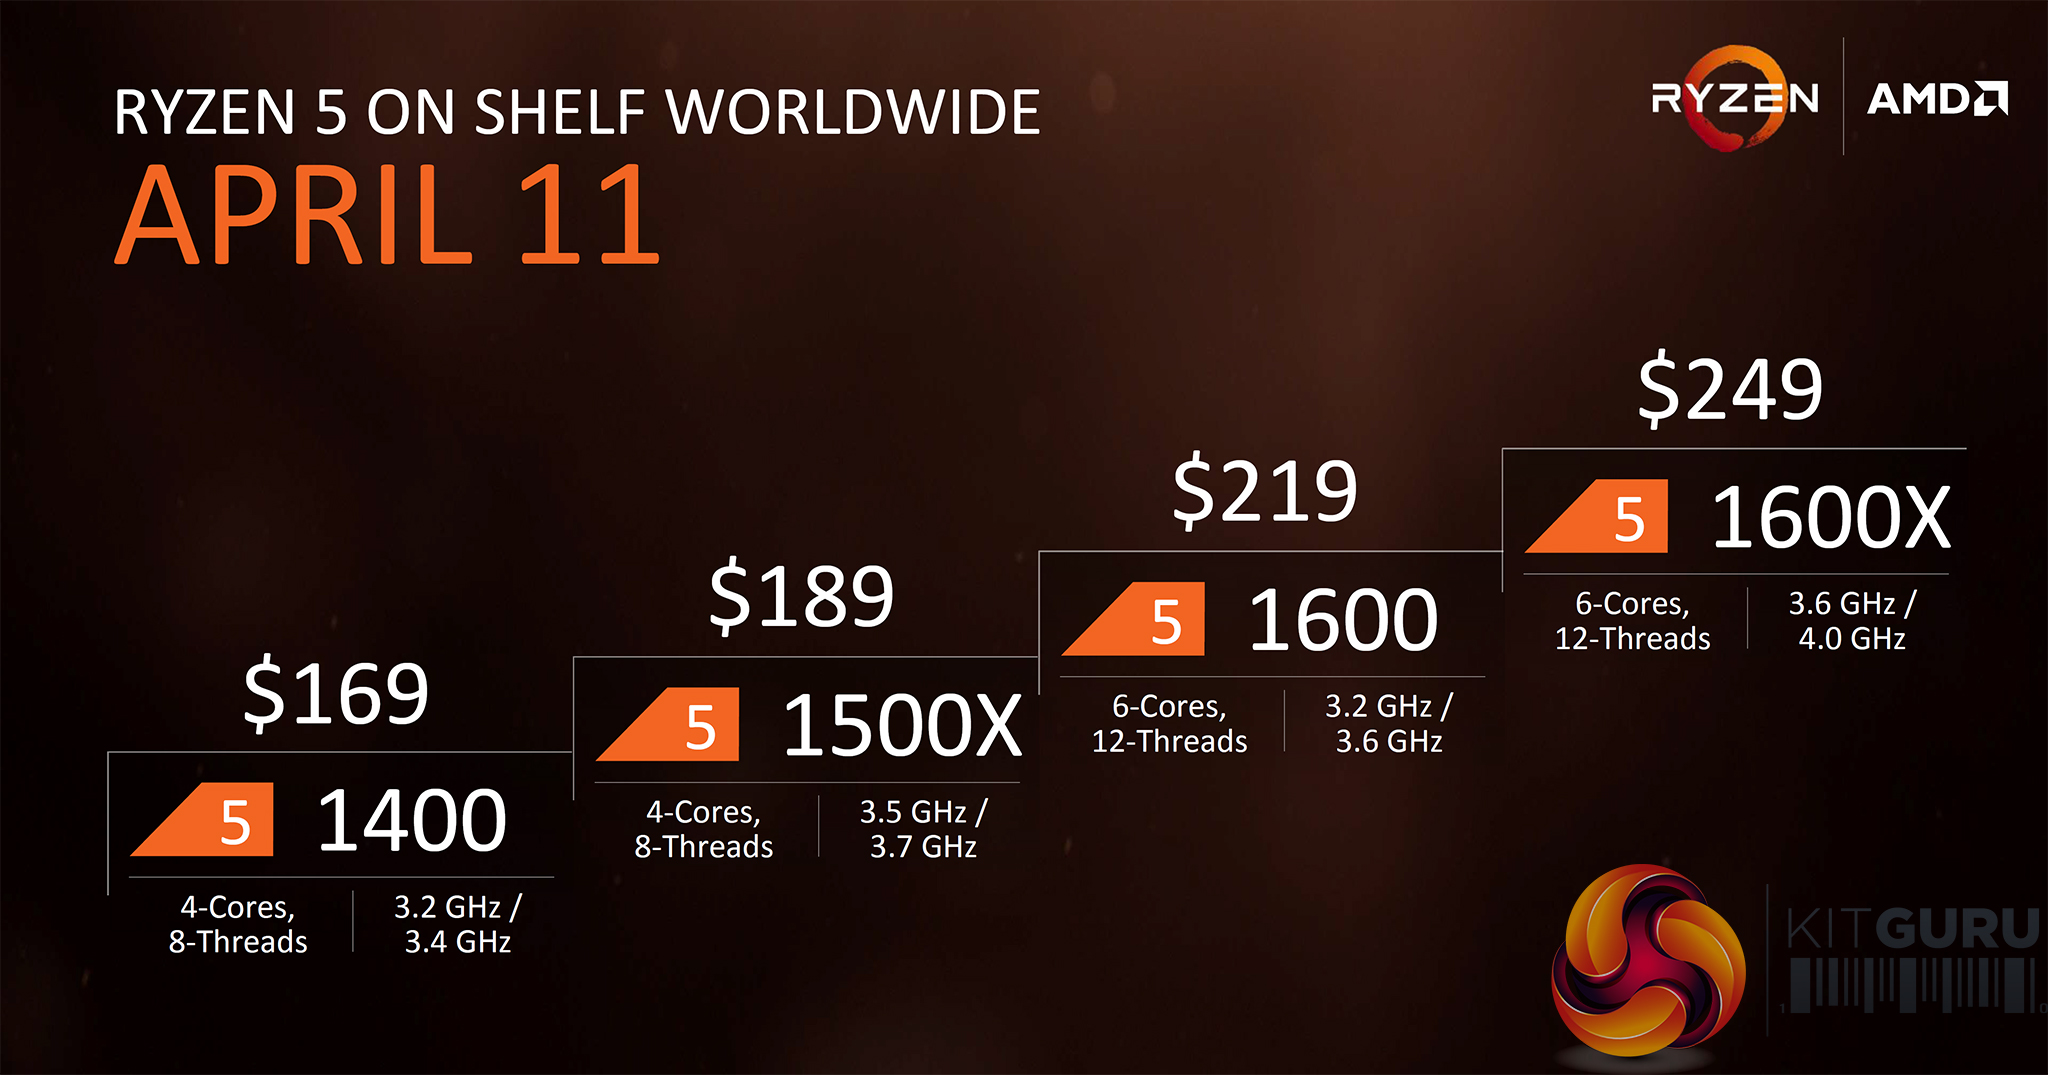
AMD is taking the fight to Intel's $242 multiplier-unlocked 3.8-4.2GHz Core i5-7600K 4C4T processor with a 6C12T Ryzen 5 1600X clocked at 3.6-4.0GHz and retailing for $249. With overclocking the Core i5-7600K to 4.8GHz+ being a known simple procedure, can AMD's Ryzen 5 1600X leverage its 50% increase in cores and three-times as many threads to compete against the current mid-range champion?
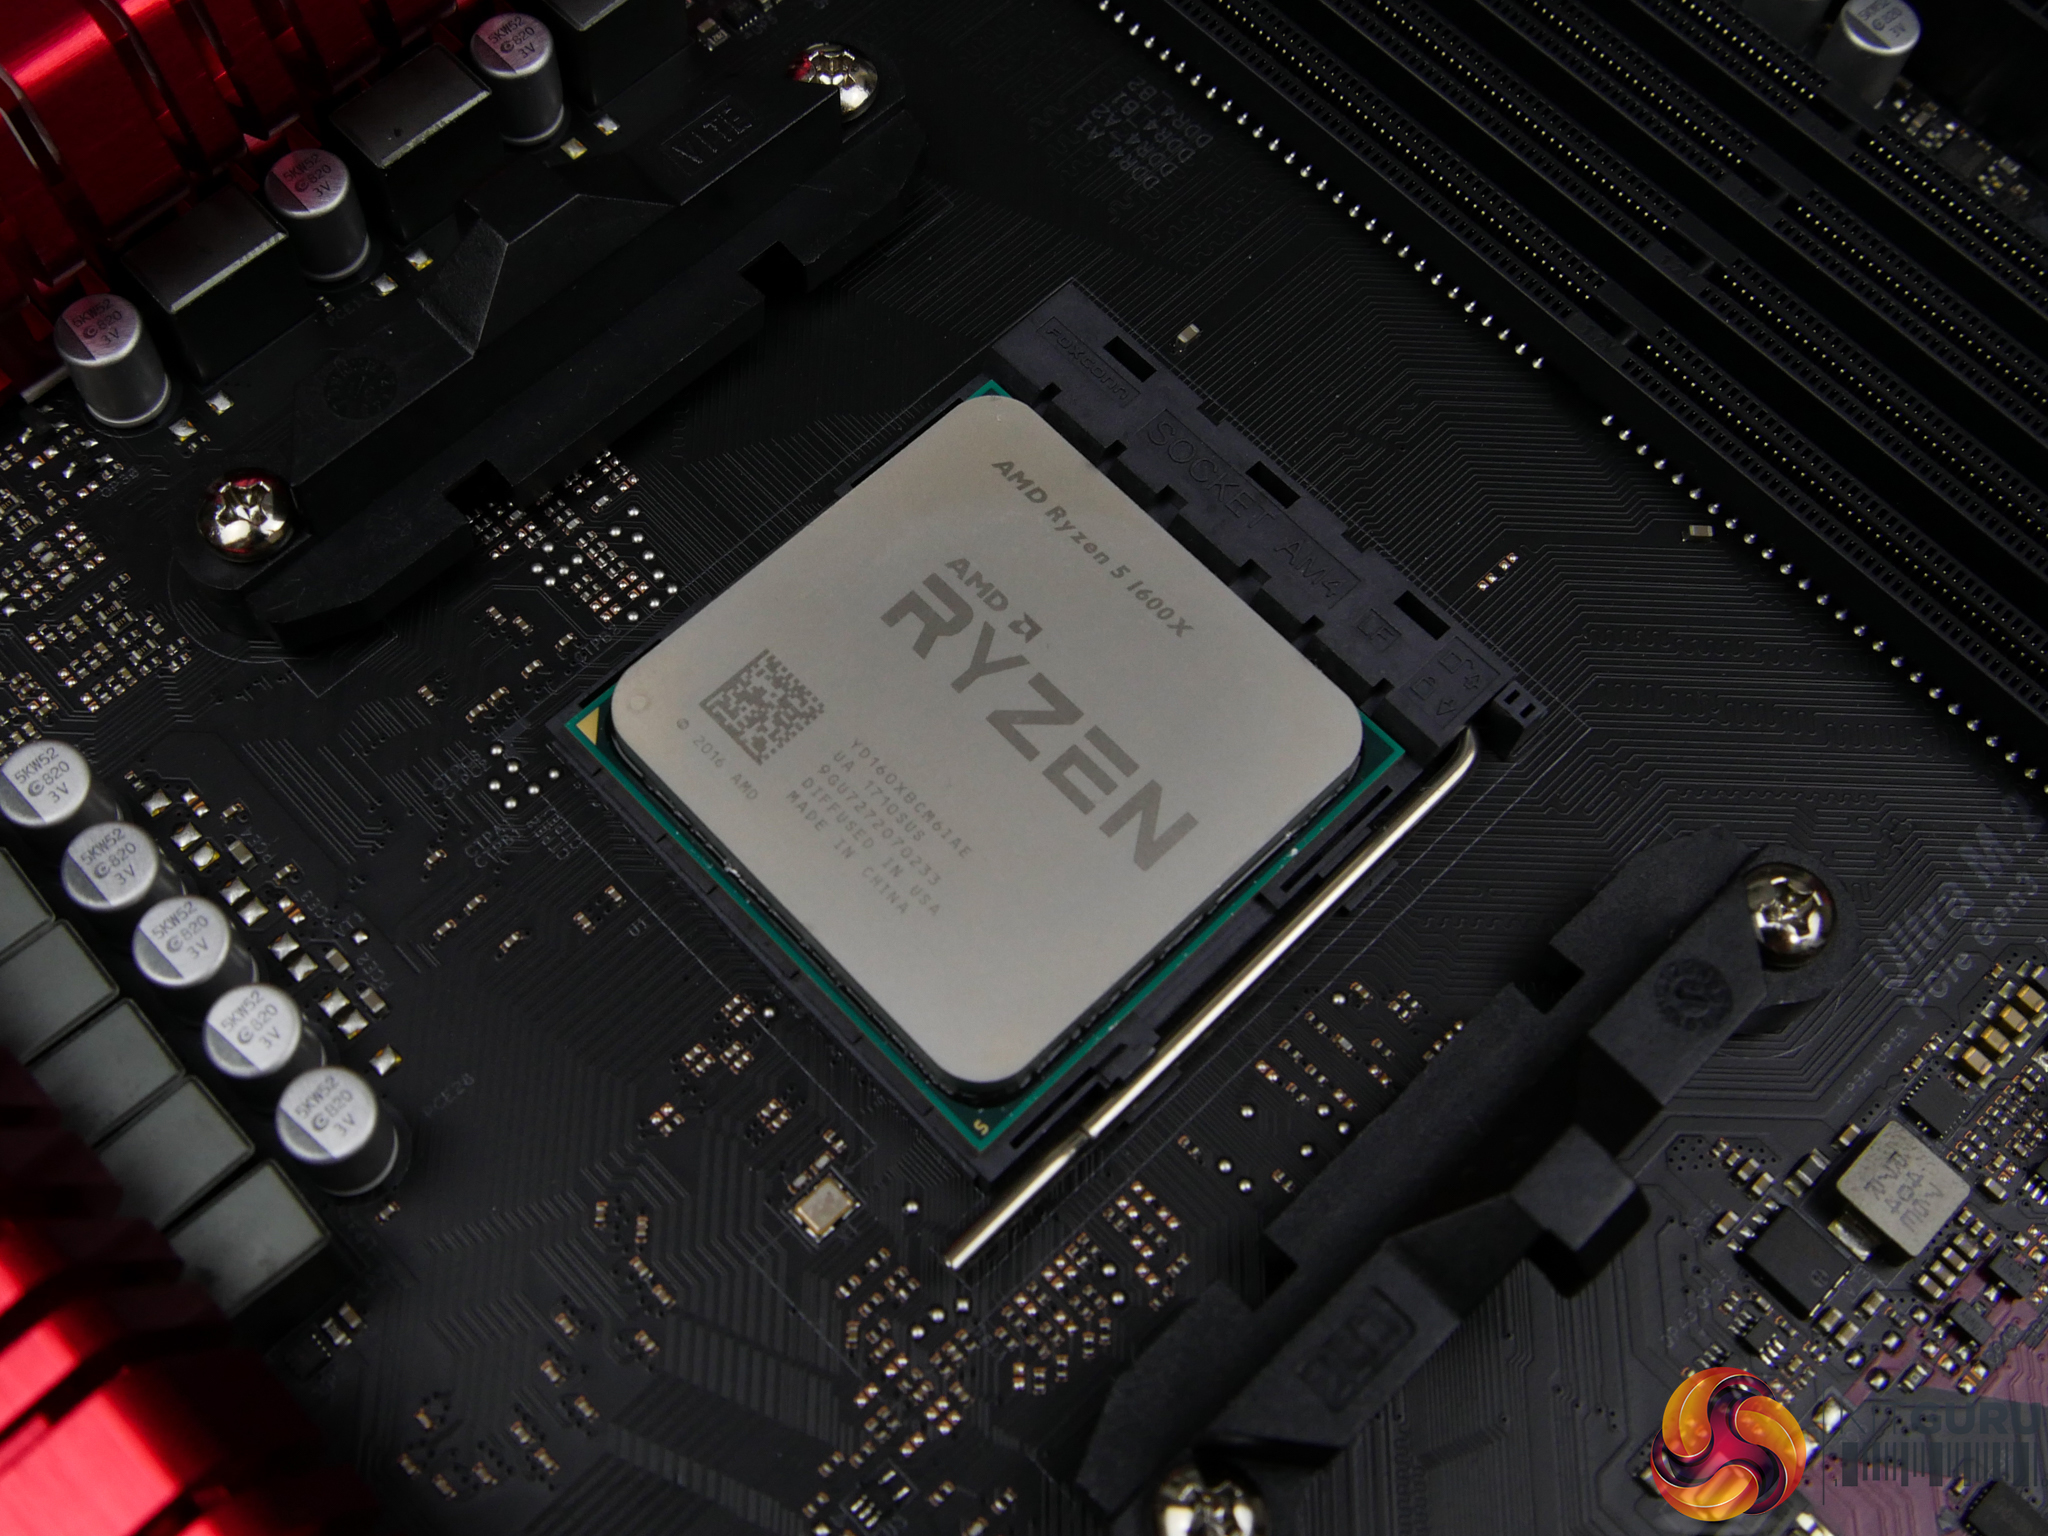
The six-core, twelve-thread 1600X comes in as AMD’s Ryzen 5 flagship. Sporting a clock speed of 3.6-4.0GHz using Precision Boost, with up to 4.1GHz under Extended Frequency Range (XFR) conditions, the six-core part is essentially three quarters of a Ryzen 7 1800X. That point holds true for several of the metrics. However, the TDP is still rated at 95W and the twin CPU Complex (CCX) design means that the 1600X retains its full slab of 16MB shared L3 cache. L2 cache tips the scales at the same 512KB per core for all Ryzen processors thus far, giving this six-core part a 3MB capacity.
On the topic of the dual CCX design, AMD is deploying Ryzen 5 six-core parts as 3+3 layouts. This means that one CPU core per CCX is disabled before joining the pair of complexes together by AMD’s Infinity Fabric. A 3+3 design should achieve the highest level of balance and it helps to ensure part consistency; opting for 3+3 as well as 4+2 layouts would have introduced manufacturing and performance variations between supposedly identical Ryzen 5 six-core processors. Utilisation of the CCXs in a 3-core capacity may also allow AMD to put defunct Ryzen 7 silicon to effective use. 14nm FinFET manufacturing is not cheap and the less silicon put in the bin, the better.
Of course, there’s also the other side of the argument that suggests AMD is manually disabling a single core on the CCXs to achieve market segmentation. If this is true, we could see a return to the good old days of core unlocking on AMD CPUs but we do not know if this will be the case (or if it’s even possible).
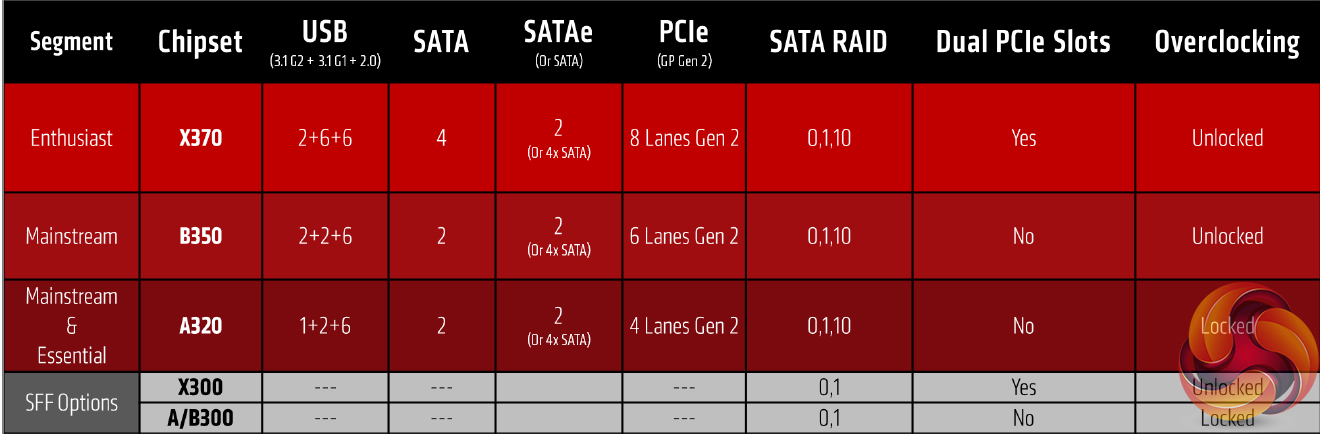
To say that AM4 is a flexible platform would be an understatement. Like all other Ryzen processors, the Ryzen 5 1600X can be dropped into an AM4 motherboard with no less than five different chipset types. Three of those – the enthusiast X370, mainstream B350, and SFF X300 – support overclocking with Ryzen’s unlocked core multiplier. By comparison, Intel forces you onto its Z270 chipset for overclocking support (and high-speed memory, for that matter) with LGA 1151 CPUs and those boards come with a ~£100 starting price.
The logical partner for Ryzen 5 is a B350 chipset motherboard. Compared to the high-end (read: expensive) enthusiast-geared X370 motherboards found partnered with Ryzen 7, B350 forces you to give up PCIe bifurcation thus blocking multi-GPU CrossFire and SLI support, as well as a small number of USB 3.0, SATA 6Gbps, and PCIe 2.0 lanes.
You’ll also have to accept the lower quality power delivery solution that vendors tend to create on their B350 motherboards that hover around a £100 sweet-spot. By comparison, £100 gets you an entry-level Intel Z270 motherboard that is short on frills but utilises the feature-rich 200-series chipset. B350 AM4 motherboards start at around £80. £80 for Intel gets you a non-overclockable H270 or B250 chipset offering.
| CPU | AMD Ryzen 5 1600X | AMD Ryzen 5 1600 | AMD Ryzen 5 1500X | AMD Ryzen 5 1400 | Intel Core i5-7600K | Intel Core i5-7400 | Intel Core i3-7350K |
| CPU Codename | Zen | Zen | Zen | Zen | Kaby Lake | Kaby Lake | Kaby Lake |
| Core / Threads |
6 / 12 | 6 / 12 | 4 / 8 | 4 / 8 | 4 / 4 | 4 / 4 | 2 / 4 |
| CCX Config | 3+3 | 3+3 | 2+2 | 2+2 | n/a | n/a | n/a |
| Base Frequency | 3.6GHz | 3.2GHz | 3.5GHz | 3.2GHz | 3.8GHz | 3.0GHz | 4.2GHz |
| Boost Frequency | 4.0GHz | 3.6GHz | 3.7GHz | 3.4GHz | 4.2GHz | 3.5GHz | n/a |
| Maximum Frequency | 4.1GHz (100MHz XFR) | 3.7GHz (100MHz XFR) | 3.9GHz (200MHz XFR) | 3.45GHz (50MHz XFR) | n/a | n/a | n/a |
| Unlocked Core Multiplier | Yes (x0.25 granularity) | Yes (x0.25 granularity) | Yes (x0.25 granularity) | Yes (x0.25 granularity) | Yes (x1 granularity) | No | Yes (x1 granularity) |
| Total Cache | 16MB L3 + 3MB L2 | 16MB L3 + 3MB L2 | 16MB L3 + 2MB L2 | 8MB L3 + 2MB L2 | 6MB L3 + 1MB L2 | 6MB L3 + 1MB L2 | 4MB L3 + 0.5MB L2 |
| PCIe Lanes | 16+4+4 | 16+4+4 | 16+4+4 | 16+4+4 | 16 | 16 | 16 |
| CPU Socket | AM4 | AM4 | AM4 | AM4 | LGA 1151 | LGA 1151 | LGA 1151 |
| Manufacturing Process | 14nm | 14nm | 14nm | 14nm | 14nm | 14nm | 14nm |
| TDP | 95W | 65W | 65W | 65W | 91W | 65W | 60W |
| CPU Cooler | n/a | Wraith Spire (no LED) | Wraith Spire (no LED) | Wraith Stealth (no LED) | n/a | Intel E97379-003 (Al slug) | n/a |
| MSRP | $249 | $219 | $189 | $169 | $242 | $182 | $168-179 |
| UK Street Price | £249.99 | £219.99 | £189.99 | £169.99 | Approx. £230 | Approx. £170 | Approx. £170 |
At $249, Ryzen 5’s flagship 1600X is pitted squarely against Intel’s fastest Core i5 – the $242 Kaby Lake 7600K. AMD offers up two more physical cores, which translates into eight additional threads thanks to Simultaneous Multi-Threading (SMT). Meanwhile, Intel puts forward a 4.2GHz maximum Turbo Boost speed and the strong likelihood of a straightforward 4.6GHz+ overclock thanks to the vendor’s refined 14nm+ process technology.
Neither processor ships with a cooler, meaning that head-to-head price point comparisons are just that. Cooler Master’s £27 Hyper 212X is the logical partner. Both CPUs should also work fine with DDR4 speeds that are sensible for this price range (3200MHz and below), provided you have a stable BIOS on the accompanying motherboard.
For more information regarding Ryzen and the AM4 platform, read our launch review for the Ryzen 7 1800X HERE. You can also read our Ryzen 7 1700 review HERE and the Ryzen 7 1700X review HERE.
Overclocking
Overclocking with Ryzen 5 is a practically identical procedure to that of Ryzen 7. The main settings worth tweaking for CPU overclocking are the CPU VCore, loadline calibration, and SOC voltage to aid stability especially with higher-speed memory kits. If your motherboard has the option in its UEFI, bumping NB voltage up to around 1.10-1.15V can aid stability.
With that said, the number of adjustable voltage options on B350 motherboards is far more limited compared to X370, based on our experience with the ASRock Fatal1ty AB350 Gaming K4. This motherboard had no options for loadline calibration control and SOC voltage adjustment was not clear. That's not a major negative, necessarily, because the overclocking procedure is far more straightforward if CPU frequency and CPU voltage are the only worthwhile adjustable options.
Default voltage for manual tuning should start at around 1.3625V, according to AMD (though we noticed the Ryzen 5 1500X default to a lower voltage around 1.2xV in the UEFI). Users should be fine pushing to 1.40V with a decent CPU cooler and up to 1.45V with a high-end dual-tower heatsink or dual-fan AIO radiator. At 1.45V, however, AMD suggests that processor longevity could be affected according to their models.
In short, our final Ryzen 5 1600X overclocking settings using an ASRock Fatal1ty AB350 Gaming K4 motherboard were:
- 1.40V CPU VCore.
- Multiple Cinebench R15 multi-core runs to validate stability, as well as AIDA64 CPU stress test.
- DDR4-3200MHz 14-14-14-34 @ 1.35V (XMP).
The best frequency that we could achieve with these settings was 4.0GHz with 1.40V (1.36V under Cinebench loading due to a lack of loadline calibration settings on the ASRock AB350 Gaming K4 motherboard).
We tried to push to 4100MHz using a BIOS-set voltage of 1.425V (1.424V under initial Cinebench loading) but this proved unstable. Upon backing down to the reasonable level of 1.40V in the UEFI, we could not achieve stability past 4000MHz. 4025MHz was very close to stable for our five continuous runs of Cinebench but it failed part way through the fifth run.
The overclocking results for the Ryzen 5 1600X look to be similar to those that have been accepted with the Ryzen 7 chips. Ryzen 7’s 1800X seems to overclock a little further, which is understandable given the likelihood of it being the most potent silicon in AMD’s inventory. However, it is a little disappointing to see the same limits for Ryzen 5 as Ryzen 7. The reduction in core count gives a greater power budget per core but this seems to have little influence at sensible voltage levels where the silicon simply does not like to operate much further than 4GHz.
Our superb kit of G.SKILL Trident Z DDR4 worked flawlessly at its 3200MHz C14 XMP settings on the ASRock motherboard. Temperatures were fine at a 1.36V load voltage even when using the inexpensive Cooler Master Hyper 212X CPU cooler.
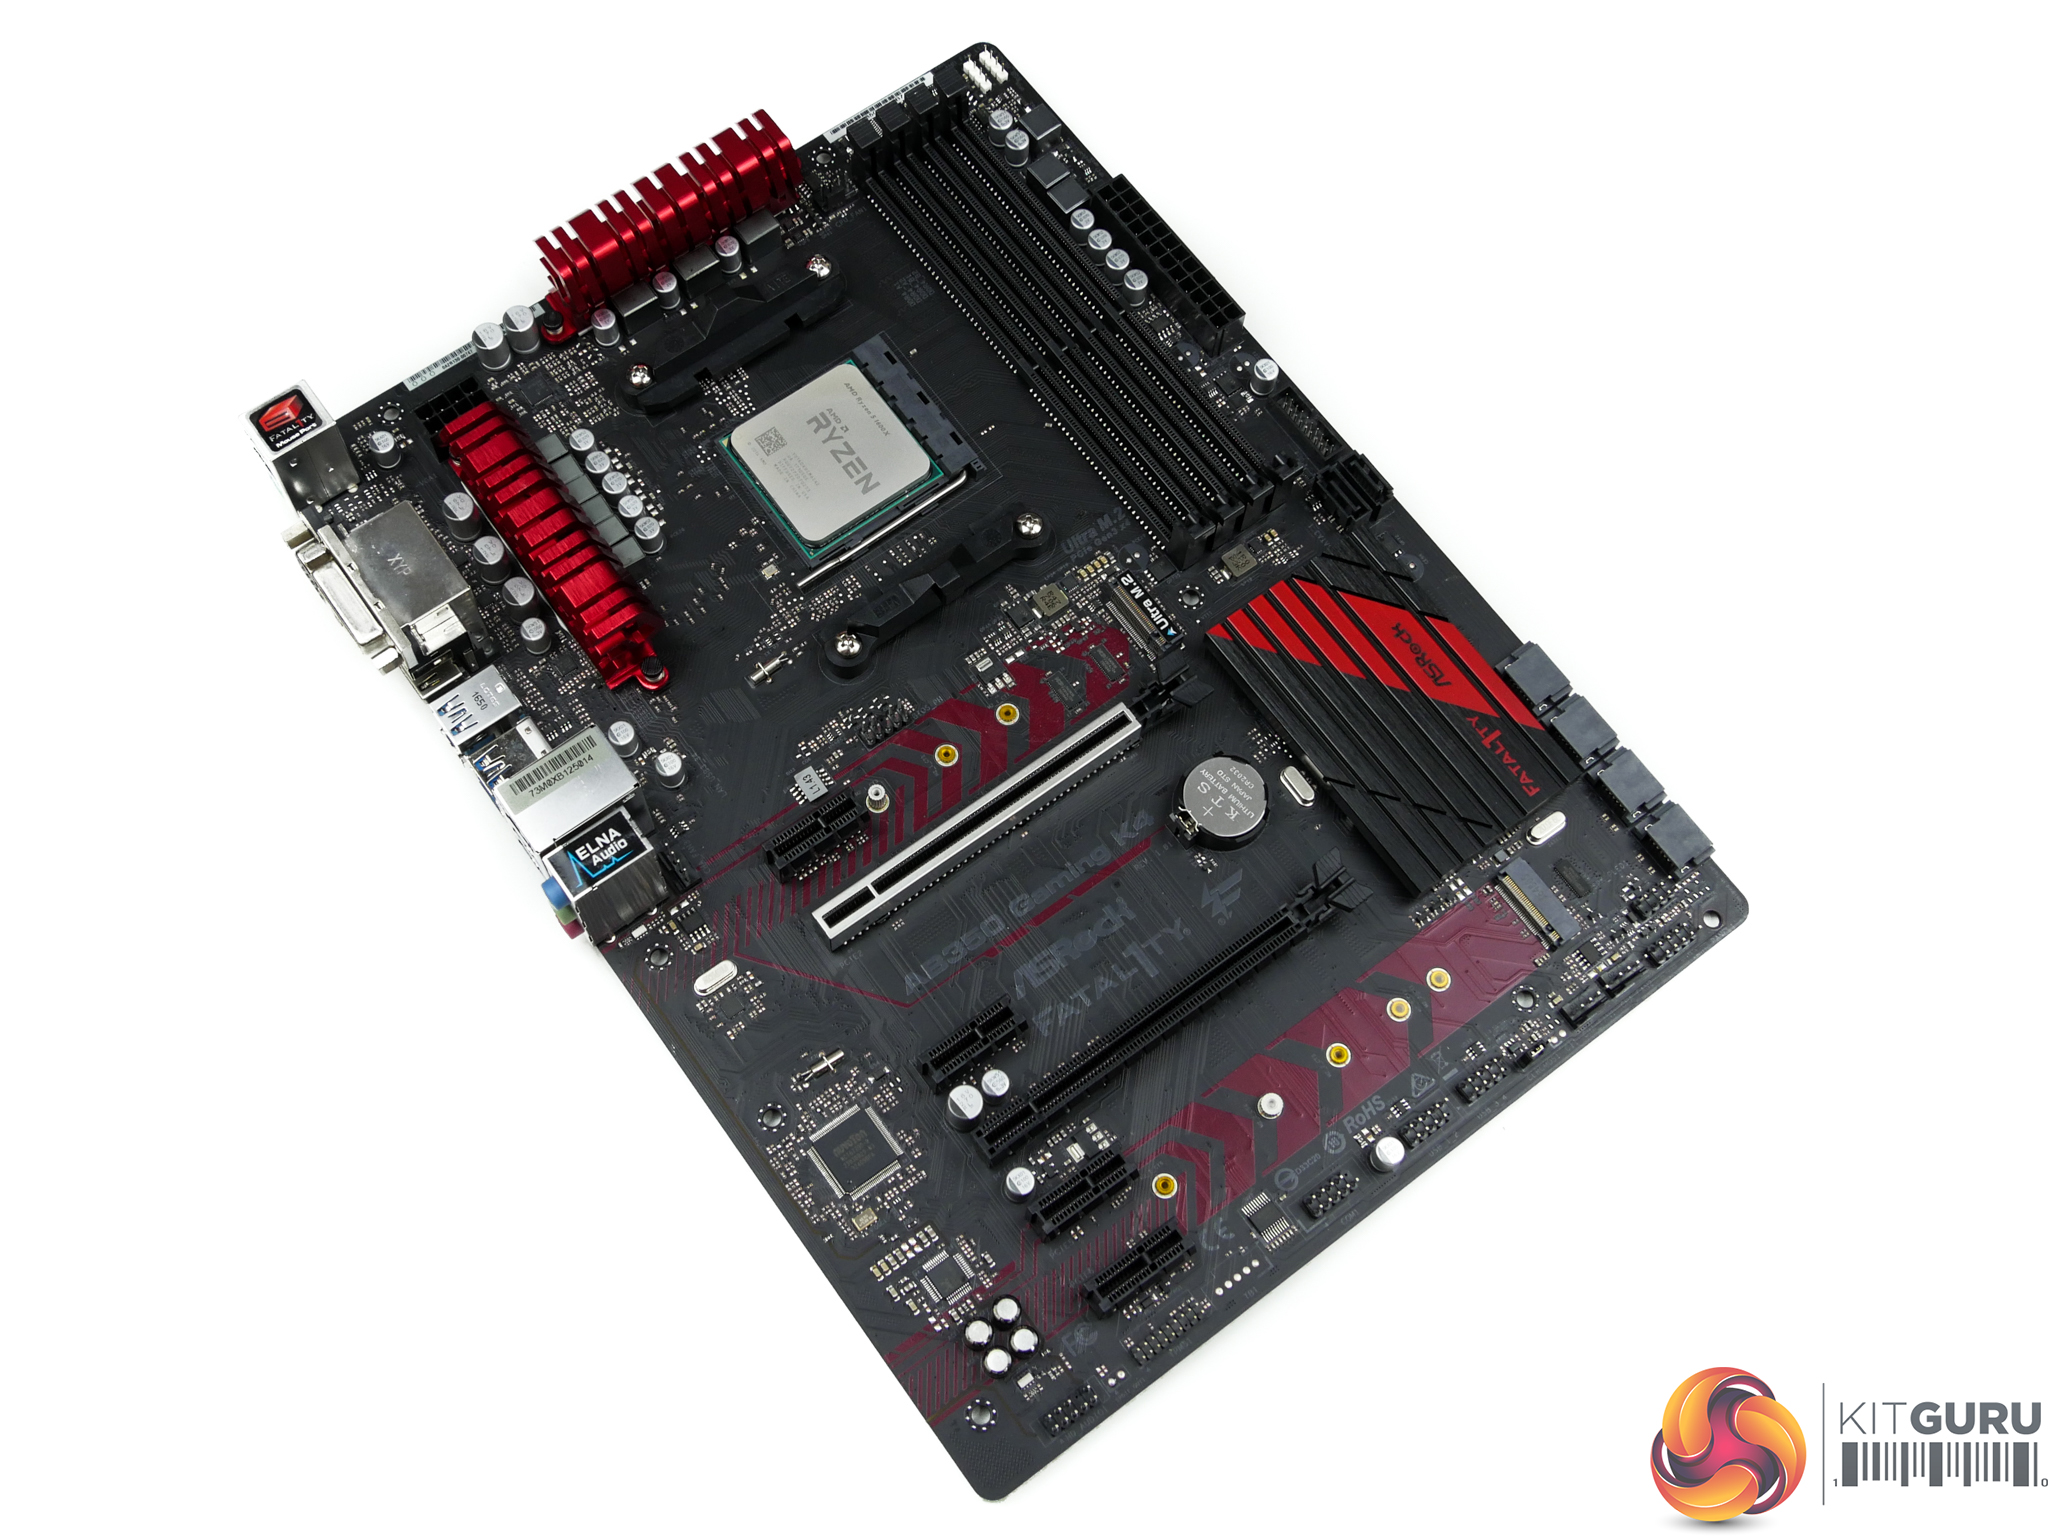
We will be outlining the Ryzen 5 1600X CPU's performance while using an ASRock Fatal1ty AB350 Gaming K4 AM4 motherboard.
A 16GB (2x8GB) kit of G.Skill's Trident Z DDR4 memory serves our test system. The kit's rated frequency of 3200MHz with CL14 timings should ensure that memory-induced bottlenecks are removed. A strength for the ASRock board is its ability to run this memory at 3200MHz CL14 using XMP, which is pushing on the limit of memory speed capability for the AM4 platform.
Today's comparison processors come in the form of:
- Piledriver FX-8370.
- Sandy Bridge i7-2700K.
- Ivy Bridge i5-3570K.
- Devil's Canyon i7-4790K (Haswell-based).
- Broadwell-E i7-6800K.
- Skylake's i5-6600K and i7-6700K.
- Kaby Lake's i3-7350K, i5-7400, i5-7600K, and i7-7700K.
- Ryzen 5 1500X.
- Ryzen 7 1700, 1700X and 1800X.
Where significant data is present in the chart (for games and all productivity benchmarks), the numbers are directly comparable with those displayed in our Ryzen 7 review HERE. This new test system is updated with the latest Windows build version which represents the only significant change (aside from multiple game updates) since Ryzen 7 testing.
It will be interesting to see how Ryzen 5 compares to its closest Kaby Lake competitor. Also of interest will be the ability of Ryzen 5 to compete with Ryzen 7 chips in lightly-threaded workloads, such as certain games.
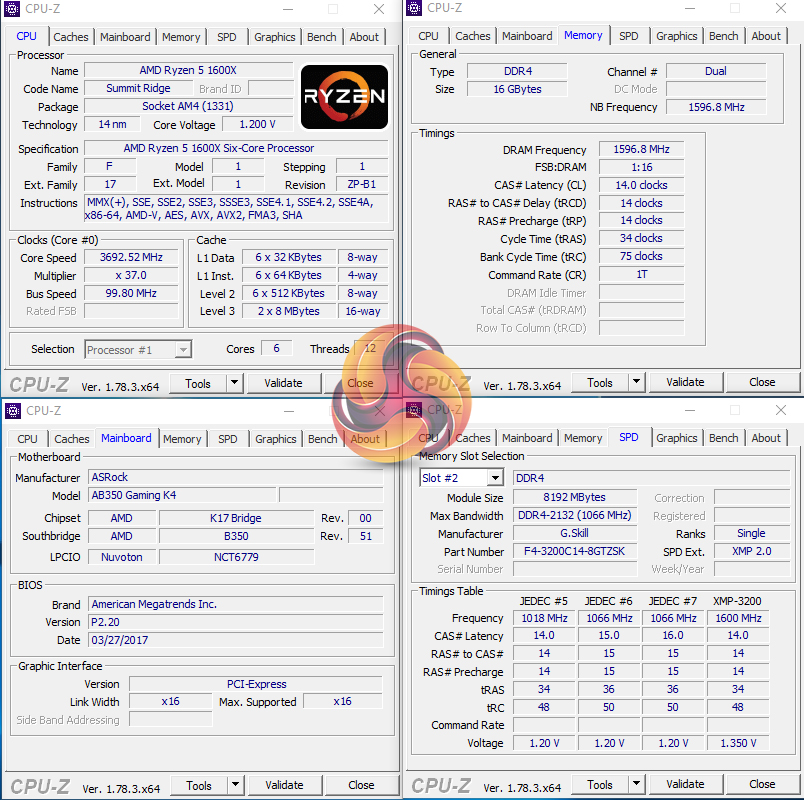
The Ryzen 5 1600X sat comfortably at its 3.7GHz all-core boost frequency throughout testing thanks to our adequate Cooler Master Hyper 212X CPU cooler and solid power delivery from the ASRock motherboard. XFR was confirmed as operating at 4.1GHz by running multiple different single-threaded workloads and checking the real-time clock speed.
We test Intel CPUs (except the Core i5-7400) using the forced turbo (multi-core turbo – MCT) setting that most motherboard vendors now enable by default or when using XMP memory. This feature pins all of the CPU's cores at the maximum turbo boost frequency all of the time. The voltage is bumped up to enhance stability but this results in greater power consumption and higher temperature readings which are important to remember when testing those parameters.
We also tested all CPUs' achievable overclocked frequencies so that you can see how your overclocked chip compares to another stock or overclocked chip.
CPU Test System Common Components:
- Graphics Card: Nvidia GeForce GTX Titan X Pascal (custom fan curve to eliminate thermal throttling).
- CPU Cooler: Cooler Master Hyper 212X / AMD Wraith Spire / Intel E97379-003 (stock, Aluminium slug) / Noctua NH-D14 / Noctua NH-D15 / Cryorig R1 Ultimate / Corsair H100i v2 / Corsair H110i GT.
- Games SSD: SK hynix SE3010 SATA 6Gbps 960GB.
- Power Supply: Seasonic Platinum 1000W / Seasonic Platinum 760W.
- Operating System: Windows 10 Pro 64-bit (Anniversary Update, latest version).
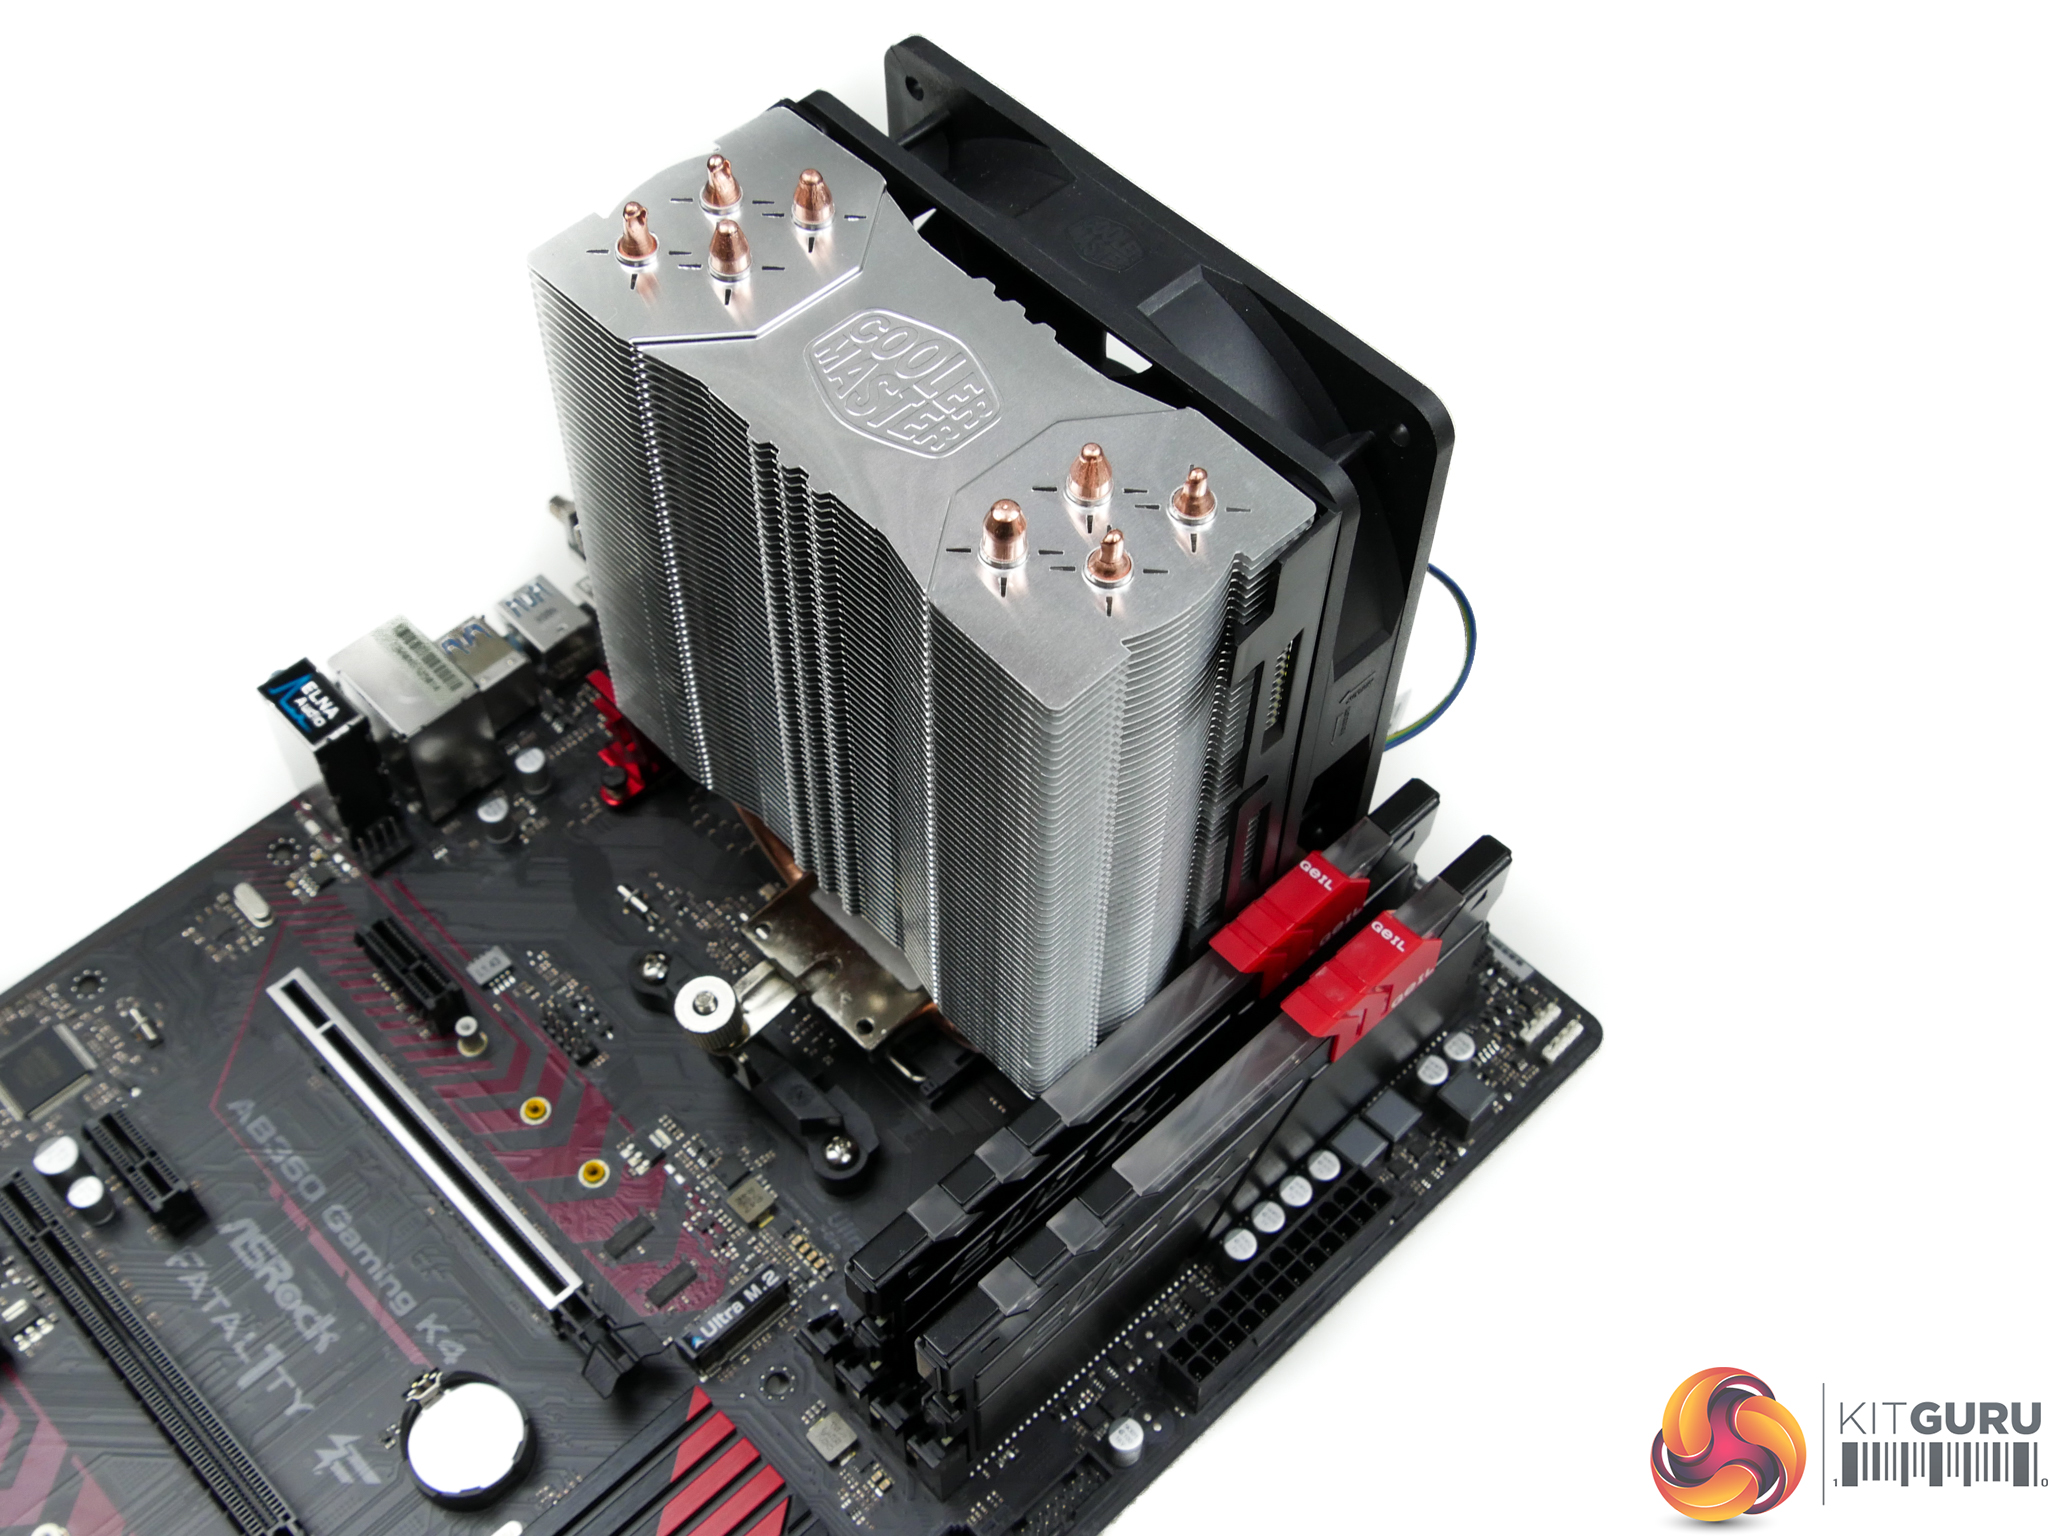
We try to use coolers that will realistically be partnered with the CPUs to gather performance measurements. In the case of Ryzen 5, this is a Cooler Master Hyper 212X for the 1600X and the supplied AMD Wraith Spire for the 1500X. The Core i5-7400 is tested with its stock Intel cooler.
Seasonic's Platinum-rated PSUs provide ample power to really push the CPU overclocks. Nvidia's GTX Titan X Pascal is the fastest gaming GPU on the planet, making it ideal for alleviating GPU-induced bottlenecks and putting the onus on CPU performance.
While we use a mixture of cooling and PSU hardware for general testing, where it is important to keep those items identical (power draw and temperature readings) we ensure that the correct hardware is used to deliver accurate data.
Ryzen 5 B350 System (Ryzen 5 1600X, 1500X):
- 1600X CPU: AMD Ryzen 5 1600X ‘Summit Ridge' 6 cores, 12 threads (3.6-4.0GHz stock w/ 4.1GHz XFR & 4.0GHz @ 1.4V overclocked).
- 1500X CPU: AMD Ryzen 5 1500X ‘Summit Ridge' 4 cores, 8 threads (3.5-3.7GHz stock w/ 3.9GHz XFR & 3.9GHz @ 1.4V overclocked).
- Motherboard: ASRock Fatal1ty AB350 Gaming K4 (AM4, B350).
- Memory: 16GB (2x8GB) G.Skill Trident Z 3200MHz 14-14-14-34 DDR4 @ 1.35V.
- System Drive: Crucial MX300 525GB.
Ryzen 7 X370 System (Ryzen 7 1800X, 1700X, 1700):
- 1800X CPU: AMD Ryzen 7 1800X ‘Summit Ridge' 8 cores, 16 threads (3.6-4.0GHz stock w/ 4.1GHz XFR & 4.1GHz @ 1.43125V overclocked).
- 1700X CPU: AMD Ryzen 7 1700X ‘Summit Ridge' 8 cores, 16 threads (3.4-3.8GHz stock w/ 3.9GHz XFR & 4.0GHz @ 1.41875V overclocked).
- 1700 CPU: AMD Ryzen 7 1700 ‘Summit Ridge' 8 cores, 16 threads (3.0-3.7GHz stock w/ 3.75GHz XFR & 4.0GHz @ 1.41875V overclocked).
- Motherboard: ASUS Crosshair VI Hero (AM4, X370).
- Memory: 16GB (2x8GB) G.Skill Trident Z 3200MHz 14-14-14-34 DDR4 @ 1.35V.
- System Drive: Crucial MX300 525GB.
Kaby Lake & Skylake LGA 1151 System (7350K, 7400, 7600K, 7700K, 6600K, 6700K):
- 7350K CPU: Intel Core i3-7350K ‘Kaby Lake' (Retail) 2 cores, 4 threads (4.2GHz stock MCT & 4.8GHz @ 1.35V overclocked).
- 7400 CPU: Intel Core i5-7400 ‘Kaby Lake' (Retail) 4 cores, 4 threads (3.0-3.5GHz stock).
- 7600K CPU: Intel Core i5-7600K ‘Kaby Lake' (Retail) 4 cores, 4 threads (4.2GHz stock MCT & 4.9GHz @ 1.35V overclocked).
- 7700K CPU: Intel Core i7-7700K ‘Kaby Lake (Retail) 4 cores, 8 threads (4.5GHz stock MCT & 4.8GHz @ 1.35V overclocked).
- 6600K CPU: Intel Core i5-6600K ‘Skylake' (Retail) 4 cores, 4 threads (3.9GHz stock MCT & 4.5GHz @ 1.35V overclocked).
- 6700K CPU: Intel Core i7-6700K ‘Skylake' (Retail) 4 cores, 8 threads (4.2GHz stock MCT & 4.7GHz @ 1.375V overclocked).
- Motherboard: MSI Z270 Gaming Pro Carbon & Gigabyte Aorus Z270X-Gaming 7 (LGA 1151, Z270).
- Memory: 16GB (2x8GB) G.Skill Trident Z 3200MHz 14-14-14-34 DDR4 @ 1.35V.
- System Drive: Samsung 840 500GB.
Broadwell-E LGA 2011-3 System (6800K):
- 6800K CPU: Intel Core i7 6800K ‘Broadwell-E' (Retail) 6 cores, 12 threads (3.6GHz stock MCT & 4.2GHz @ 1.275V overclocked).
- Motherboard: ASUS X99-Deluxe (LGA 2011-v3, X99).
- Memory: 32GB (4x8GB) G.Skill Trident Z 3200MHz 14-14-14-34 DDR4 @ 1.35V.
- System Drive: SanDisk Ultra Plus 256GB.
Devil's Canyon LGA 1150 System (4790K):
- 4790K CPU: Intel Core i7 4790K ‘Devil's Canyon' (Engineering Sample) 4 cores, 8 threads (4.4GHz stock MCT & 4.7GHz @ 1.30V overclocked).
- Motherboard: ASRock Z97 OC Formula (LGA 1150, Z97).
- Memory: 16GB (2x8GB) G.Skill Trident X 2400MHz 10-12-12-31 DDR3 @ 1.65V.
- System Drive: Kingston SM2280S3/120G 120GB.
Sandy Bridge & Ivy Bridge LGA 1155 System (2700K, 3570K):
- 2700K CPU: Intel Core i7 2700K ‘Sandy Bridge‘ (Retail) 4 cores, 8 threads (3.9GHz stock MCT & 4.6GHz @ 1.325V overclocked).
- 3570K CPU: Intel Core i5 3570K ‘Ivy Bridge' (Retail) 4 cores, 4 threads (3.8GHz stock MCT & 4.6GHz @ 1.30V overclocked).
- Motherboard: ASUS P8Z77-V (LGA 1155, Z77).
- Memory: 16GB (2x8GB) G.Skill Trident X 2400MHz 10-12-12-31 DDR3 @ 1.65V (@2133MHz for 2700K due to CPU IMC limitation).
- System Drive: Kingston HyperX 3K 120GB.
Vishera AM3+ System (FX-8370):
- FX-8370 CPU: AMD FX-8370 ‘Vishera' (Retail) 8 cores, 8 threads (4.0-4.3GHz stock & 4.62GHz @ 1.45V CPU, 2.6GHz @ 1.30V NB overclocked).
- Motherboard: Gigabyte 990FX-Gaming (AM3+, SB950).
- Memory: 16GB (2x8GB) G.Skill Trident X 2133MHz 12-12-12-31 DDR3 @ 1.65V.
- System Drive: Patriot Wildfire 240GB.
Software:
- ASRock Fatal1ty AB350 Gaming K4 BIOS 2.20 (latest for Ryzen 5 testing).
- GeForce 378.49 VGA drivers.
Tests:
Productivity-related:
- Cinebench R15 – All-core & single-core CPU benchmark (CPU)
- HandBrake 0.10.5 – Convert 6.27GB 4K video recording using the Normal Profile setting and MP4 container (CPU)
- Mozilla Kraken – Browser-based JavaScript benchmark (CPU)
- x265 Benchmark – 1080p H.265/HEVC encoding benchmark (CPU)
- WPrime – 1024M test, thread count set to the CPU's maximum number (CPU)
- SiSoft Sandra 2016 SP1 – Processor arithmetic, cryptography, and memory bandwidth (CPU & Memory)
- 7-Zip 16.04 – Built-in 7-Zip benchmark test (CPU & Memory)
Gaming-related:
- 3DMark Fire Strike v1.1 – Fire Strike (1080p) test (Gaming)
- 3DMark Time Spy – Time Spy (DX12) test (Gaming)
- VRMark – Orange room (2264×1348) test (Gaming)
- Ashes of the Singularity Escalation – Built-in benchmark tool CPU-Focused test, 1920 x 1080, Extreme quality preset, DX12 version (Gaming)
- Gears of War 4 – Built-in benchmark tool, 1920 x 1080, Ultra quality preset, Async Compute Enabled, DX12 (Gaming)
- Grand Theft Auto V – Built-in benchmark tool, 1920 x 1080, Maximum quality settings, Maximum Advanced Graphics, DX11 (Gaming)
- Metro: Last Light Redux – Built-in benchmark tool, 1920 x 1080, Very High quality settings, SSAA Enabled, AF 16X, High Tessellation, DX11 (Gaming)
- Rise of the Tomb Raider – Built-in benchmark tool, 1920 x 1080, Very High quality preset, SMAA enabled, DX12 version (Gaming)
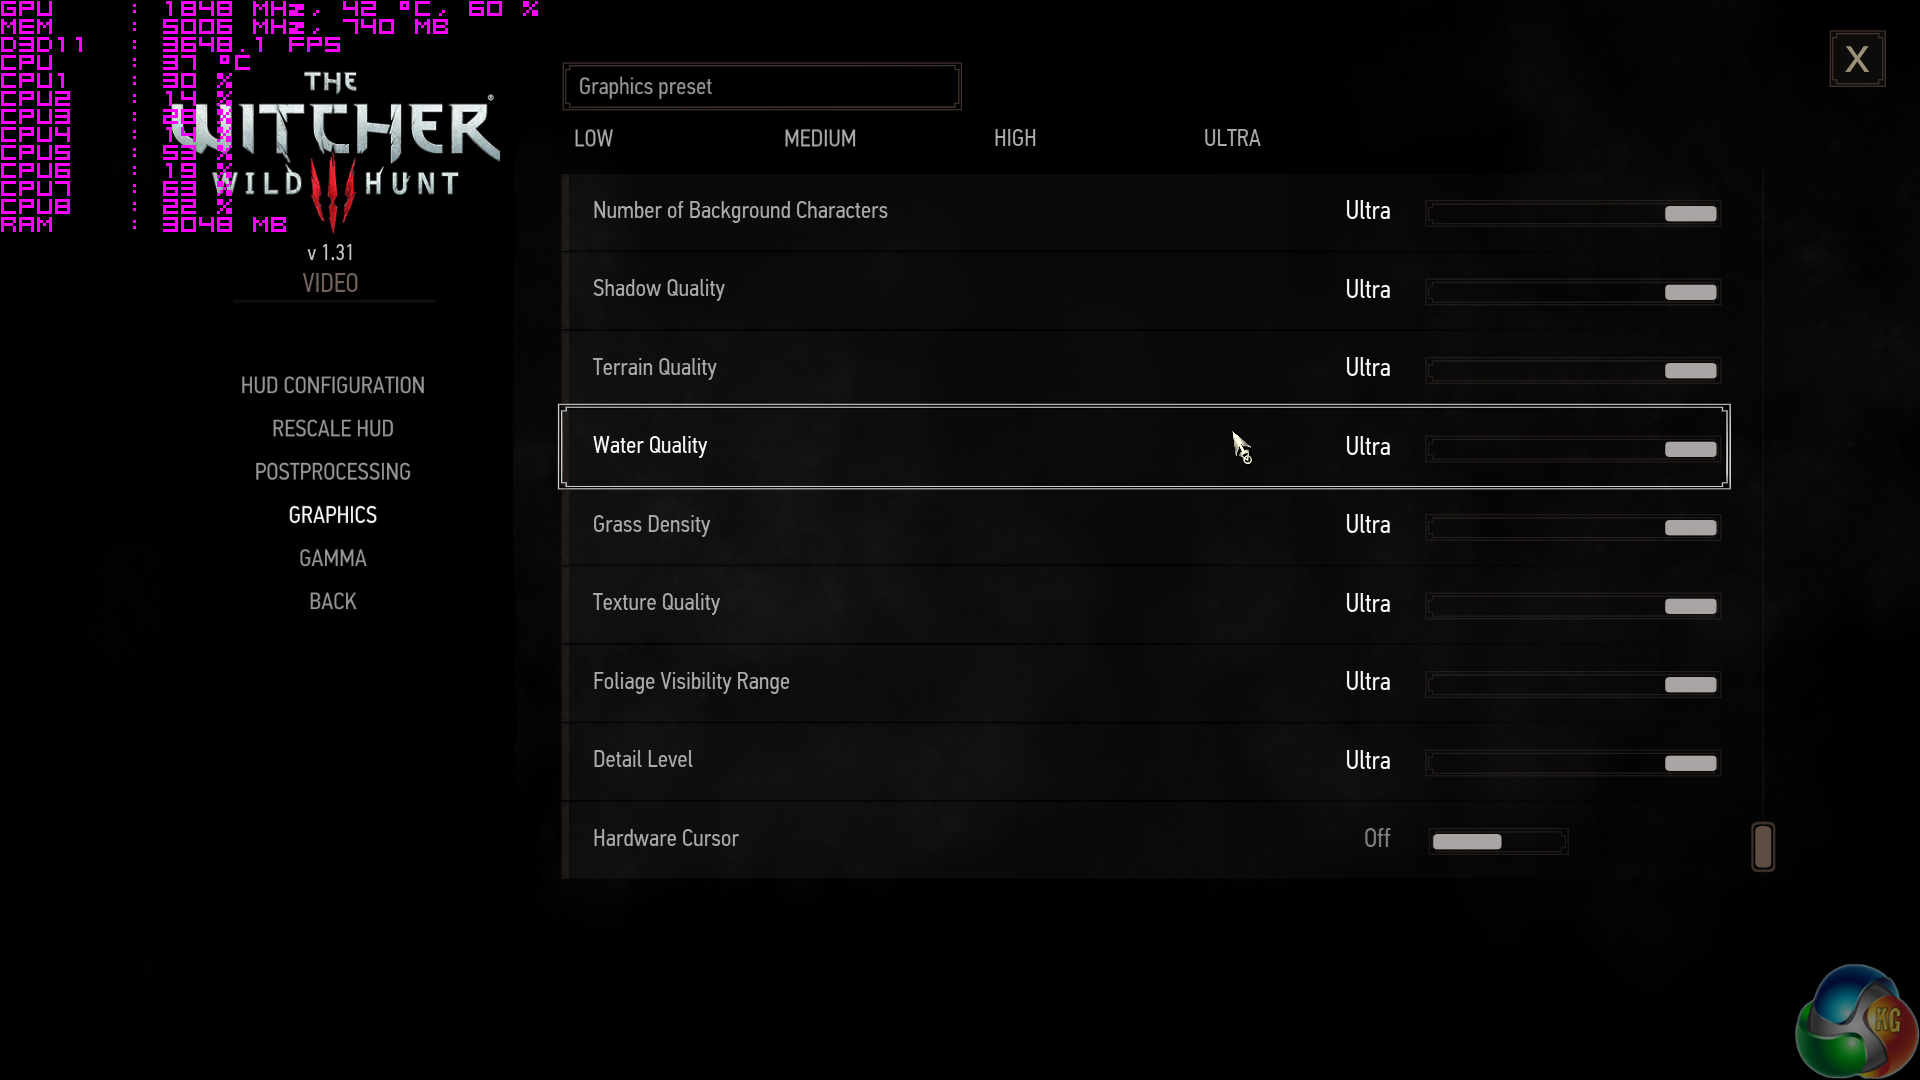
- The Witcher 3: Wild Hunt – Custom benchmark run in a heavily populated town area, 1920 x 1080, Maximum quality settings, Nvidia features disabled, DX11 (Gaming)
- Total War Warhammer – Built-in benchmark tool, 1920 x 1080, Ultra quality preset, DX12 version (Gaming)
Cinebench
Cinebench is an application which renders a photorealistic 3D scene to benchmark a computer’s rendering performance, on one CPU core, all CPU cores or using the GPU. We run the test using the all-core CPU and single-thread CPU modes.
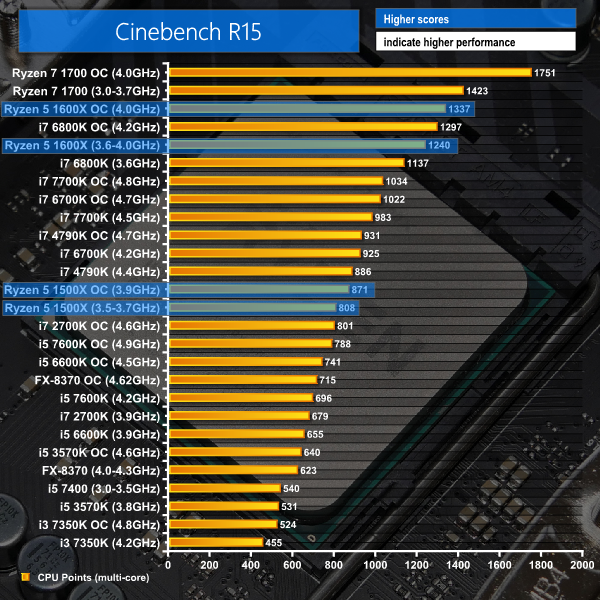
A dozen threads thrown at Cinebench R15 results in superb multi-threaded performance for the 1600X. AMD is putting Intel’s circa-£400 Broadwell-E Core i7-6800K to shame by outperforming it at stock and when ovcerclocked, despite the Ryzen 5 flagship costing around £150 (37.5%) less. AMD’s own £330 octa-core Ryzen 7 1700 is around 31% faster than the six-core 1600X when both are overclocked to 4GHz. Understandable, given the 33% increase in thread count.
Changing perspective to Ryzen 5 1600X’s price competitor, the roughly £240 Core i5-7600K, AMD’s part is 78% faster at stock clocks. Overclocking both chips reduces that gap to 70%, thanks to the significant frequency boost to Intel’s chip by comparison to the 1600X. 70%+ speed increases for the same money are sizeable differences in any language. Even the fastest mainstream part Intel has to offer – the speedy Kaby Lake Core i7-7700K – cannot compete with Ryzen 5 1600X and its twelve threads.
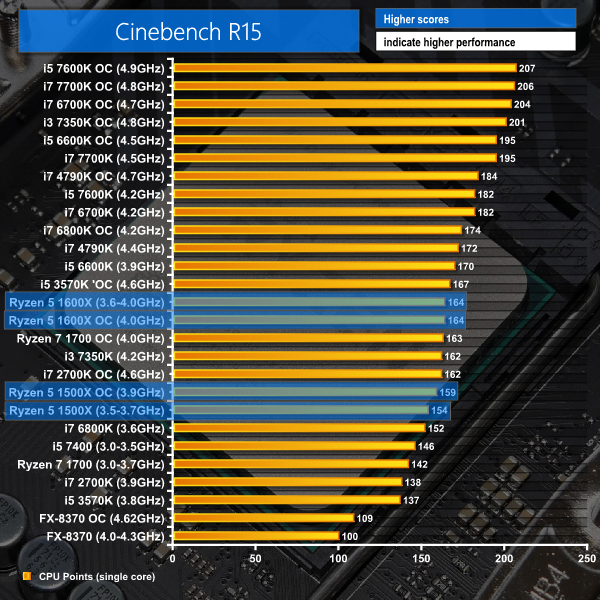
Single-threaded performance is less flattering for the Ryzen 5 flagship. Intel’s Kaby Lake architecture is the simple recipe for market-leading single-threaded performance to today’s buyer. So, it comes as no surprise to see the price-competitive Core i5-7600K outperforming Ryzen 5 1600X both at stock and when overclocked.
Out-of-the-box frequencies put the 4.2GHz MCT i5-7600K 11% ahead of Ryzen 5 1600X, despite the latter’s ability to boost to 4.1GHz under XFR conditions. The 1600X cannot gain ground with an overlock due to the all-core limitation of 4.0GHz. This gives the 4.9GHz Core i5-7600K a performance advantage of 20% over both 1600X configurations.
Handbrake Conversion
Handbrake is a free and open-source video transcoding tool that can be used to convert video files between different codecs, formats and resolutions. We measured the average frame rate achieved for a task of converting a 6.27GB 4K video using the Normal Profile setting and MP4 container. The test stresses all CPU cores to 100% and shows an affinity for memory bandwidth.
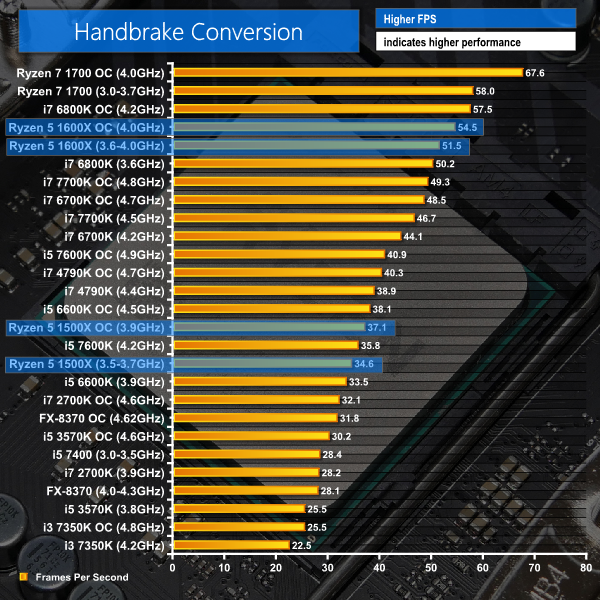
Handbrake is a clean-sweep for the 6C12T Ryzen 5 1600X against its 4C4T price competitor. Stock versus stock, the 1600X is 44% faster. That lead stands at 33% with both processors overclocked. The Core i7-7700K is also swept aside by the cheaper 1600X and a stock i7-6800K’s performance is also surpassed. Impressive for a $249 chip.
x265 Encoding
x265 Encoding tests system performance by encoding a 1080p test file using the x265/HEVC format.
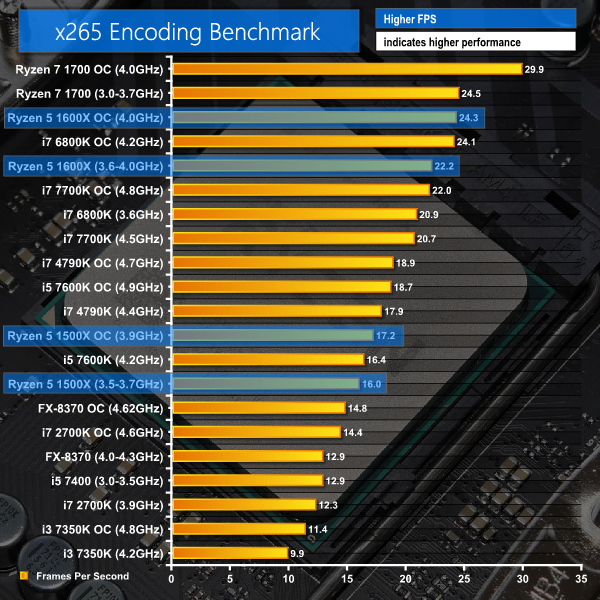
The x265 encoding benchmark likes frequency alongside thread count. As such, 1600X takes a commanding lead over the i5-7600K at both stock and overclocked frequencies. The performance improvements versus a 7600K are significant and even the speedy i7-7700K only manages to hit 1600X-level performance with a 1.1GHz frequency advantage (due to Ryzen 5 1600X’s 3.7GHz all-core Precision Boost). With both processors overclocked, the $249 1600X is a little faster than Intel’s HEDT i7-6800K.
CPU-related testing overview:
Put simply, six physical cores combined with twelve threads, thanks to AMD’s SMT, allow the Ryzen 5 1600X to destroy the 4C4T Core i5-7600K in heavy computational tasks. The Core i7 chips are also beaten in several tasks. However, Kaby Lake is still the best architecture to opt for if you require high frequency and the best IPC performance.
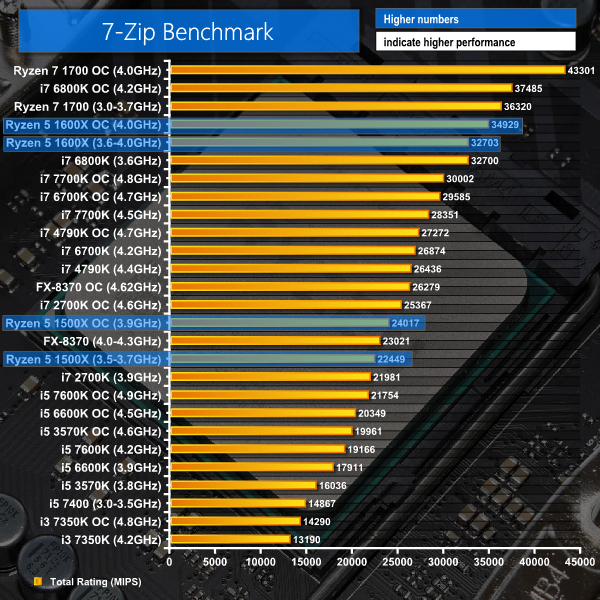
7-Zip
7-Zip is an open source Windows utility for manipulating archives. We measure the Total Rating performance using the built-in benchmark tool. The test stresses all CPU cores to 100% and shows an affinity for memory bandwidth.
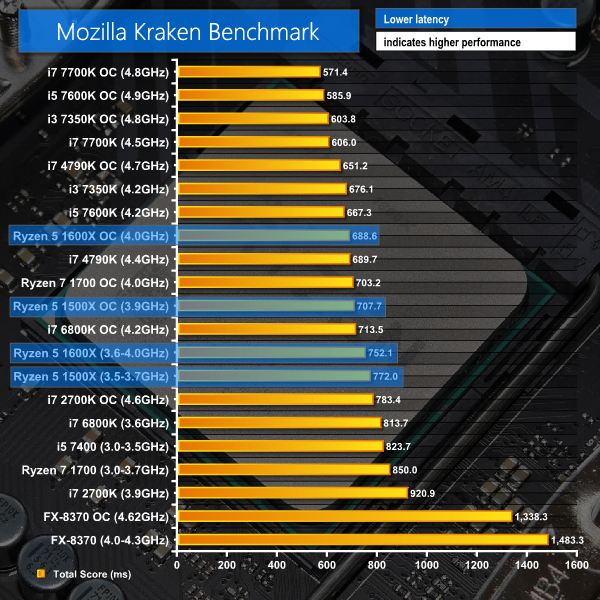
Mozilla Kraken
Mozilla Kraken is a browser-based JavaScript benchmark that tests a variety of real-world use cases. We use Chrome as the test browser. The test exhibits very little multi-threading and shows an affinity for CPU clock speed and IPC.
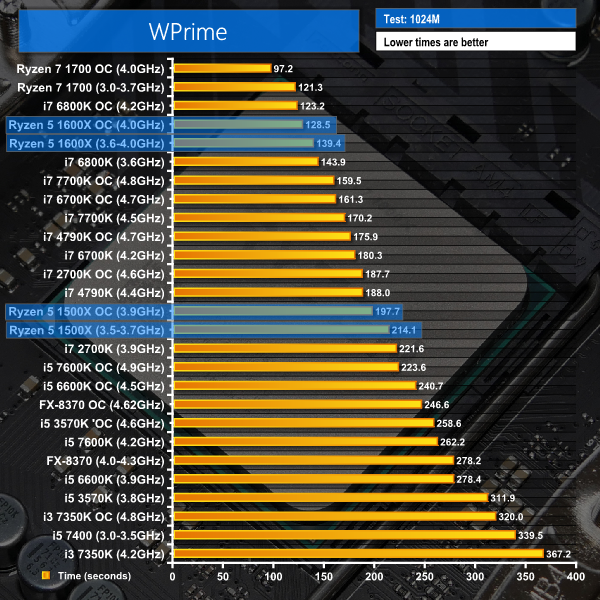
WPrime
WPrime is a leading multithreaded benchmark for x86 processors that tests your processor performance by calculating square roots with a recursive call of Newton’s method for estimating functions. We use the 1024M test in WPrime to analyse processor calculation performance.
7-Zip likes cores and memory bandwidth. Three times as many threads gives the 1600X a commanding lead over the Core i5-7600K. The Ryzen 5 flagship's performance lead is 71% at stock and 61% with both chips overclocked. Core i7-7700K is outperformed by the 1600X and it takes an overclock to 4.2GHz (plus quad-channel DDR4-3200 memory) for the 6800K to surpass Ryzen 5 numbers.
Kaby Lake’s clock speed and IPC are king in Kraken, so the i5-7600K beats out Ryzen 5 1600X at both frequency configurations. Ryzen 5 1600X is, however, able to put in a good showing against Intel’s more expensive 6C12T Core i7-6800K.
WPrime is heavily multi-threaded so the performance of Ryzen 5 1600X is a known by this point. Core i5-7600K is outperformed versus Ryzen 5 1600X by significant levels at both stock and overclocked frequencies. The more expensive 4C8T and 6C8T Core i7 processors also sit below Ryzen 5 in the chart, at stock frequencies. An overclock to the Broadwell-E 6800K puts it above Ryzen 5 performance levels.
CPU-related testing overview:
Ryzen 5 1600X continues to show its dominance versus the price-competitive i5-7600K in multi-threaded workloads. Core i7-7700K performance numbers are also surpassed and it takes a hefty overclock for Broadwell-E’s Core i7-6800K to beat Ryzen 5’s flagship. Positive stuff from a $249 part.
With that said, the Kraken benchmark shows that Kaby Lake’s mixture of stronger IPC and significantly higher clock frequency demote Ryzen 5 in the performance hierarchy. Single- or lightly-threaded workloads are best paired with Kaby Lake.
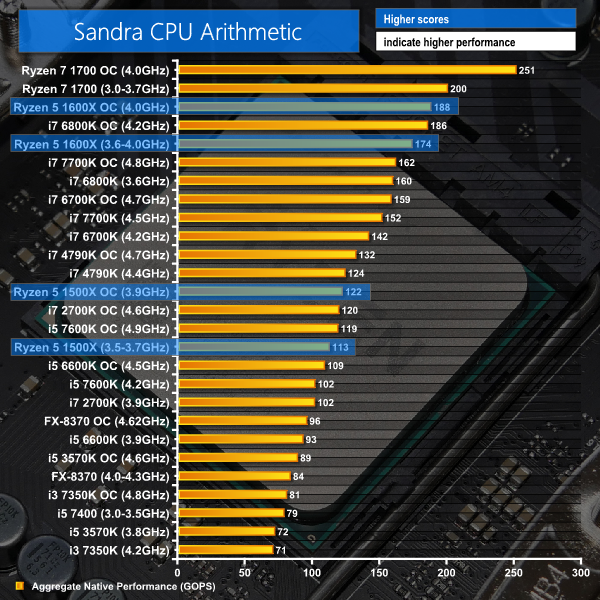
Sandra Processor Arithmetic
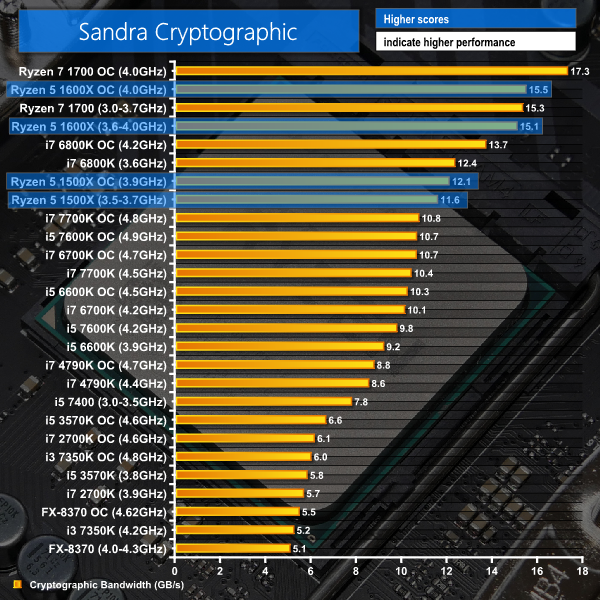
Sandra Cryptographic
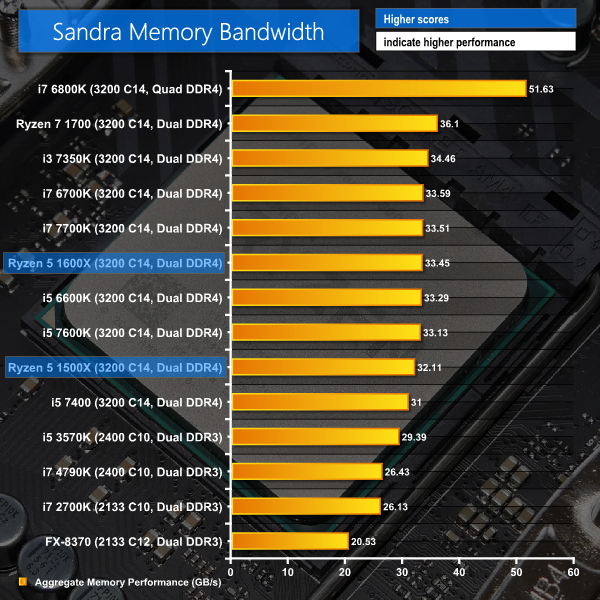
Sandra Memory Bandwidth
No surprises that the set of SiSoft Sandra synthetic tests show Ryzen 5 to be a potent performer. Cryptographic performance from Ryzen is particularly strong, which shows AMD’s architecture to be potent at such tasks despite possible core frequency deficits.
Memory bandwidth is par for the course with dual-channel DDR4 support and utilisation of a well-balanced 3200MHz set.
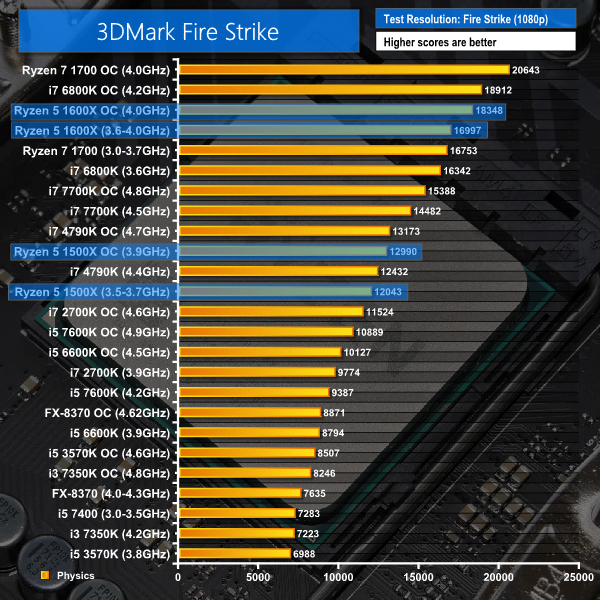
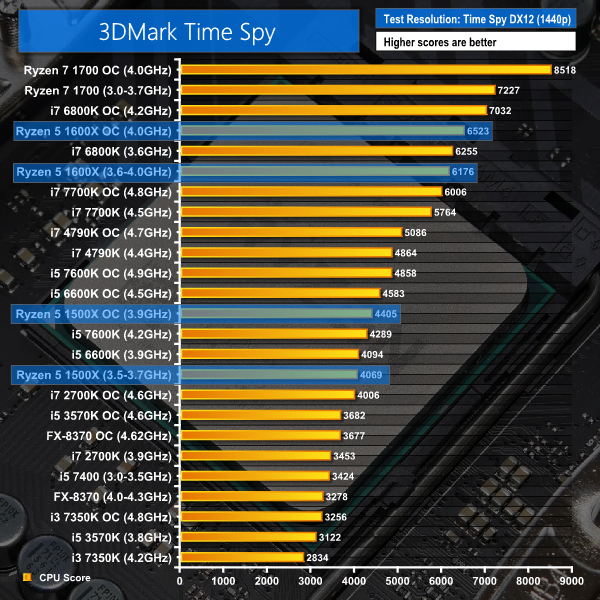
3DMark
3DMark is a multi-platform hardware benchmark designed to test varying resolutions and detail levels of 3D gaming performance. We run the Windows platform test and in particular the Fire Strike benchmark, which is indicative of high-end 1080p PC Gaming. We also test using the Time Spy benchmark which gives an indication of DirectX 12 performance.
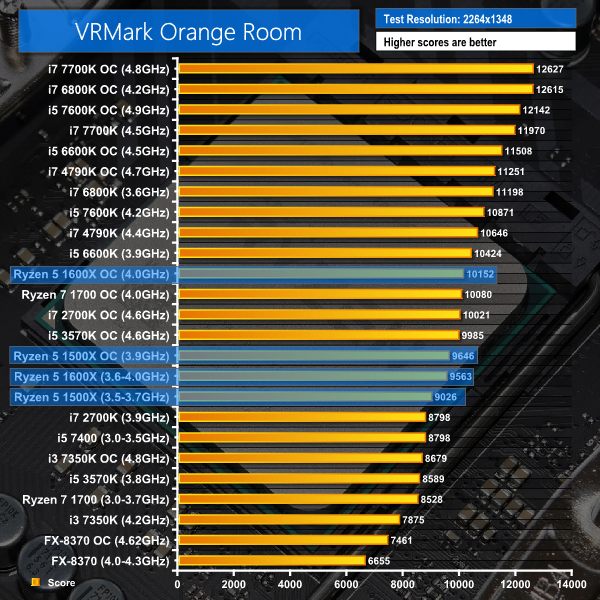
VRMark
The recently-released VRMark benchmark aims to score systems based on their VR performance potential by using rendering resolutions associated with VR devices of today and the future. We test using the Orange Room benchmark which uses a rendering resolution of 2264×1348 to analyse the capability of hardware with current devices such as the HTC Vive and Oculus Rift.
3DMark Time Spy and Fire Strike feature strong multi-threading capabilities, so it comes as no surprise to see Ryzen 5 doing well in those tests.
VRMark is less favourable towards AMD’s Ryzen chips, giving an indication that clock frequency and Intel architecture are more important for this test.
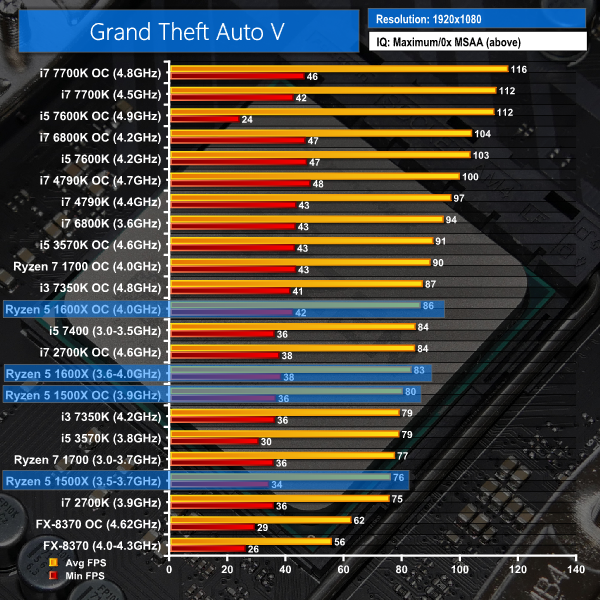
Grand Theft Auto V
Grand Theft Auto V remains an immensely popular game for PC gamers and as such retains its place in our test suite. The well-designed game engine is capable of providing heavy stress to a number of system components, including the GPU, CPU, and Memory, and can highlight performance differences between motherboards.
We run the built-in benchmark using a 1080p resolution and generally Maximum quality settings (including Advanced Graphics).


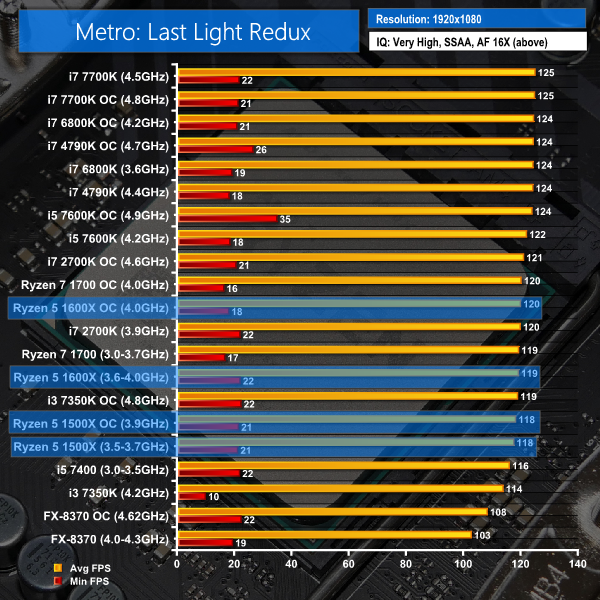
Metro: Last Light Redux
Despite its age, Metro: Last Light Redux remains a punishing title for modern computer hardware. We use the game's built-in benchmark with quality set to Very High, SSAA enabled, AF 16X, and High tessellation.
The Witcher 3: Wild Hunt
The Witcher 3 is a free-roaming game which can feature heavy interaction from NPCs in densely-populated urban areas, making it ideal for testing CPU performance. The well-designed game engine is capable of providing heavy stress to a number of system components and will happily use more than four CPU threads when such hardware is available.
We run a custom benchmark which is located in a heavily populated section of an urban town area. A 1080p resolution and Maximum quality settings are used (Nvidia Hairworks settings are disabled).
GTA V likes Intel architectures, as well as clock frequency. Despite the game engine’s ability to leverage the Ryzen 5 1600X’s twelve threads, the 4C4T Core i5-7600K is a better performer at both speed configurations. If you’re a high refresh rate gamer, Core i5-7600K will satisfy your needs better than Ryzen 5. However, if you game at a locked 60 FPS, Ryzen 5 1600X proves to be a solid option thanks to its significant spare computational capacity. CPU usage hovering around 30-50% on eleven of the twelve threads (and 60%+ for the single driving thread per DX11 limitations) leaves significant spare capacity for multi-tasking opportunities such as game streaming. By comparison, the 4C4T i5-7600K must work pretty much flat-out to achieve its frame rate.
Metro: Last Light Redux shows that Kaby Lake’s i5-7600K is still faster than Ryzen 5 1600X even in a heavily GPU-limited scenario. The performance advantage for the unlocked i5 is small but it is consistent and measurable. Minimum FPS data does not tell us much in Metro due to its inaccuracy.
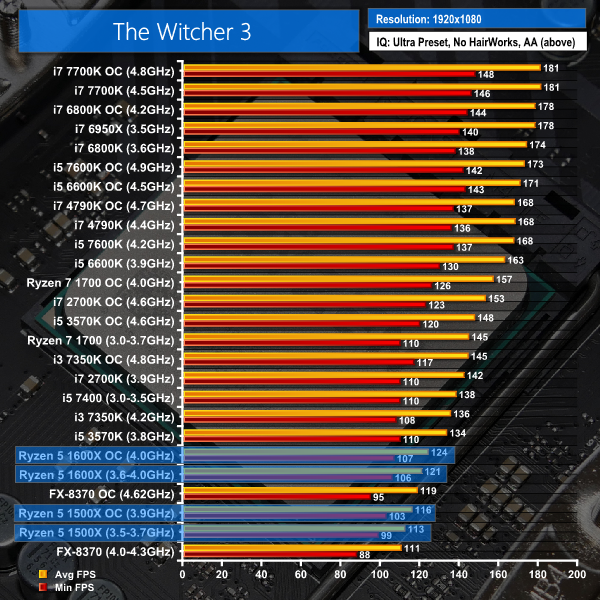
The Witcher 3 performance gives an indication of 1080P gaming issues with Ryzen. Even accounting for its frequency deficit against some of the comparison processors, Ryzen 5 1600X’s relative performance is disappointing. Processor-wide utilisation is around 20-40% and even specific cores aren’t pinned at 100% usage. SMT threads also look to be practically unused with the 1600X. This indicates that The Witcher 3’s game engine cannot extract the performance that Ryzen 5 1600X can potentially provide. Putting this into perspective, however, frame rates are still above 120 FPS on average. Core i5-7600K is faster than Ryzen 5 1600X but it is largely superficial to most people, given the extremely high frame rates.
DX11 Gaming Overview:
If you have $249 to spend on a processor for gaming, the Intel Core i5-7600K is clearly a better choice in our trio of DX11 games. Its higher clock frequency and stronger architectural performance translate into better gaming performance. This will be important to high refresh rate gamers but largely superficial to those playing at a locked 1080P60.
It is, however, important to highlight that Ryzen 5 1600X and its twelve threads showed significant spare capacity available on our records. The same cannot be said about Intel’s 4C4T i5-7600K. If you plan to stream your games or run heavy background tasks, Ryzen 5 1600X is clearly worthy of consideration against the i5-7600K.
Ashes of the Singularity Escalation
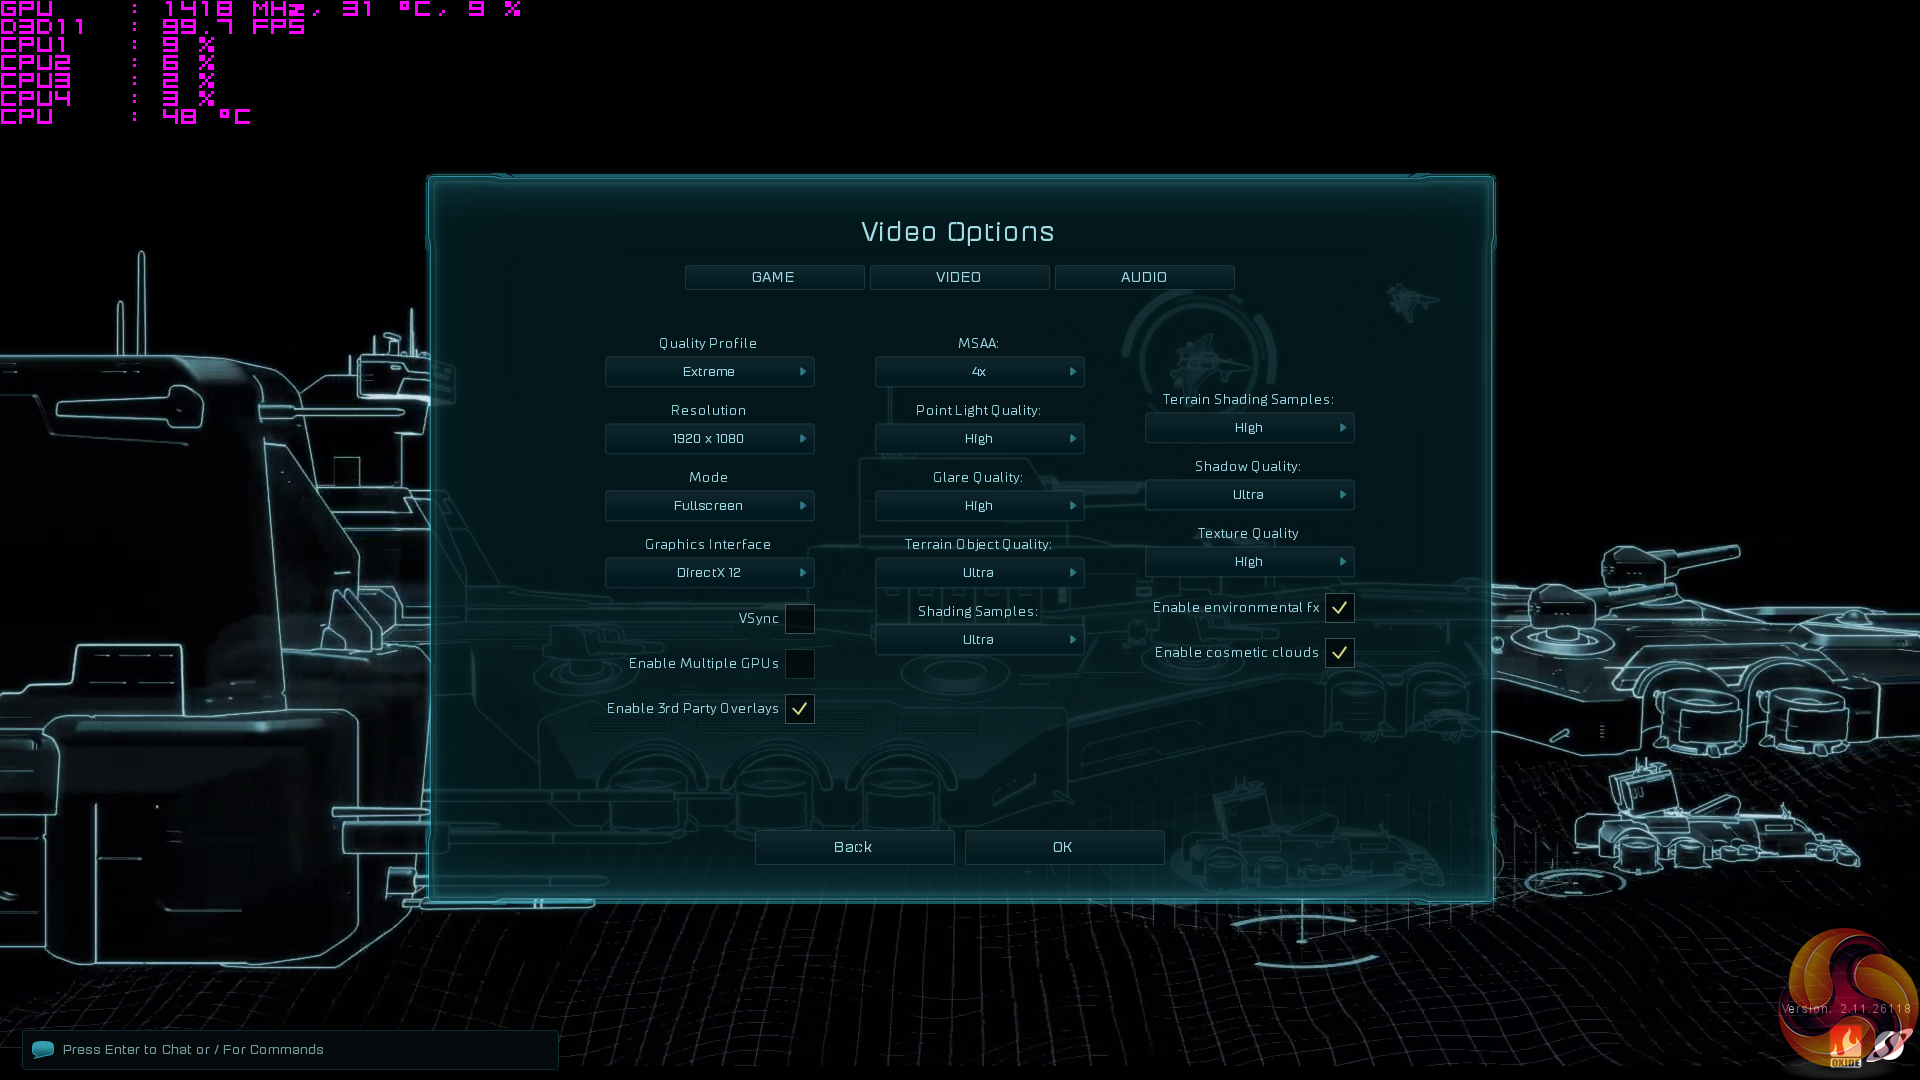
Ashes of the Singularity Escalation is a Sci-Fi real-time strategy game built for the PC platform. The game includes a built-in benchmark tool with DirectX 12 support. We run the CPU-focused benchmark using DirectX 12, a 1080p resolution and the Extreme quality preset.
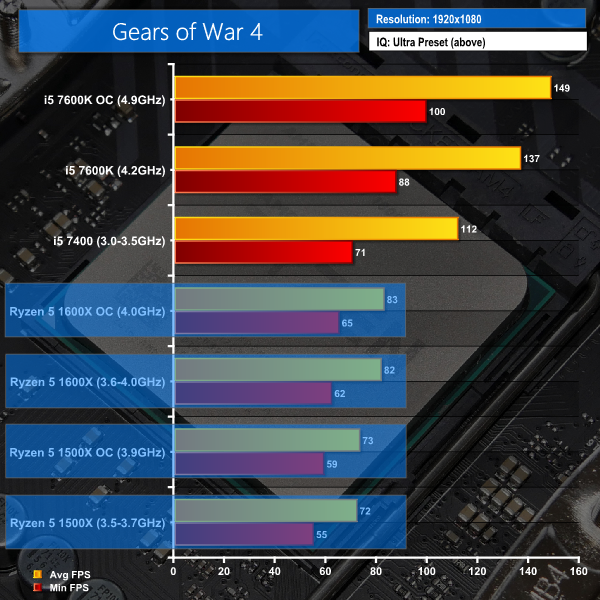
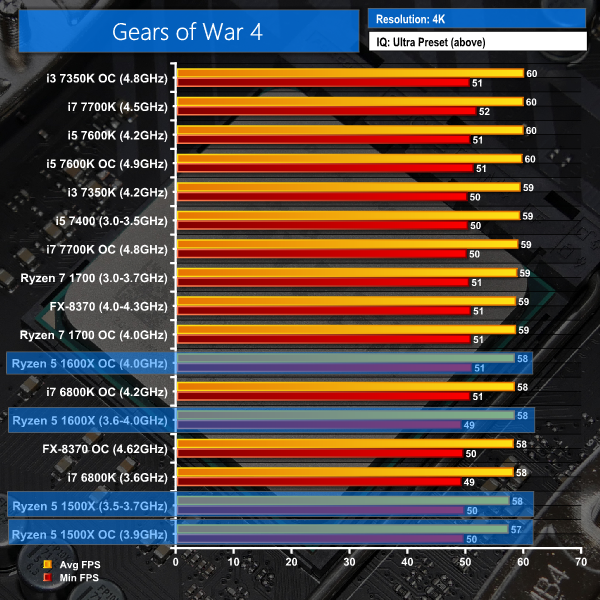
Gears of War 4
Gears of War 4 is a third-person shooter available on Xbox One and in the form of a well-optimised DX12-only PC port. We run the built-in benchmark using DirectX 12 (the only API supported), a 1080p resolution, the Ultra quality preset, and Async Compute enabled.
Note: The Core i7-2700K, i5-3570K, and i7-4790K are not shown in Gears of War 4 as the game download was too large to install on their system SSD and the clunky Windows Store platform gives errors when moving games installed on a secondary SSD between test systems.
Game version 9.8.0.2 used for current testing (earlier version used for previous testing).
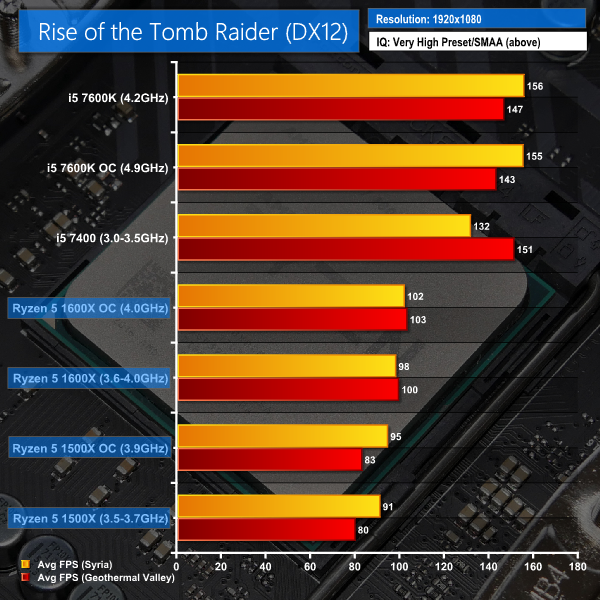
Rise of The Tomb Raider
Rise of The Tomb Raider is a popular title which features both DX11 and DX12 modes. Heavy loading can be placed on the CPU, especially in the Syria and Geothermal Valley sections of the built-in benchmark.
We run the built-in benchmark using the DirectX 12 mode, a 1080p resolution, the Very High quality preset, and SMAA enabled.
Note: Rise of the Tomb Raider numbers were showing variation to the data gathered in previous reviews. As such, we have retested with the CPUs relevant for this comparison and removed the previously-acquired data.
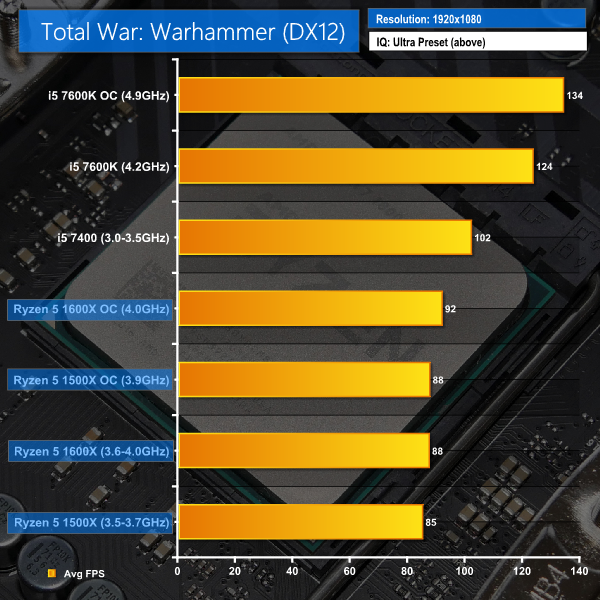
Total War: Warhammer
Total War: Warhammer is another title which features both DX11 and DX12 modes. Heavy loading can be placed on the CPU using the built-in benchmark. The DX12 mode is poorly optimised and tries to force data through a low number of CPU threads rather than balance operations across multiple cores. As such, this gives a good look at pure gaming performance of each CPU in titles that aren't well multi-threaded.
We run the built-in benchmark using the DirectX 12 mode, a 1080p resolution, and the Ultra quality preset.
Note: A game update for Total War: Warhammer has provided a performance increase on AMD and Intel CPUs to the tune of 5%. As such, we have retested with the CPUs relevant for this comparison and removed the previously-acquired data.


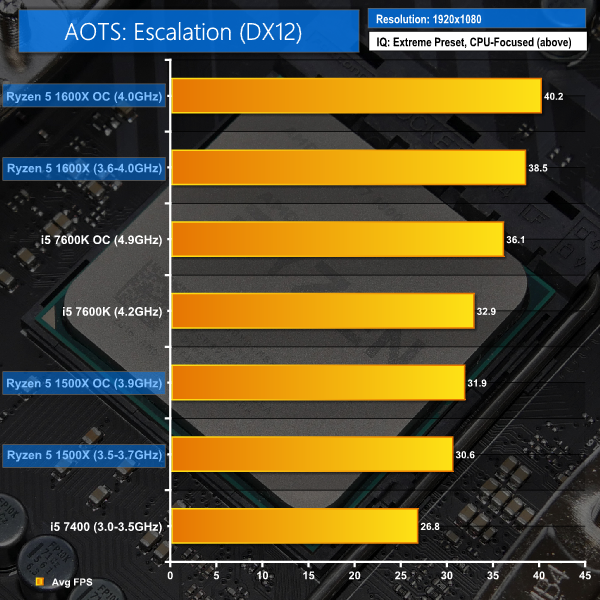
Ashes of the Singularity: Escalation replaces the original game in our test suite thanks to its newer update cycle. The most recent game update deploys optimisations that have boosted Ryzen 7 performance by up to 31%, according to AMD. Ryzen 5 1600X performs well in this game benchmark thanks to the engine’s ability to fully leverage twelve threads. Core i5-7600K performance is surpassed by the 1600X but it is certainly not eclipsed by any stretch of the imagination.
A recent update to Gears of War 4 looks to have delivered a decrease in Ryzen performance but the Core i5-7600K is practically unchanged. At the game’s Ultra image quality preset, the Core i5-7600K is faster than the Ryzen 5 1600X by a significant margin. This DX12 game is well multi-threaded but the full performance of Ryzen 5 1600X’s twelve threads cannot be extracted. Some SMT threads are being used but not at a particularly high percentage, which is good for users wanting to run background tasks. The unlocked i5 was pinned at 95%+ usage across its four cores.
Rise of the Tomb Raider is another game that has undergone a recent update that adjusts performance. The Core i5-7600K wins in this game benchmark by allowing the Titan X Pascal graphics card to flex its muscle. Ryzen 5 1600X delivers strong performance at around 100 FPS on average. You will have to be a high refresh rate gamer to notice a severe performance deficit for the Ryzen 5 CPU in this game. Resource utilisation on the Ryzen 5 CPU was high; all twelve threads were loaded to around 60%+, with a single thread running at significantly higher utilisation levels (80%+). The Core i5-7600K was glued close to 100% usage for its result.
Total War: Warhammer delivers an improvement to Ryzen performance that also helps the Intel Core i5 CPUs, based on our testing. This game’s benchmark sees data trying to be pushed through one or two threads, making improvements to performance a task for greater frequencies and IPC capability. The Kaby Lake i5 wins in this test but, as has previously been the case, you’ll need a high refresh rate monitor to notice a significant difference.
The market for people buying an expensive CPU and using it for gaming at 1080p is likely to be very slim. What 1080p does is give a good indication of the CPU's raw gaming performance as GPU power is sufficient to push frame rates to a level where the CPU and memory limitations can be observed.
We supplement the 1080p gaming results with a trio of games tested at 4K using the same Titan X Pascal graphics card that pushed through our 1080P suite. That saving against Intel's competing CPUs with similar core counts could buy a nice 4K monitor, so we will show how Ryzen 5 performs at such a resolution.
Gears of War 4
We run the built-in benchmark using a 4K resolution and the same settings as the 1080p test (Ultra quality preset, Async Compute enabled).
Game version 9.8.0.2 used for current testing (earlier version used for previous testing).
Note: The Core i7-2700K and i7-4790K are not shown in Gears of War 4 as the game download was too large to install on their system SSD and the clunky Windows Store platform gives errors when moving games installed on a secondary SSD between test systems.
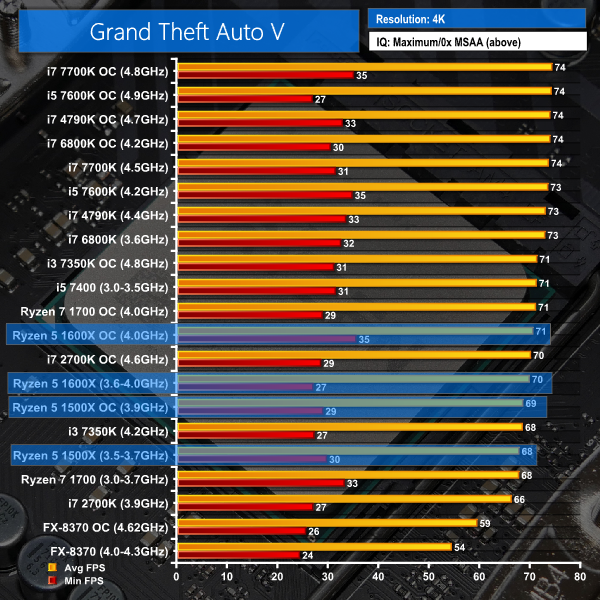
Grand Theft Auto V
We run the built-in benchmark using a 4K resolution and the same settings as the 1080p test (generally Maximum quality settings including Advanced Graphics). VRAM usage at 4K, according to the built-in GTA V counter, is 4171MB.

The Witcher 3 Wild Hunt
We run our custom 107-second benchmark in a densely-populated town area using a 4K resolution and the same settings as the 1080p test (Maximum quality, Nvidia settings disabled).
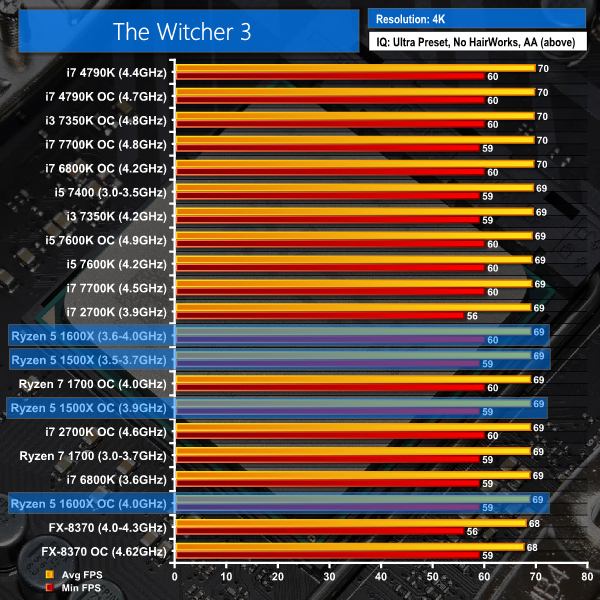
With such onus being put on the Titan X Pascal graphics card’s capability at 4K, performance differences between Ryzen 5 and modern Core i5 processors are minor. GTA V continues to show its preference for Intel hardware by offering up a slight performance advantage on the Core i5. However, the differences in The Witcher 3 and Gears of War 4 are negligible.
Feedback on our Ryzen 7 reviews highlighted that many users are interested in the performance comparisons between CPUs when partnered with a sensible graphics solution for the given price point. 1440P resolution testing was also shown to be in strong demand.
We have taken that feedback on board and have added test data for the Ryzen 5 and Core i5 Kaby Lake CPUs running with a GTX 1070 8GB Founder's Edition graphics card and a 1440P gaming resolution. We feel that the GTX 1070 currently hits a strong sweet-spot for graphics performance and cost to many Ryzen 5 buyers and also 1440P gamers.
The testing was conducted with the CPUs overclocked to their highest levels (4.0GHz for the Ryzen 5 1600X, 3.9GHz for the Ryzen 5 1500X, 4.9GHz for the i5-7600K, and stock 3.0-3.5GHz for the locked i5-7400) in order to show how a user can squeeze out 1440P gaming performance from their CPU.
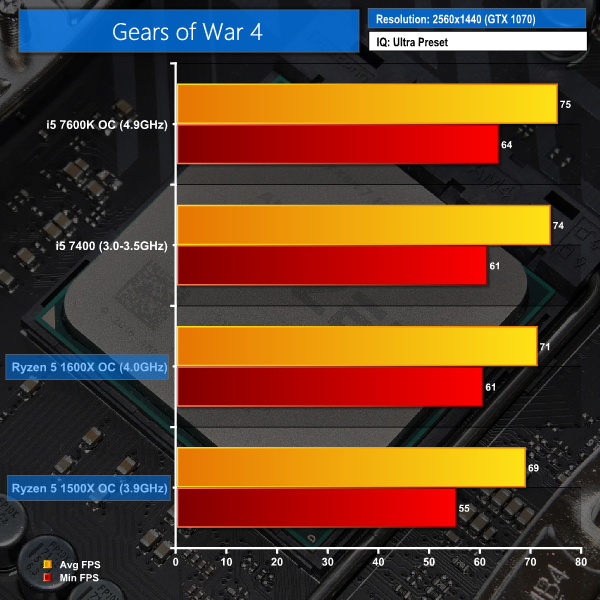
Gears of War 4
We run the built-in benchmark using a 2560×1440 resolution and the same settings as the 1080p and 4K tests that can be found on other pages (Ultra quality preset, Async Compute enabled).
Game version 9.8.0.2 used for current testing (earlier version used for previous testing).
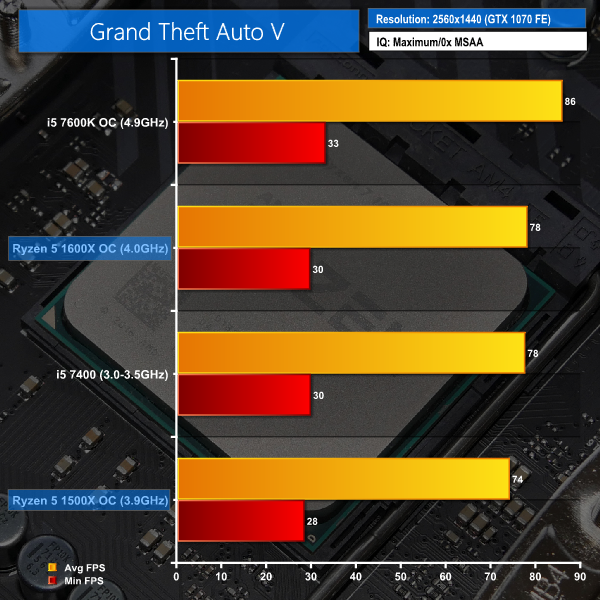
Grand Theft Auto V
We run the built-in benchmark using a 2560×1440 resolution and the same settings as the 1080p and 4K tests that can be found on other pages (generally Maximum quality settings including Advanced Graphics). VRAM usage at 1440P, according to the built-in GTA V counter, is 3514MB.
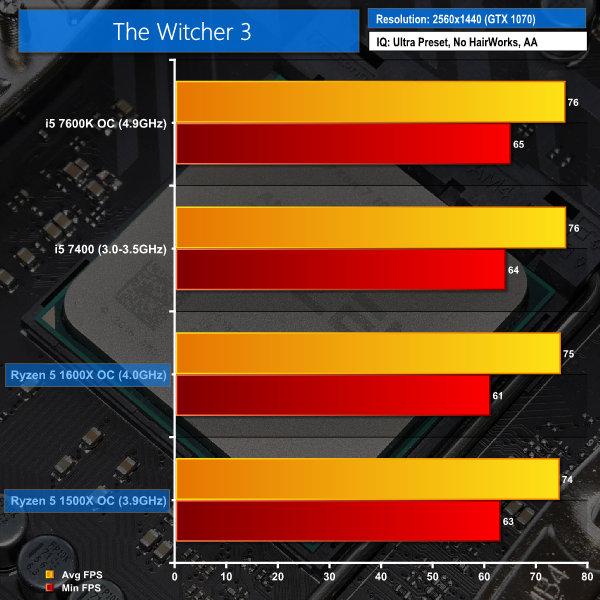
The Witcher 3 Wild Hunt
We run our custom 107-second benchmark in a densely-populated town area using a 2560×1440 resolution and the same settings as the 1080p and 4K tests that can be found on other pages (Maximum quality, Nvidia settings disabled).
With a sensible graphics card combined with the popular 1440P resolution that many Ryzen 5 gamers will be using, AMD’s six-core chip manages to stay within touching distance of Core i5-7600K performance in Gears of War 4.
GTA V is faster on the i5-7600K thanks to its high clock speed of 4.9GHz. The improvement over Ryzen 5 1600X is 8 FPS (around 10%) on average. The Witcher 3 performance is very similar between the overclocked Ryzen 5 chips and Intel’s competitors.
These results show that Intel’s Core i5-7600K is still the fastest chip for less than £250 from a pure gaming standpoint, even with a sensibly-priced graphics card and 1440P resolution. Ryzen 5 is, however, far more competitive in this test scenario than at 1080P with a significant excess in GPU horsepower.
We leave the system to idle on the Windows 10 desktop for 5 minutes before taking a power draw reading. For CPU load results we read the power draw while running the Cinebench multi-threaded test as we have found it to push power draw and temperature levels beyond those of AIDA 64 and close to Prime 95 levels. Cinebench has a short run time on high-performance CPUs which influences the validity of the temperature reading, so we run AIDA64 stress test to validate data.
The power consumption of our entire test system (at the wall) is shown in the chart. The same test parameters were used for temperature readings.
Power Consumption
Power draw readings are accurate to around +/- 5W due to fluctuations in the value even at sustained load. We use a Platinum-rated Seasonic 760W PSU and install a GTX 1070 video card that uses very little power.
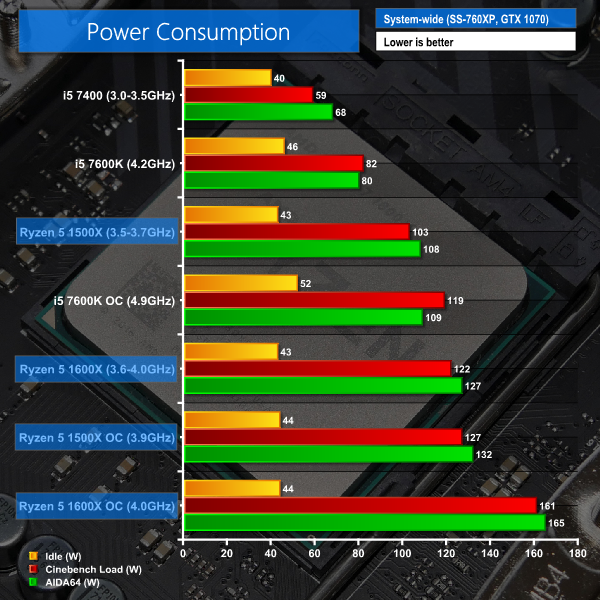
Given its six physical cores and twelve threads, system-wide power draw from the Ryzen 5 1600X configuration is fine. Our test system pulled around 50% more power for a stock Ryzen 5 1600X compared to a stock Core i5-7600K. That’s an excellent metric given the 78% Cinebench performance lead for the 1600X.
Overclocking adds a very similar amount of power to the Ryzen 5 1600X solution as it does to the Core i5-7600K. Ryzen 5’s flagship demands around 40W (33%) more power than our overclocked i5-7600K configuration but offers 70% higher performance in Cinebench. On a performance-per-Watt basis, the 6C12T Ryzen 5 1600X is vastly superior to Intel’s competing Core i5, based on our Cinebench results.
Temperatures
Temperature recordings were taken using the superb, cost-effective Cooler Master Hyper 212X for the Ryzen 5 1600X and the Core i5-7600K. The supplied coolers are used for Ryzen 5 1500X (AMD's Wraith Spire) and Core i5-7400 (Intel E97379-003 with an Aluminium slug).
Each CPU cooler's fan was running at full speed. Ambient temperature was maintained at around 20°C.
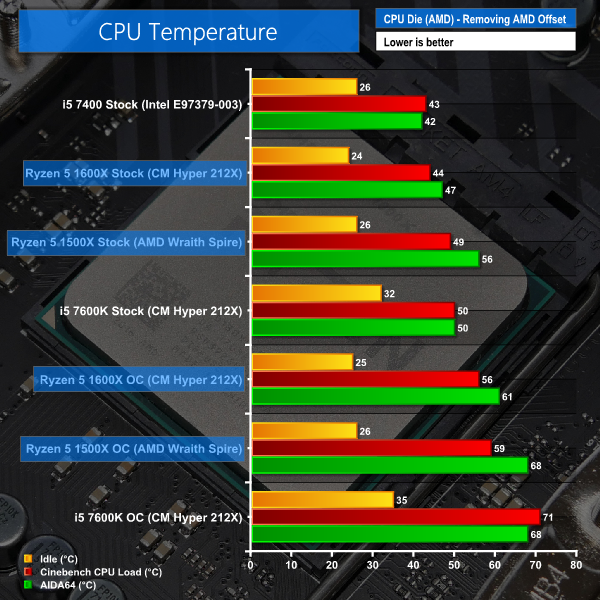
No complaints with Ryzen 5 1600X temperatures from us. AMD’s update to Ryzen Master, combined with other software makers’ patches, also help to provide clarity on the +20C offset (that we manually removed to provide the charted temperature readings).
The cost-effective Cooler Master Hyper 212X does a stellar job at keeping the twelve-thread part well-cooled. AMD’s superb heatspreader design puts that of Intel’s solution on Kaby Lake to shame.
Despite drawing less power, the Core i5-7600K runs hotter than Ryzen 5 on a stock-versus-stock and OC-versus-OC basis. Clearly Intel’s implementation of TIM under the Kaby Lake part’s heatspreader is sub-par.
With Ryzen 5, AMD builds upon the foundations set by the flagship 8C16T Ryzen 7 processors, and that’s generally a good thing.
Performance in multi-threaded workloads is in a different league to Intel’s price-comparable competitor processors. Ryzen 5 happily takes on the entry-level HEDT six-core in computational workloads and delivers it an embarrassing blow by offering similar performance at a £150 cheaper asking price.
In terms of raw computational performance, Ryzen 5 1600X with its six cores and SMT is faster than anything that Intel can offer outside of its consumer HEDT platform.
However, following the Ryzen 7 trend also means that Ryzen 5’s gaming performance is not as strong as its Intel competitors. At 1080P with a large excess in GPU horsepower, the Ryzen 5 performance deficits are evident and will be deal-breakers to high refresh rate gamers. That’s disappointing given that this is the price point where pure PC gamers have found such value with Intel’s multiplier-unlocked Core i5 quad-cores over the years.
With that said, higher resolution gaming with graphics cards of appropriate power for 1440P and 4K monitors is fine on Ryzen 5. The Core i5-7600K is still slightly faster at 1440P when paired with a GTX 1070 but the performance gap is narrowed by a significant margin. 4K performance from Ryzen 5 1600X is practically identical to that of the Core i5 competition due to such emphasis being put on GPU capabilities.
There is the added dimension of spare CPU performance for Ryzen 5 1600X. In some of our gaming tests, the twelve-thread 1600X had utilisation in the 50% region. This means that somebody interested in game streaming or multitasking whilst gaming still has around half of their processor to dedicate to such tasks. The same cannot be said about the Core i5-7600K that was generally closing in on maximum utilisation for its gaming results (albeit with better performance numbers than Ryzen 5 1600X).
Power consumption is good, especially for prosumers who may care about computational efficiency. On a performance-per-Watt basis using Cinebench numbers, the Ryzen 5 1600X is vastly superior to Intel’s Core i5-7600K. Thermal performance is also good, with the Ryzen 5 chip running cooler than Intel’s Kaby Lake i5-7600K, despite consuming more power and offering significantly higher Cinebench performance. The benefits of a smart heatspreader design with effective TIM. Well done, AMD. Take note, Intel.
Our conclusion for Ryzen 5 1600X follows a similar tone to that of the Ryzen 7 parts. If you do nothing other than game on your computer and don’t want to wait for ‘suggested’ performance optimisations, Intel’s competing Core i5-7600K is currently the better choice. However, if gaming is only one aspect of your daily computer usage and you conduct any tasks that involve heavy multi-threading, the Ryzen 5 1600X and its twelve threads offer a sizeable performance increase over Intel’s 4C4T competitors. With that said, workloads that benefit from twelve threads are likely to benefit from sixteen threads. That makes the Ryzen 7 1700 a reasonable competitor that somewhat overshadows Ryzen 5 1600X, but it is also more expensive.
Ryzen 5 1600X is punching well above its weight in terms of raw computational performance. To prosumers with a strict budget limitation, that’s a great characteristic. Combined with a sensible graphics card for this price range, the gaming performance deficit against Intel’s Kaby Lake competition may be narrowed sufficiently to tempt users with multi-faceted workload requirements.
The AMD Ryzen 5 1600X will be available for £249.99.
Discuss on our Facebook page HERE.
Pros:
- Superb multi-threaded computational performance that obliterates the Core i5-7600K.
- Multi-threaded performance makes the i7-7700K and i7-6800K look like poor value for money.
- Plenty of spare computational capacity for game streamers.
- Power consumption numbers are positive and deliver strong computational performance-per-Watt.
- Good thermal results even with a cost-effective air cooler.
- High out-of-the-box frequencies for a six-core, twelve-thread processor.
- Aided by the price and feature flexibility of the AM4 platform.
- Unlocked CPU multiplier for straightforward overclocking.
Cons:
- Gaming performance is not as strong as Intel’s competition, which is disappointing for this market segment.
- Kaby Lake competition has significantly better single-threaded performance.
- Maximum frequency achievable is limited, especially compared to Intel’s competition.
- Ryzen 5 1600 is $30 cheaper, multiplier-unlocked, and ships with a cooler.
KitGuru says: AMD has brought six cores and twelve threads to a processor with a mainstream price point and the result is positive. Multi-threaded computational performance from Ryzen 5 1600X annihilates Intel’s comparably-priced parts and makes the more expensive 4C8T and 6C12T Core i7 processors look like poor value for money. A superb choice if gaming is not your primary focus.

Be sure to check out our sponsors store EKWB here