
For performance testing, we will be running each of these boards using the flagship AMD Ryzen 9 3900X 12-core CPU. Upping the ante, we’ll be overclocking this power-hungry beast to 4.25GHz using around 1.35V, which results in a CPU power draw that closes in on 200W – certainly a hefty task for affordable X570 motherboards.
The latest non-ABBA AGESA BIOSes were used on each board. We have seen bugs with most of the AGESA ABBA BIOSes that make Ryzen Master readings completely incorrect. As such, we stuck to the ABB BIOSes for this testing, which is fine as we were not using Precision Boost 2 or PBO.
A Note on Voltages
As voltage accuracy and load-line calibration settings are different between the motherboards, we have applied a couple of techniques to make sure our CPU voltage is kept as close as possible to our 1.35V target.
With ASRock and ASUS, this meant adjusting the load-line calibration to get a software-read voltage reading close to 1.35V. We checked the power consumption from the wall to act as a validation check (as some software readings for package power are incorrect). For the Gigabyte X570 Aorus Elite, we had to drop the voltage slightly and adjust the LLC to get to 1.35V under load.
With MSI’s MPG X570 Gaming Edge WiFi, the software-based voltage readings do not seem to be accurate. This board drew as much as 35W more power from the wall despite reading the same 1.35V voltage as other boards. We dropped the voltage slightly to try to compensate for this and to bring the wall power closer to the competing motherboards. However, the board still drew slightly more power than the competitors by around 5-15W.
Test Procedure:
Our load test case uses 1 hour of continuous full load using AIDA64. We take temperatures readings at the end of the sustained 1-hour load, ensuring that no major thermal throttling or VRM throttling has occurred throughout the specific test run.
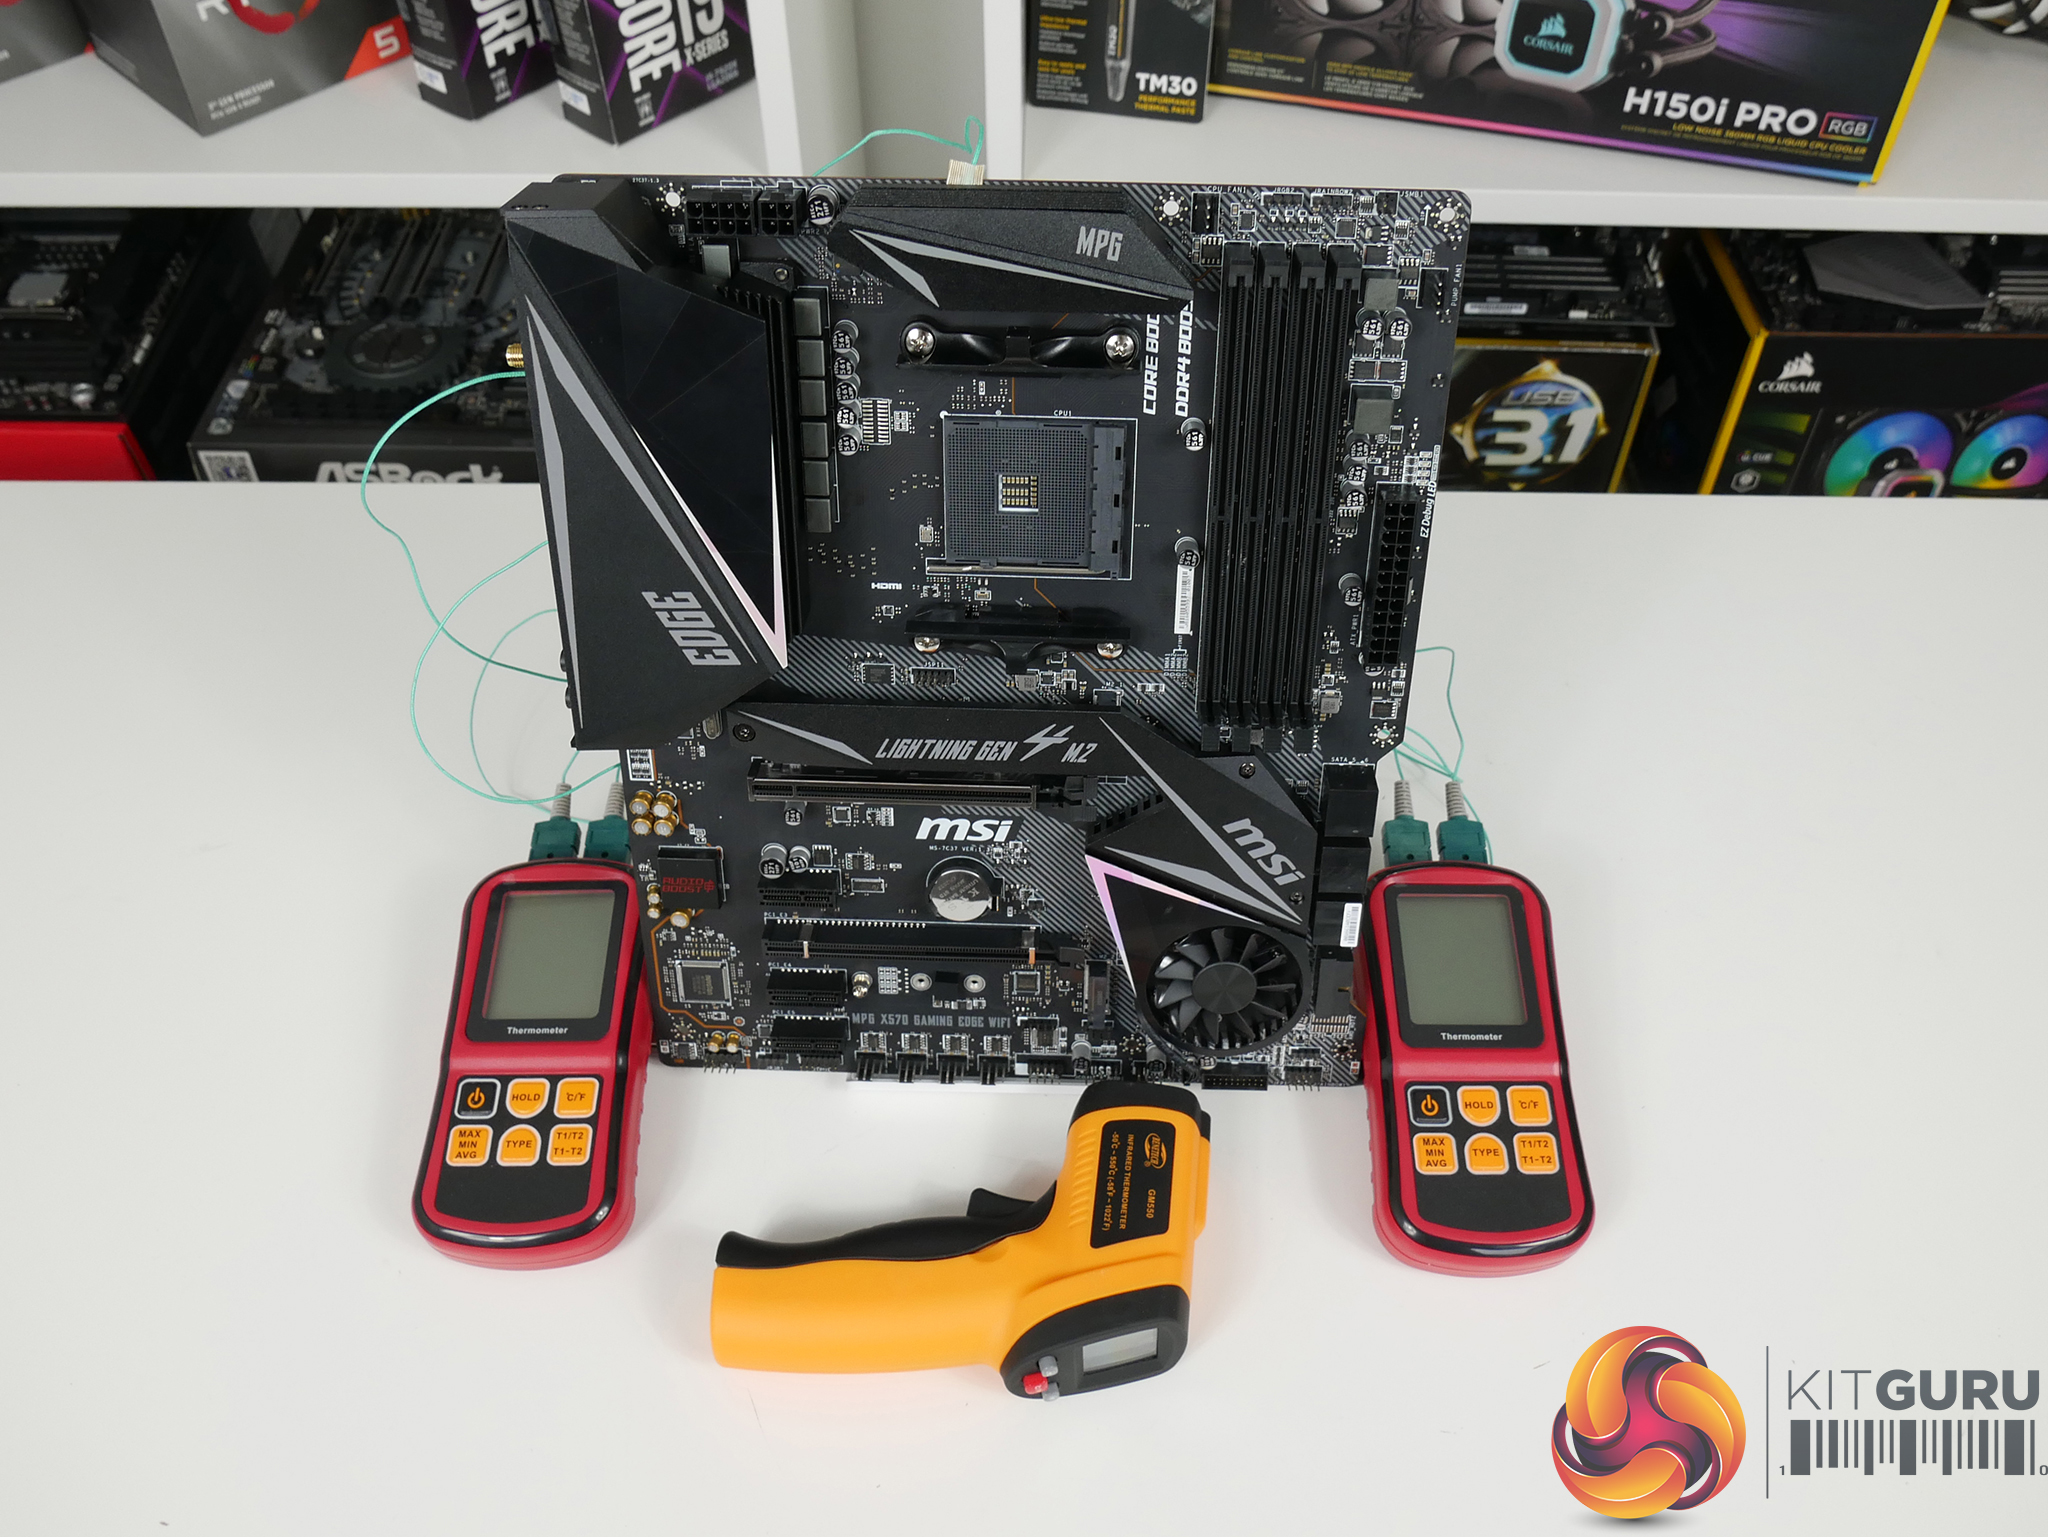
Temperature Measurement Procedure:
- We primarily use several K-type thermocouples mounted in specific locations on the motherboard to measure temperatures. Our preferred mounting positions were:
- Left side MOSFET bank at the bottom
- Left side MOSFET bank in the centre, which is the likely hottest spot
- Top MOSFET bank in the centre (where possible)
- Rear PCB, directly beneath the left-side central MOSFET
- We additionally did some validation checks by mounting on the front-side PCB directly adjacent to the left-side inductors, and also whilst mounted on the heatsink if necessary.
- As we were mounting the thermocouples directly to the MOSFET surfaces in many of our test cases, we decided to opt for flat constructed K-type thermocouples, rather than the common ‘ball-ended’ ones.
- These flat thermocouples featured a wire loop that was covered by a thin package of Kapton tape. The relative thinness of this packaging solution meant that there should be minimal interference to heat flow through to the VRM heatsink and the loop design allowed us to cover the MOSFET package surface.
- Another tool that we used was our simple hand-held laser thermometer for additional checks to PCB temperatures. This was used when the PCB had minimal reflectivity so that emissivity concerns when using this form of measurement technique could be minimised.
- We decided against using thermal imaging as we were most interested in MOSFET surface temperature with the heatsink in place, so thermal imaging would just show us heatsink temperature, which is not necessarily representative of design efficiency, performance, or underlying MOSFET temperature. Equally so, our surface measurements techniques for the PCB temperature were deemed adequate for our testing.
One of the key challenges was minimising the effect that electromagnetic interference (EMI) had on our thermocouple readings. This was especially challenging when we were forced to route the thermocouples close to capacitors or inductors.
We aimed to mitigate this issue by spot-checking PCB temperatures with the laser thermometer as a validation check. We also decided to cross-reference with software readings where they were available. And we checked temperatures with the load applied and with all power to the system killed, thus showing EMI-free readings just a few seconds after the load is removed but with heat still in the system.
X570 Test System:
- Processor: AMD Ryzen 9 3900X.
- Memory: 16GB (2x8GB) G.SKILL 3200MHz CL14 DDR4 @ 1.35V.
- Graphics Card: Gigabyte Aorus RTX 1080 Ti Gaming OC 11G (custom fan curve to eliminate thermal throttling).
- System Drive: WD Black SN750 500GB.
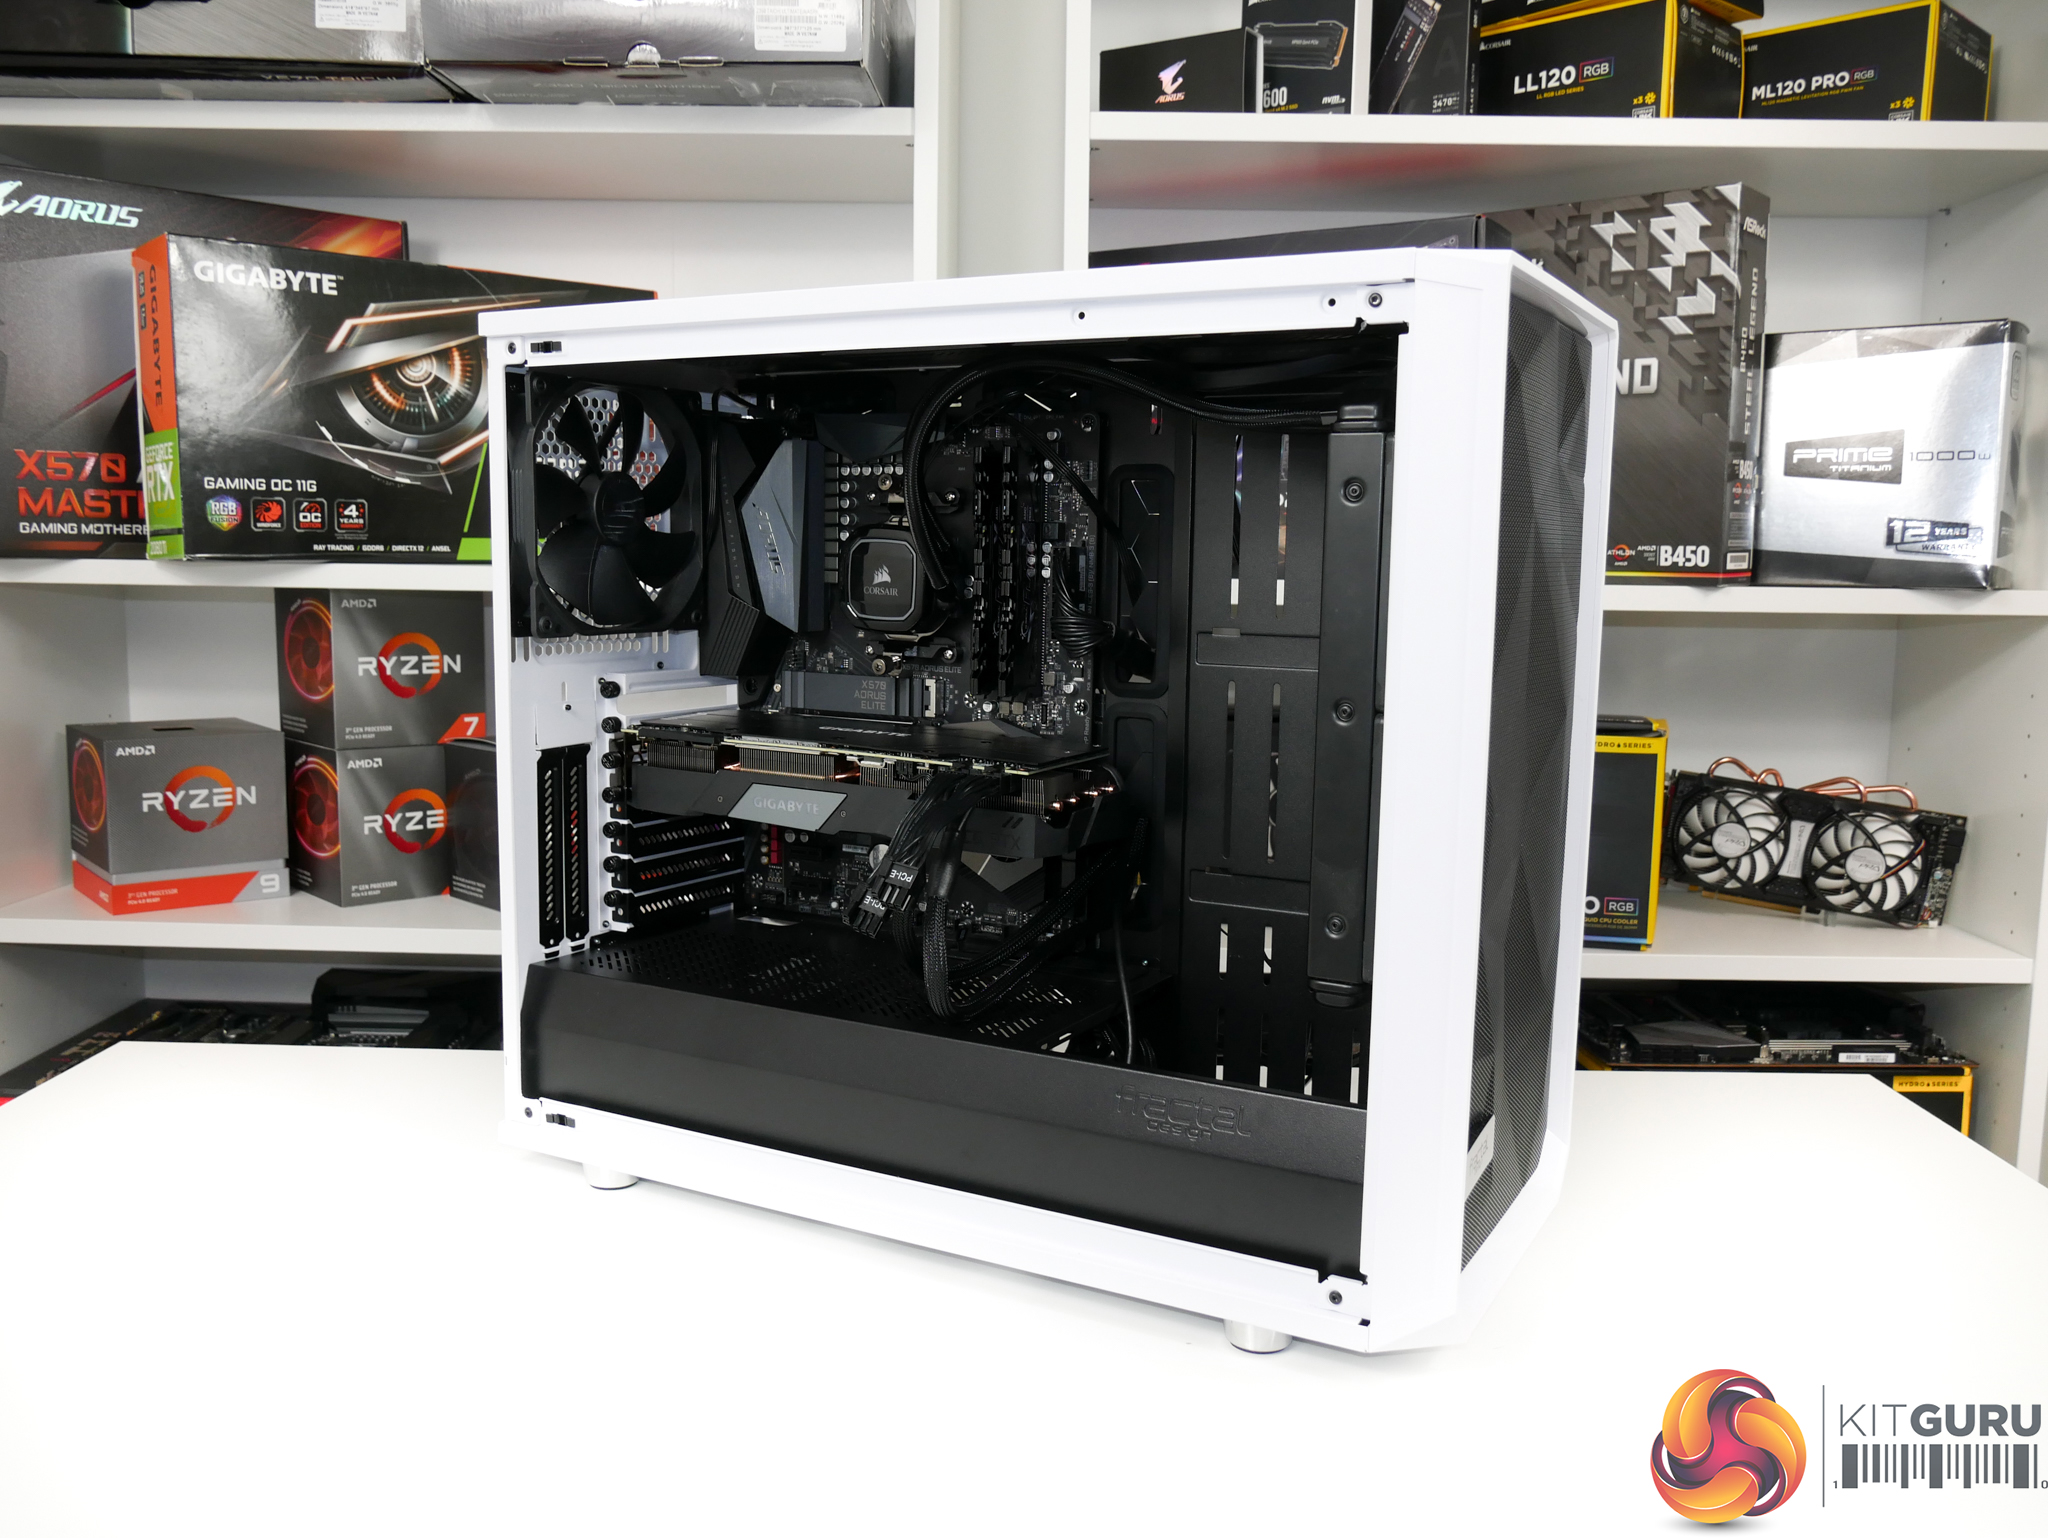
- CPU Cooler: Corsair H100X (full speed 1850 RPM Deep Cool fans).
- Case: Fractal Design Meshify S2 TG with H100X mounted as front intake and single 140mm rear exhaust.
- Power Supply: Seasonic Prime Titanium 1000W.
- Operating System: Windows 10 Pro 64-bit 1903 Update.
Ambient temperature is around 23-26°C and our charts normalise the results to 25C ambient, which is perhaps typical for UK months outside of winter.