

Following on from our launch day coverage of Sapphire's RX 590 Nitro+ Special Edition card, today our attention turns to an RX 590 offering from XFX.
With a very ‘interesting' name, shall we say, the RX 590 Fatboy is certainly going to grab your attention. Priced at £250, too, it is one of the cheaper cards we have seen based on AMD's new 12nm Polaris technology. Is it worth buying?
When RX 590 launched on November 15, we were told to expect a $279 MSRP, and here in the UK most RX 590 cards are around the £250-270 mark. That puts this XFX RX 590 Fatboy 8GB at the cheaper end of the spectrum, and it is safe to say you don't get a whole lot of features for your money – there's no RGB lighting, the cooler and overall design is quite basic, and XFX doesn't even produce its own GPU overclocking utility.
Can this card stand on its raw performance alone, or are there better options out there? Let's find out.
| GPU | AMD RX 590 | AMD RX 580 | AMD RX 570 | Nvidia GTX 1050 Ti | Nvidia GTX 1060 |
| Streaming Multiprocessors / Compute Units | 36 | 36 | 32 | 6 | 10 |
| GPU Cores | 2304 | 2304 | 2048 | 768 | 1280 |
| Texture Units | 144 | 144 | 128 | 48 | 80 |
| ROPs | 32 | 32 | 32 | 32 | 48 |
| Base Clock | 1469 MHz | 1257 MHz | 1168 MHz | 1290 MHz | 1506 MHz |
| GPU Boost Clock | 1545 MHz | 1340 MHz | 1244 MHz | 1392 MHz | 1708 MHz |
| Total Video memory | 8192 MB | 4096 or 8192 MB | 4096 MB | 4096 MB | 6144 MB |
| Memory Clock (Effective) | 2000 (8000) MHz | 2000 (8000) MHz | 1750 (7000) MHz | 1752 (7008) MHz | 2002 (8008) MHz |
| Memory Bandwidth | 256 GB/s | 256 GB/s | 224 GB/s | 112 GB/s | 192 GB/s |
| Bus Width | 256-bit | 256-bit | 256-bit | 128-bit | 192-bit |
| Manufacturing Process | 12nm | 14nm | 14nm | 16nm | 16nm |
| TDP | 175 W | 185 W | 150 W | 75W | 120 W |
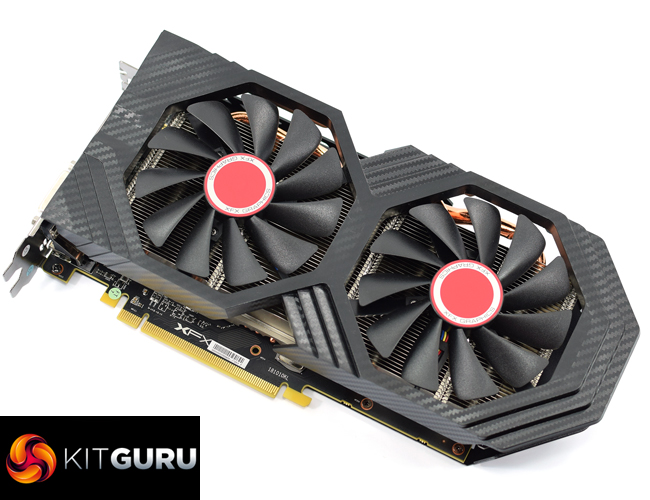
Despite AMD not releasing a reference RX 590 card, reference specs were announced, with boost clocks going up to 1545MHz. This XFX Fatboy improves on that, as it ships with a 1580MHz boost clock. Unlike the Sapphire RX 590 we reviewed for launch day, however, this XFX has left the memory at the stock 2000MHz.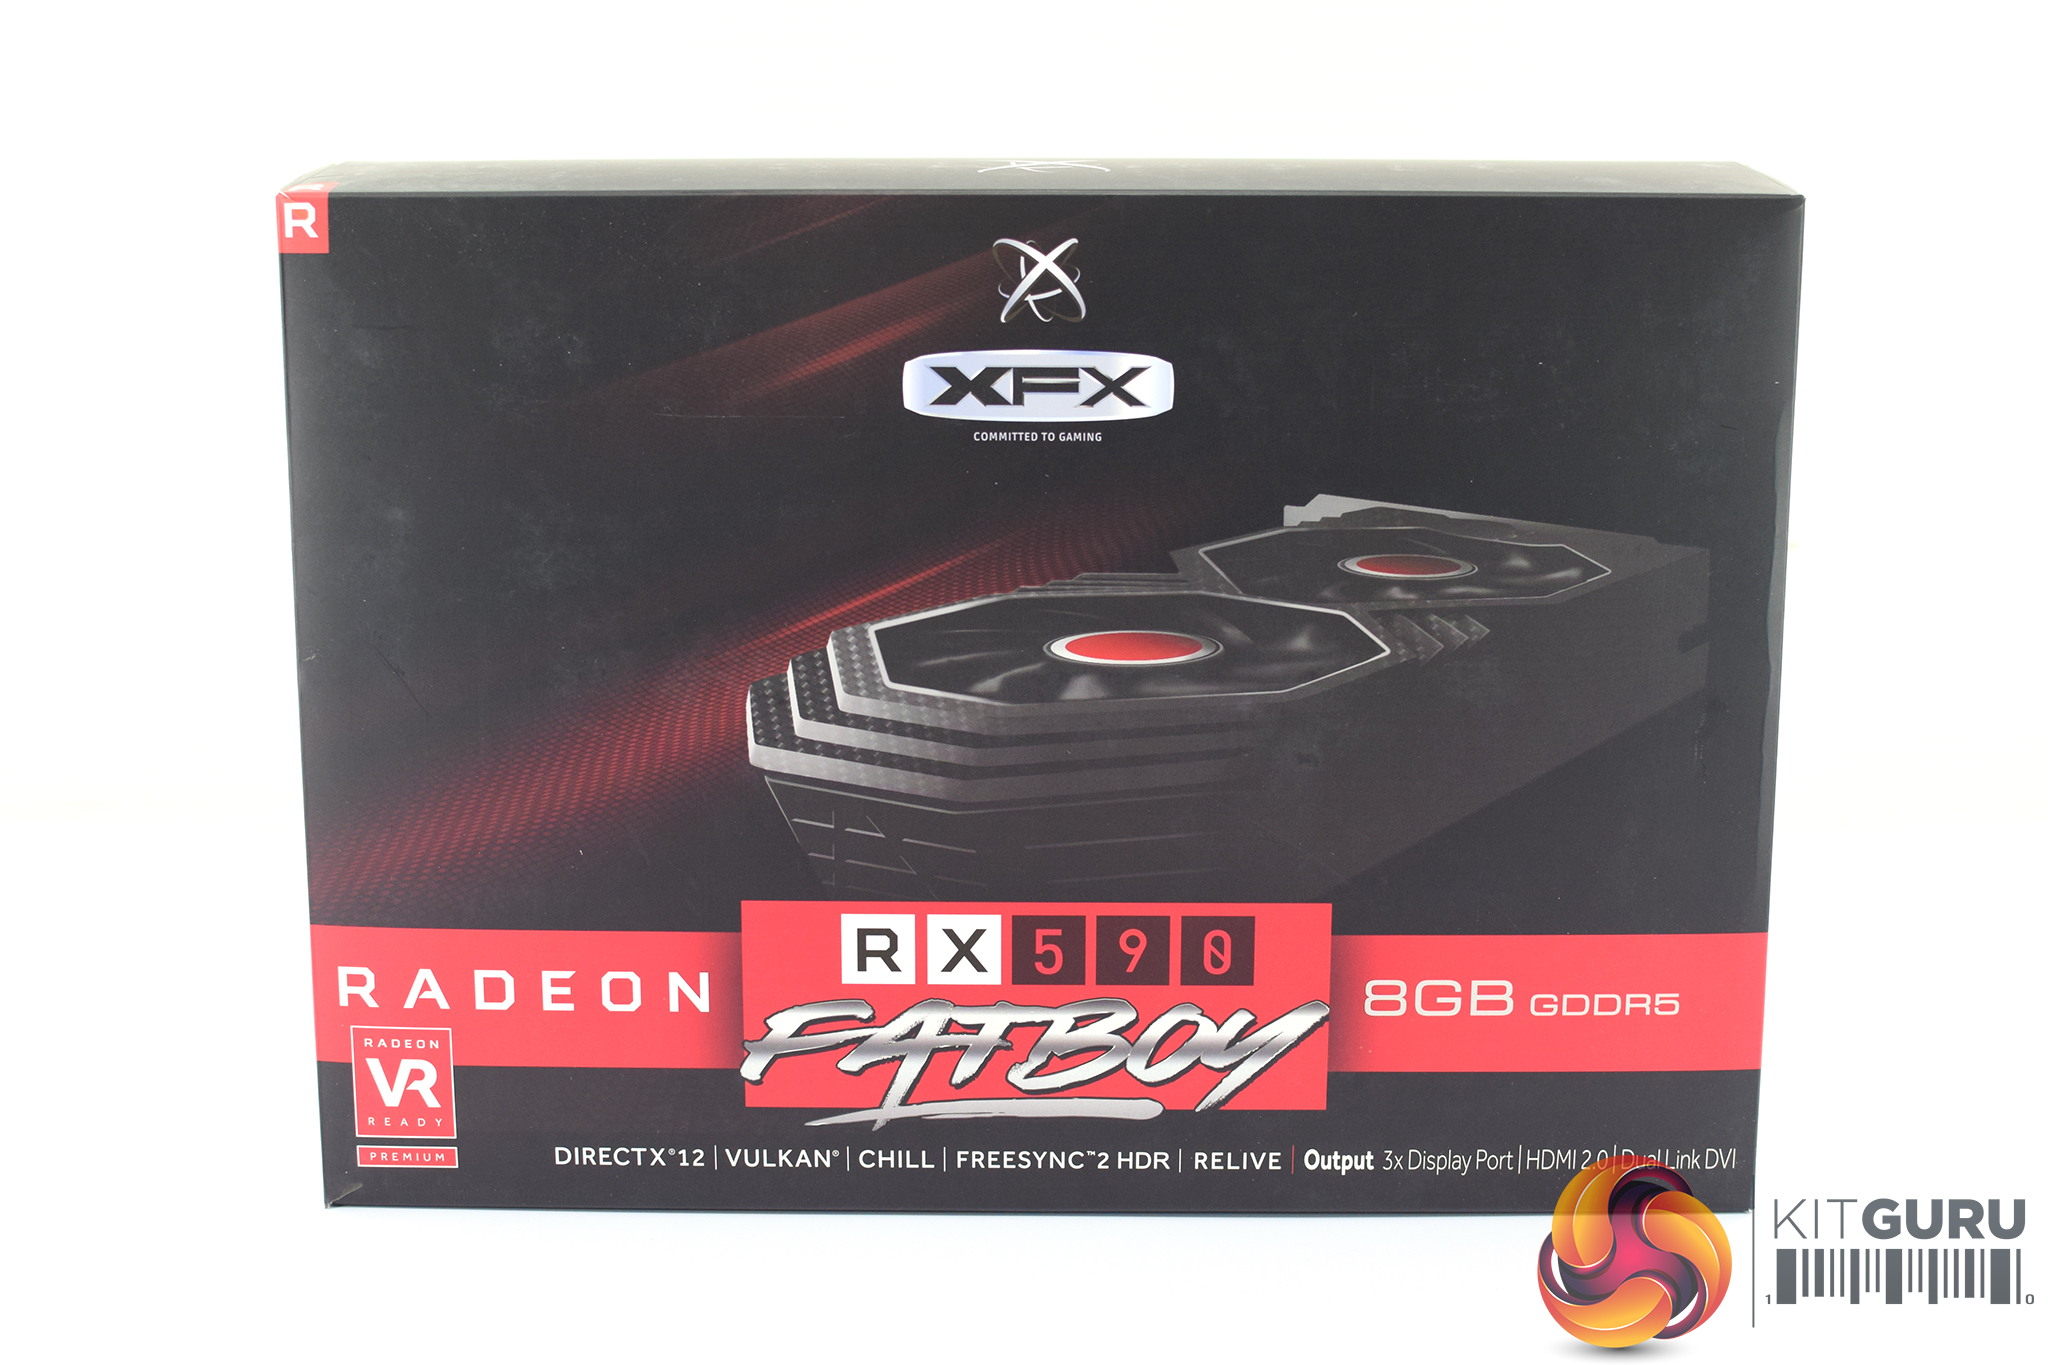
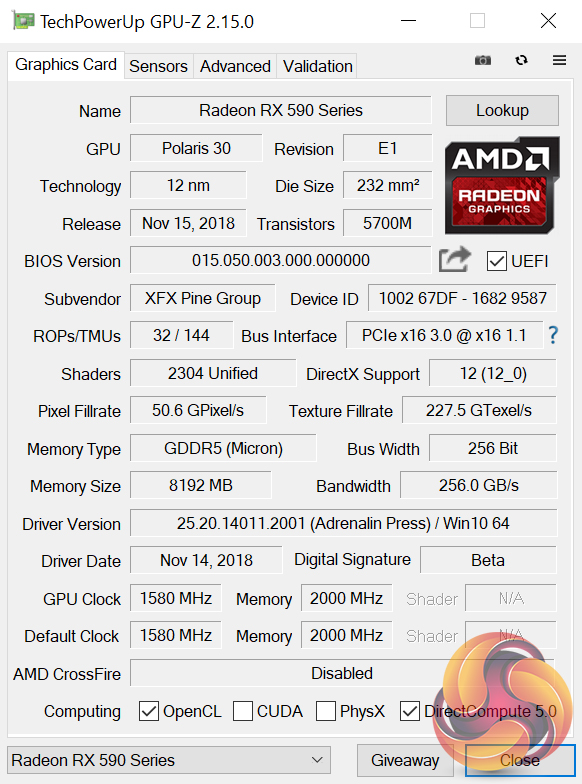
The XFX RX 590 Fatboy 8GB ships in a pretty bare-bones black box, with an image of the card on the front alongside the AMD Radeon branding.
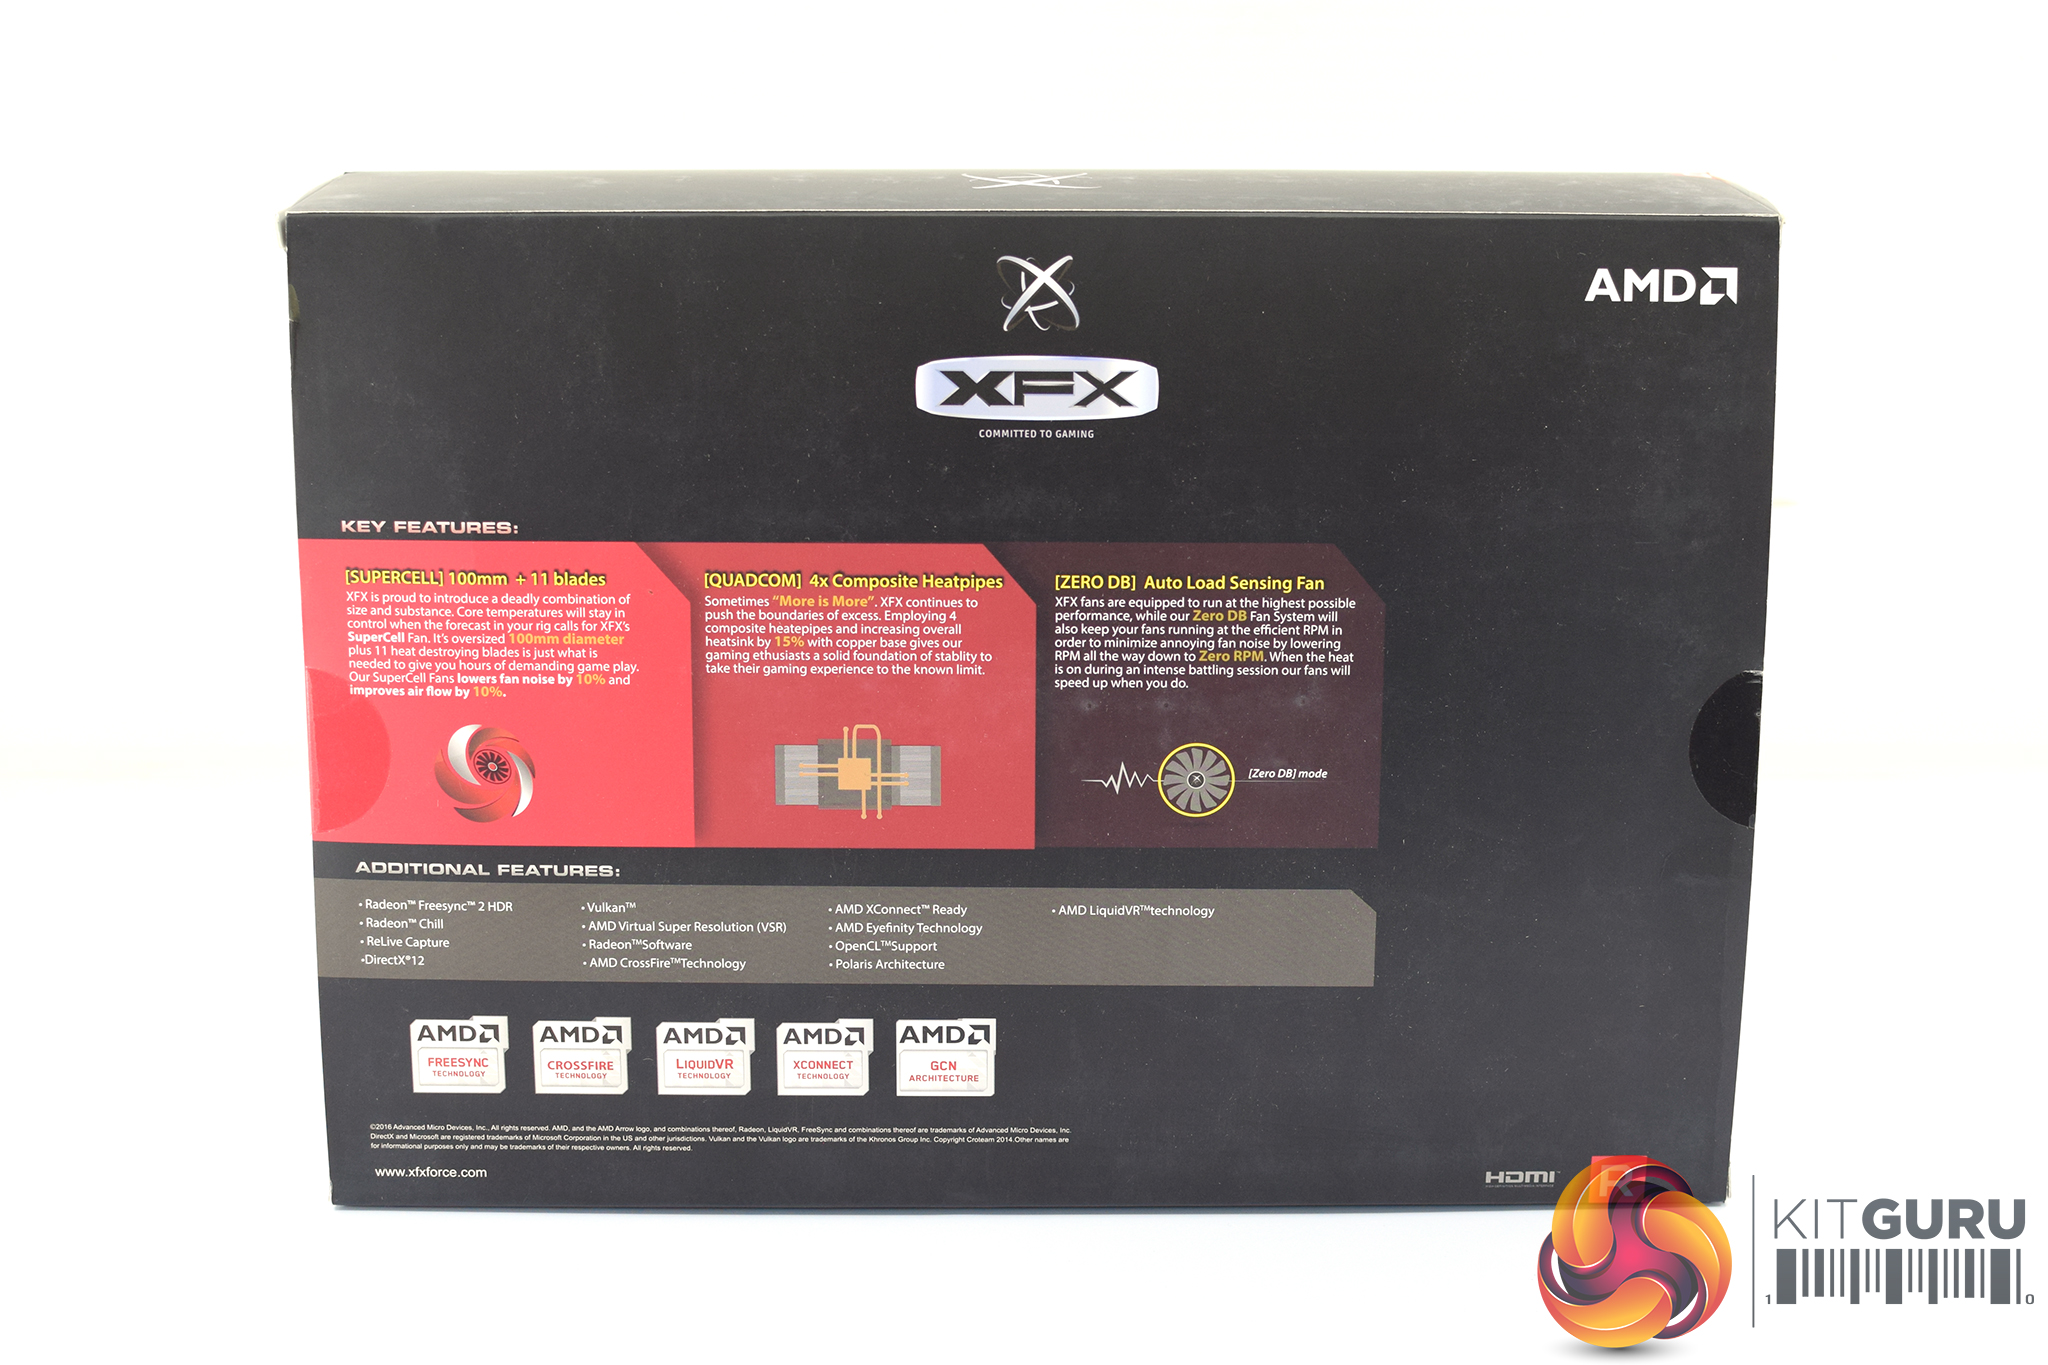
On the back of the box, three key features – the 100mm fans, composite heatpipes and zero dB mode – are highlighted, along with other Radeon features like Freesync and Chill.
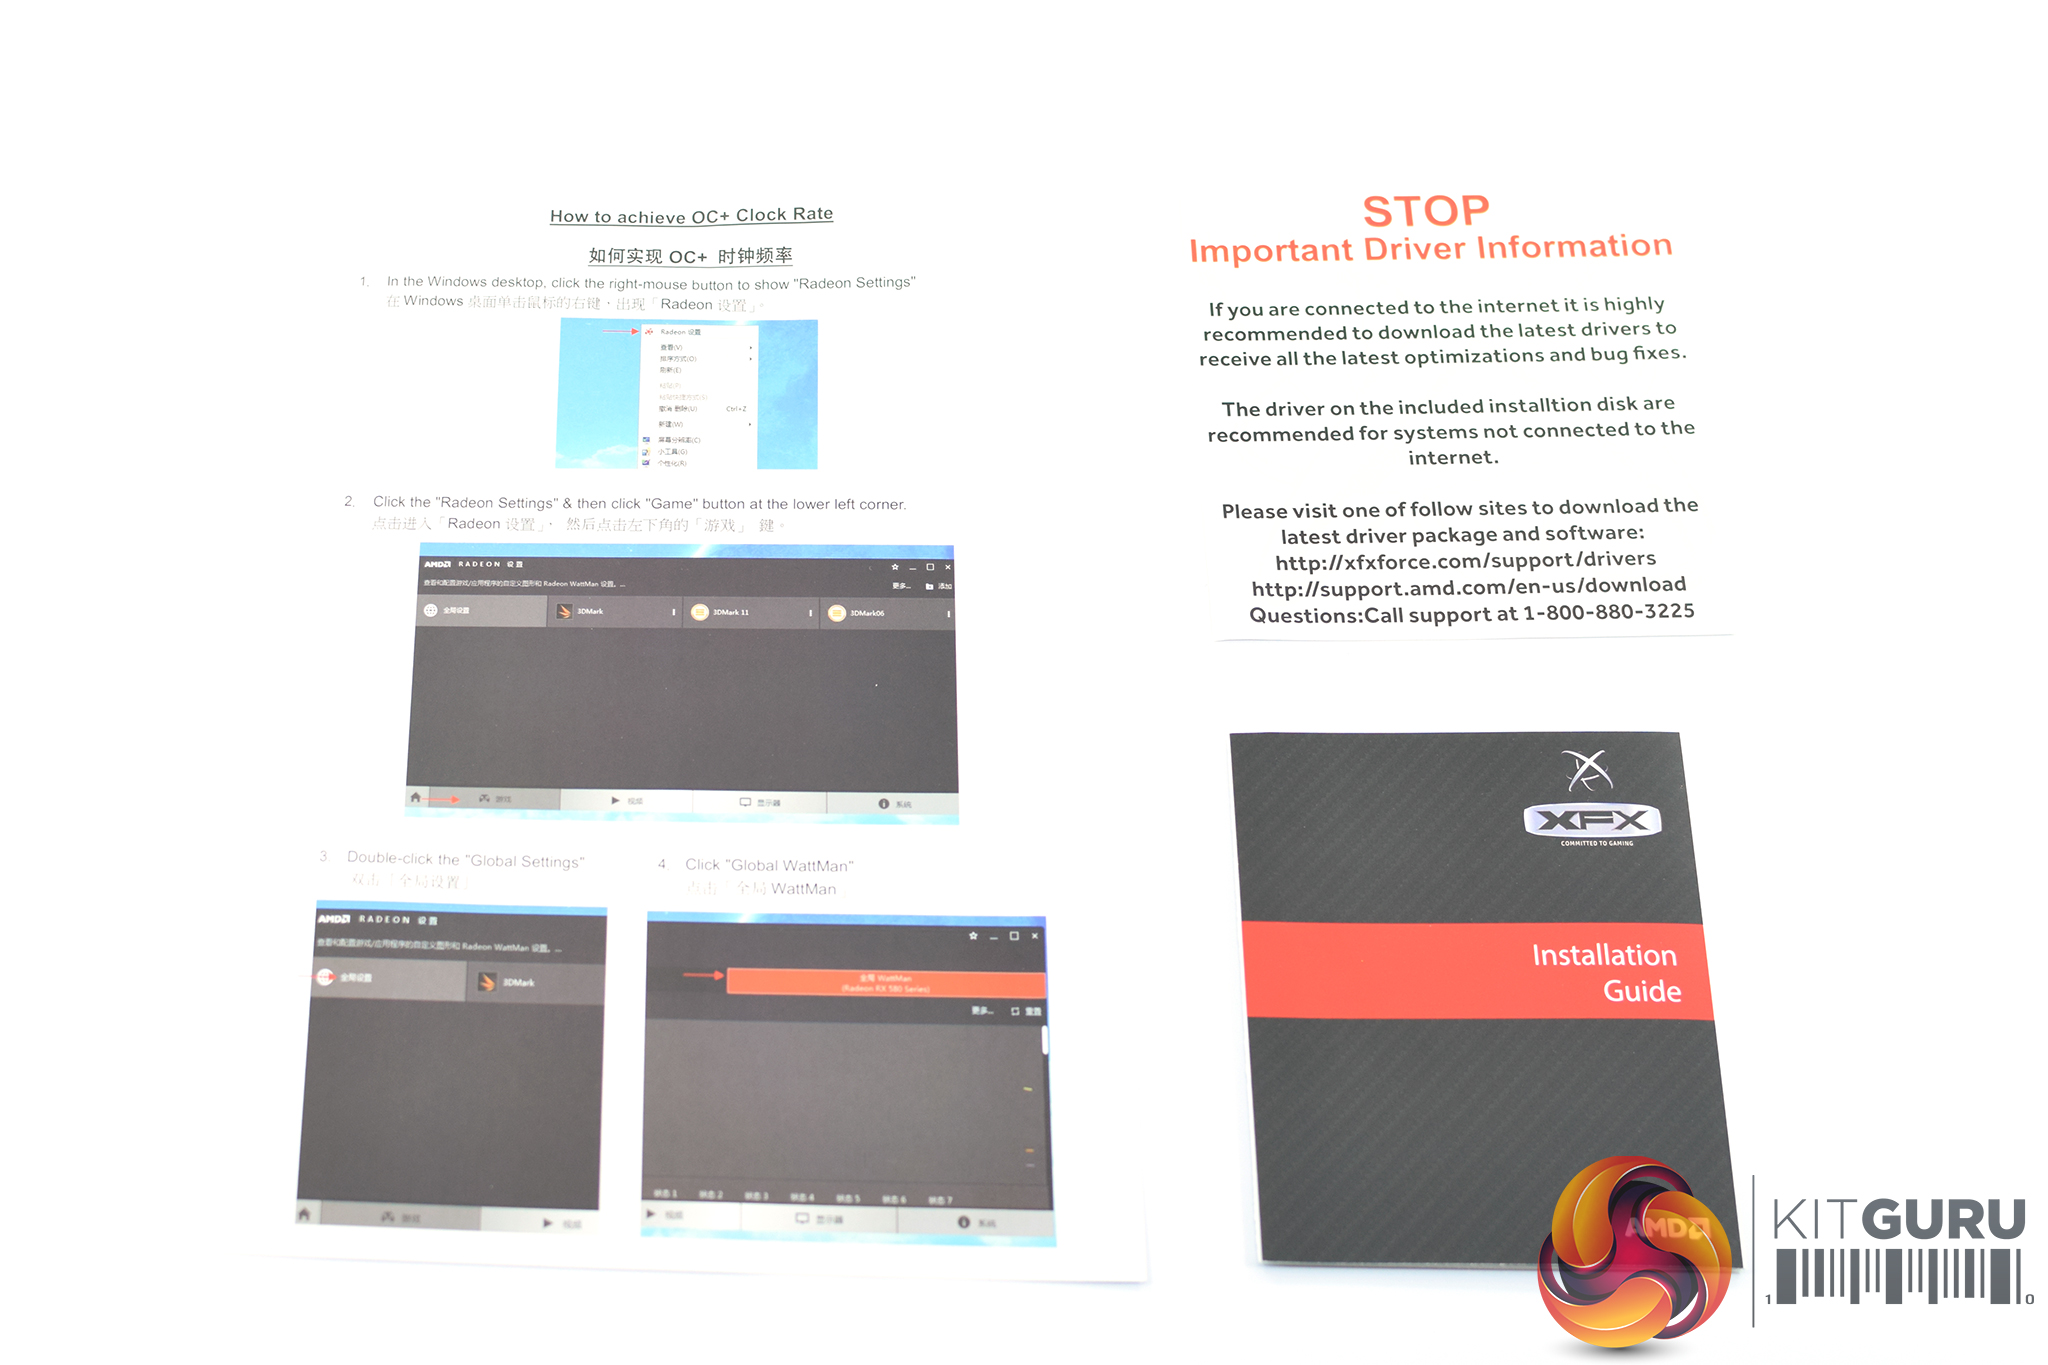
There's a few included accessories, with a quick-start guide, an overclocking ‘how-to' and and a note saying not to use the included driver disk being the first things we came across.
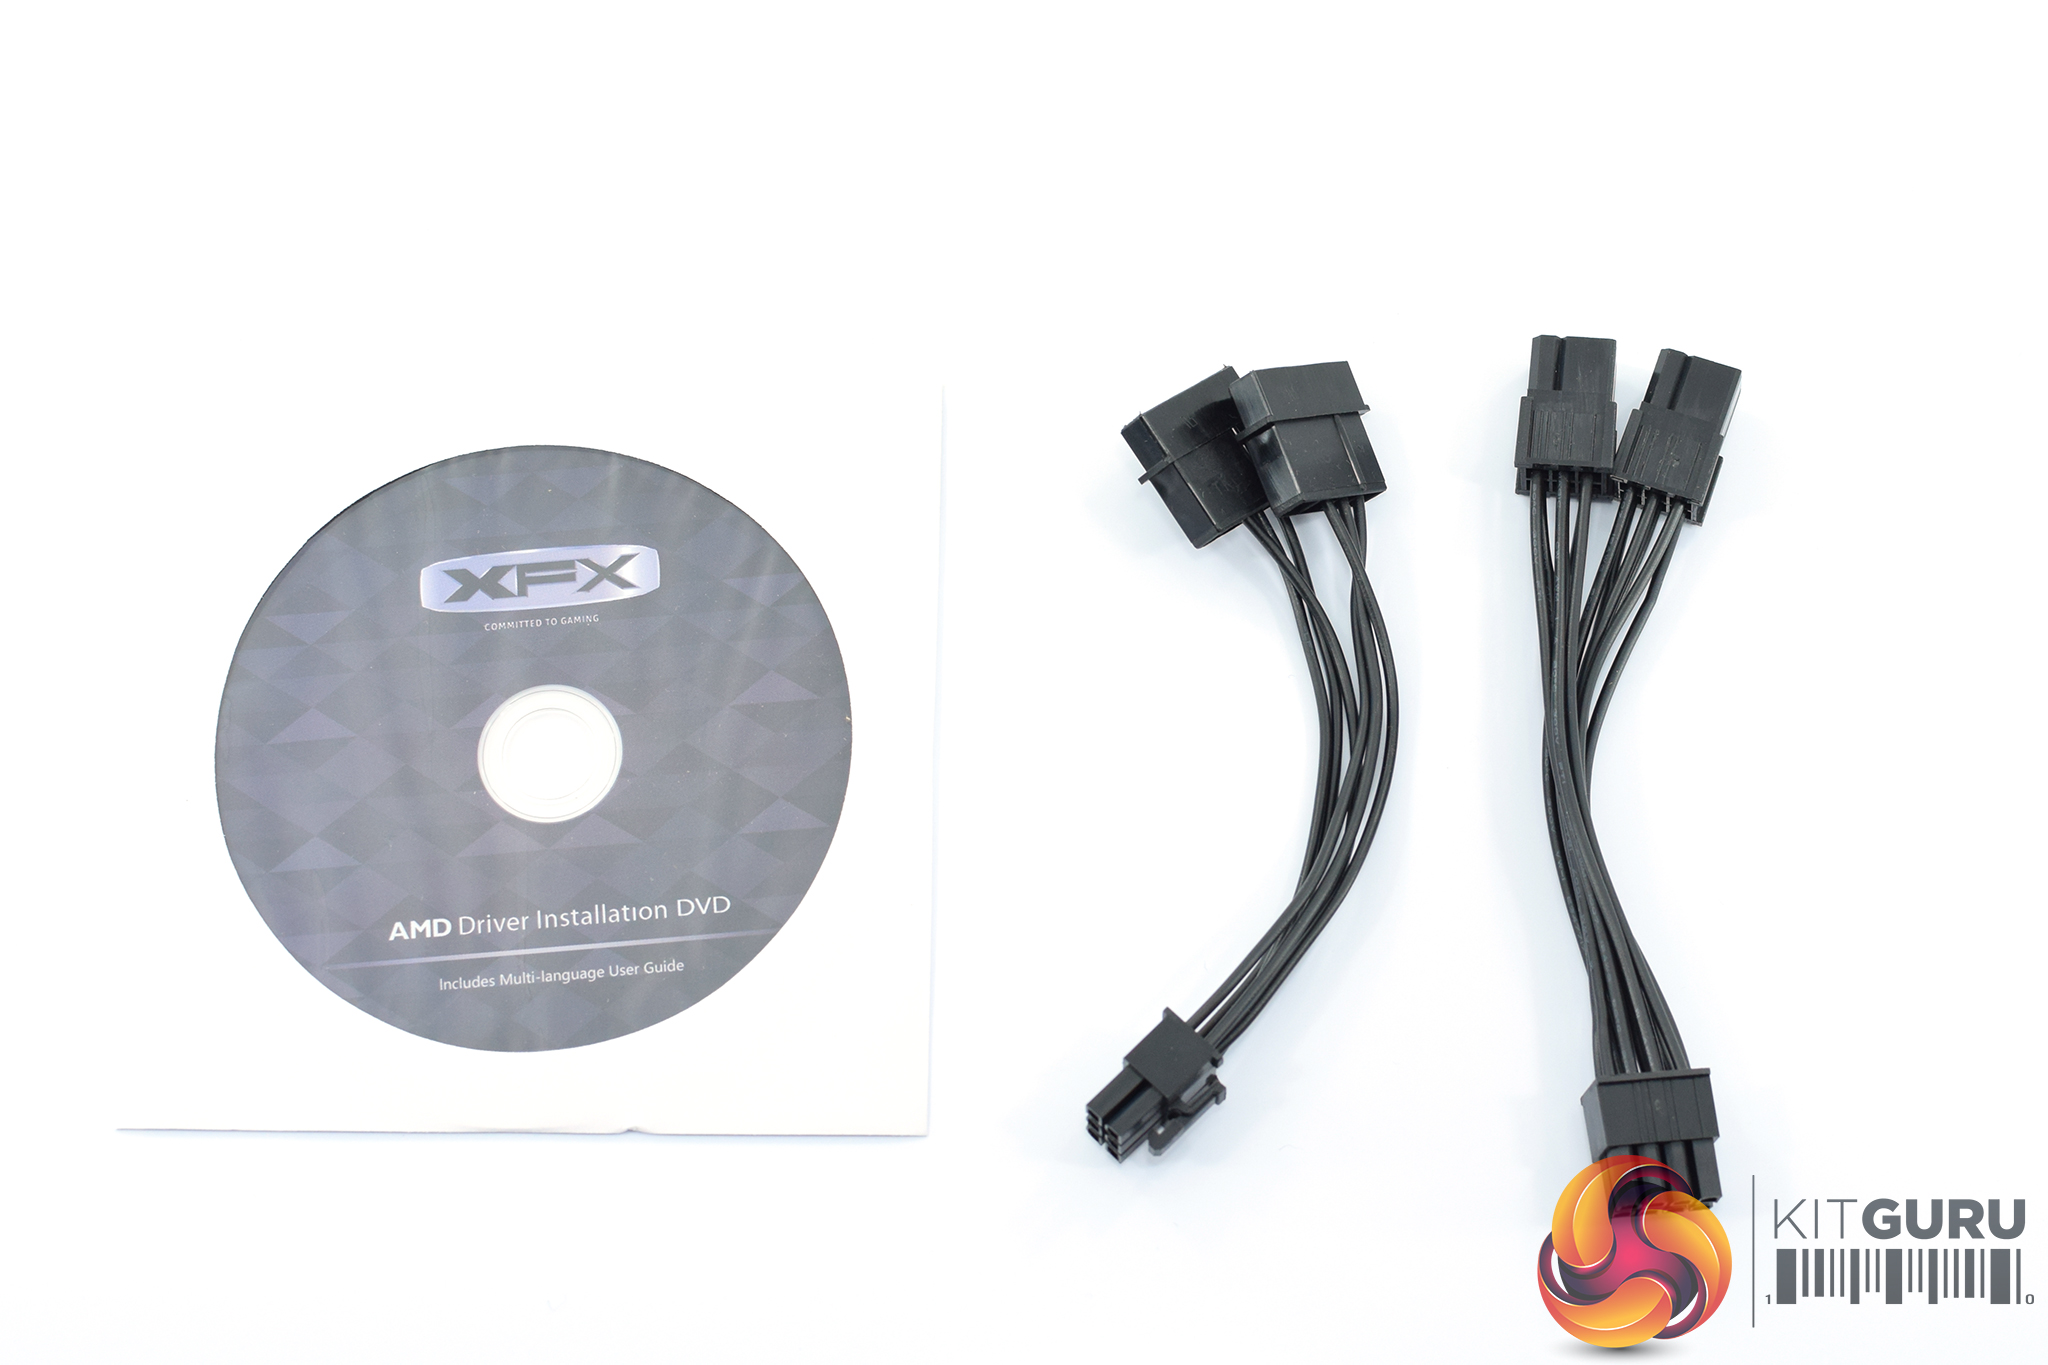
After that, the driver disk and two adapter cables (2x Molex to 1x 6-pin PCIe power, and 2x 6-pin to 1x 8-pin PCIe power) are also in the box.
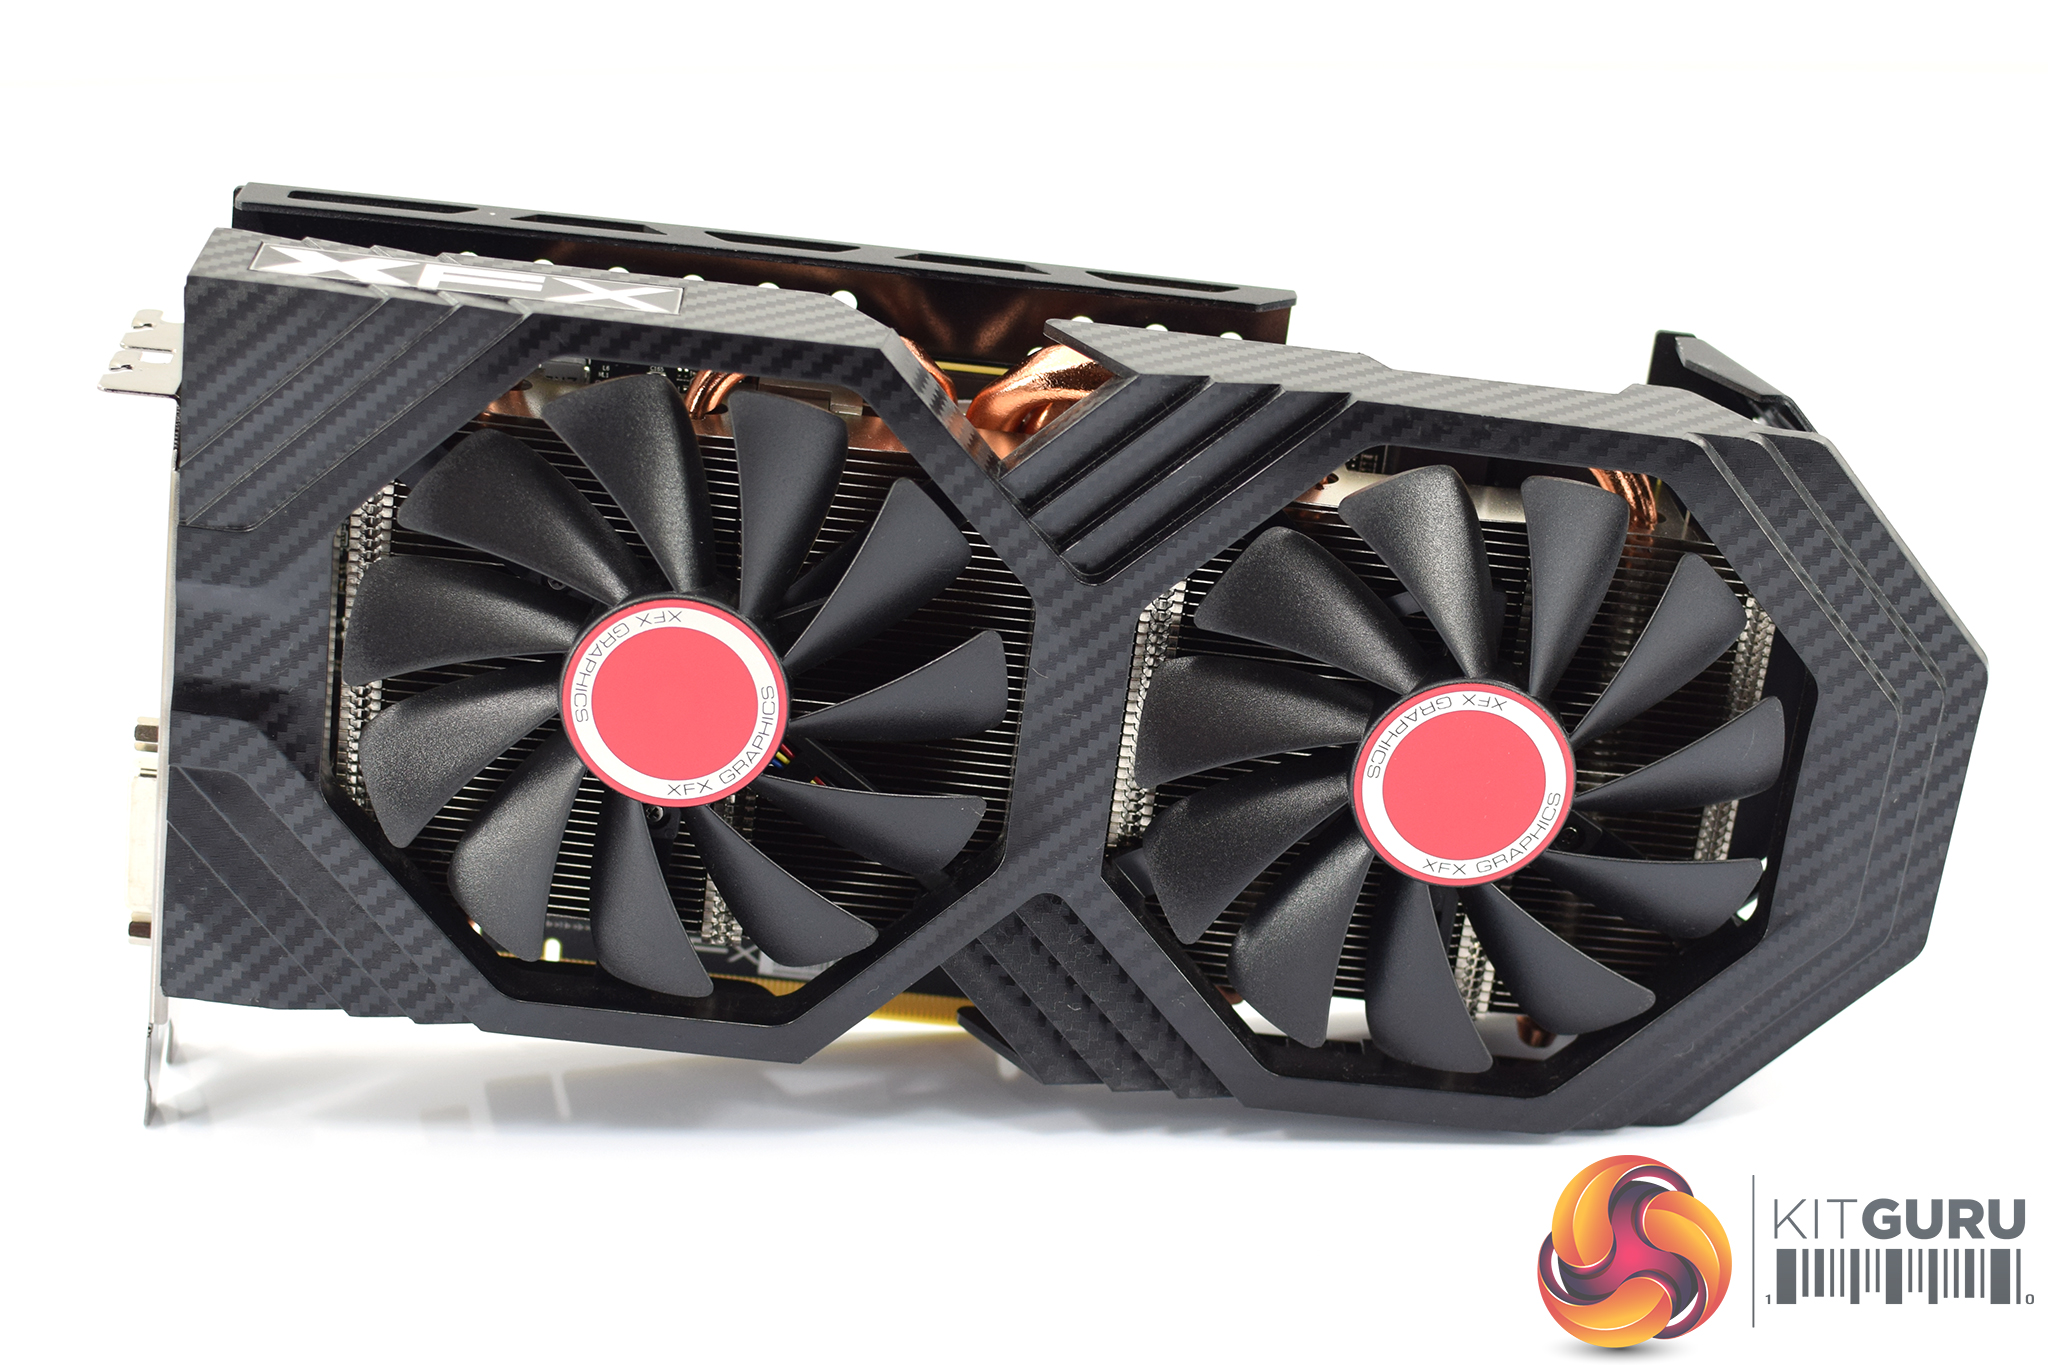
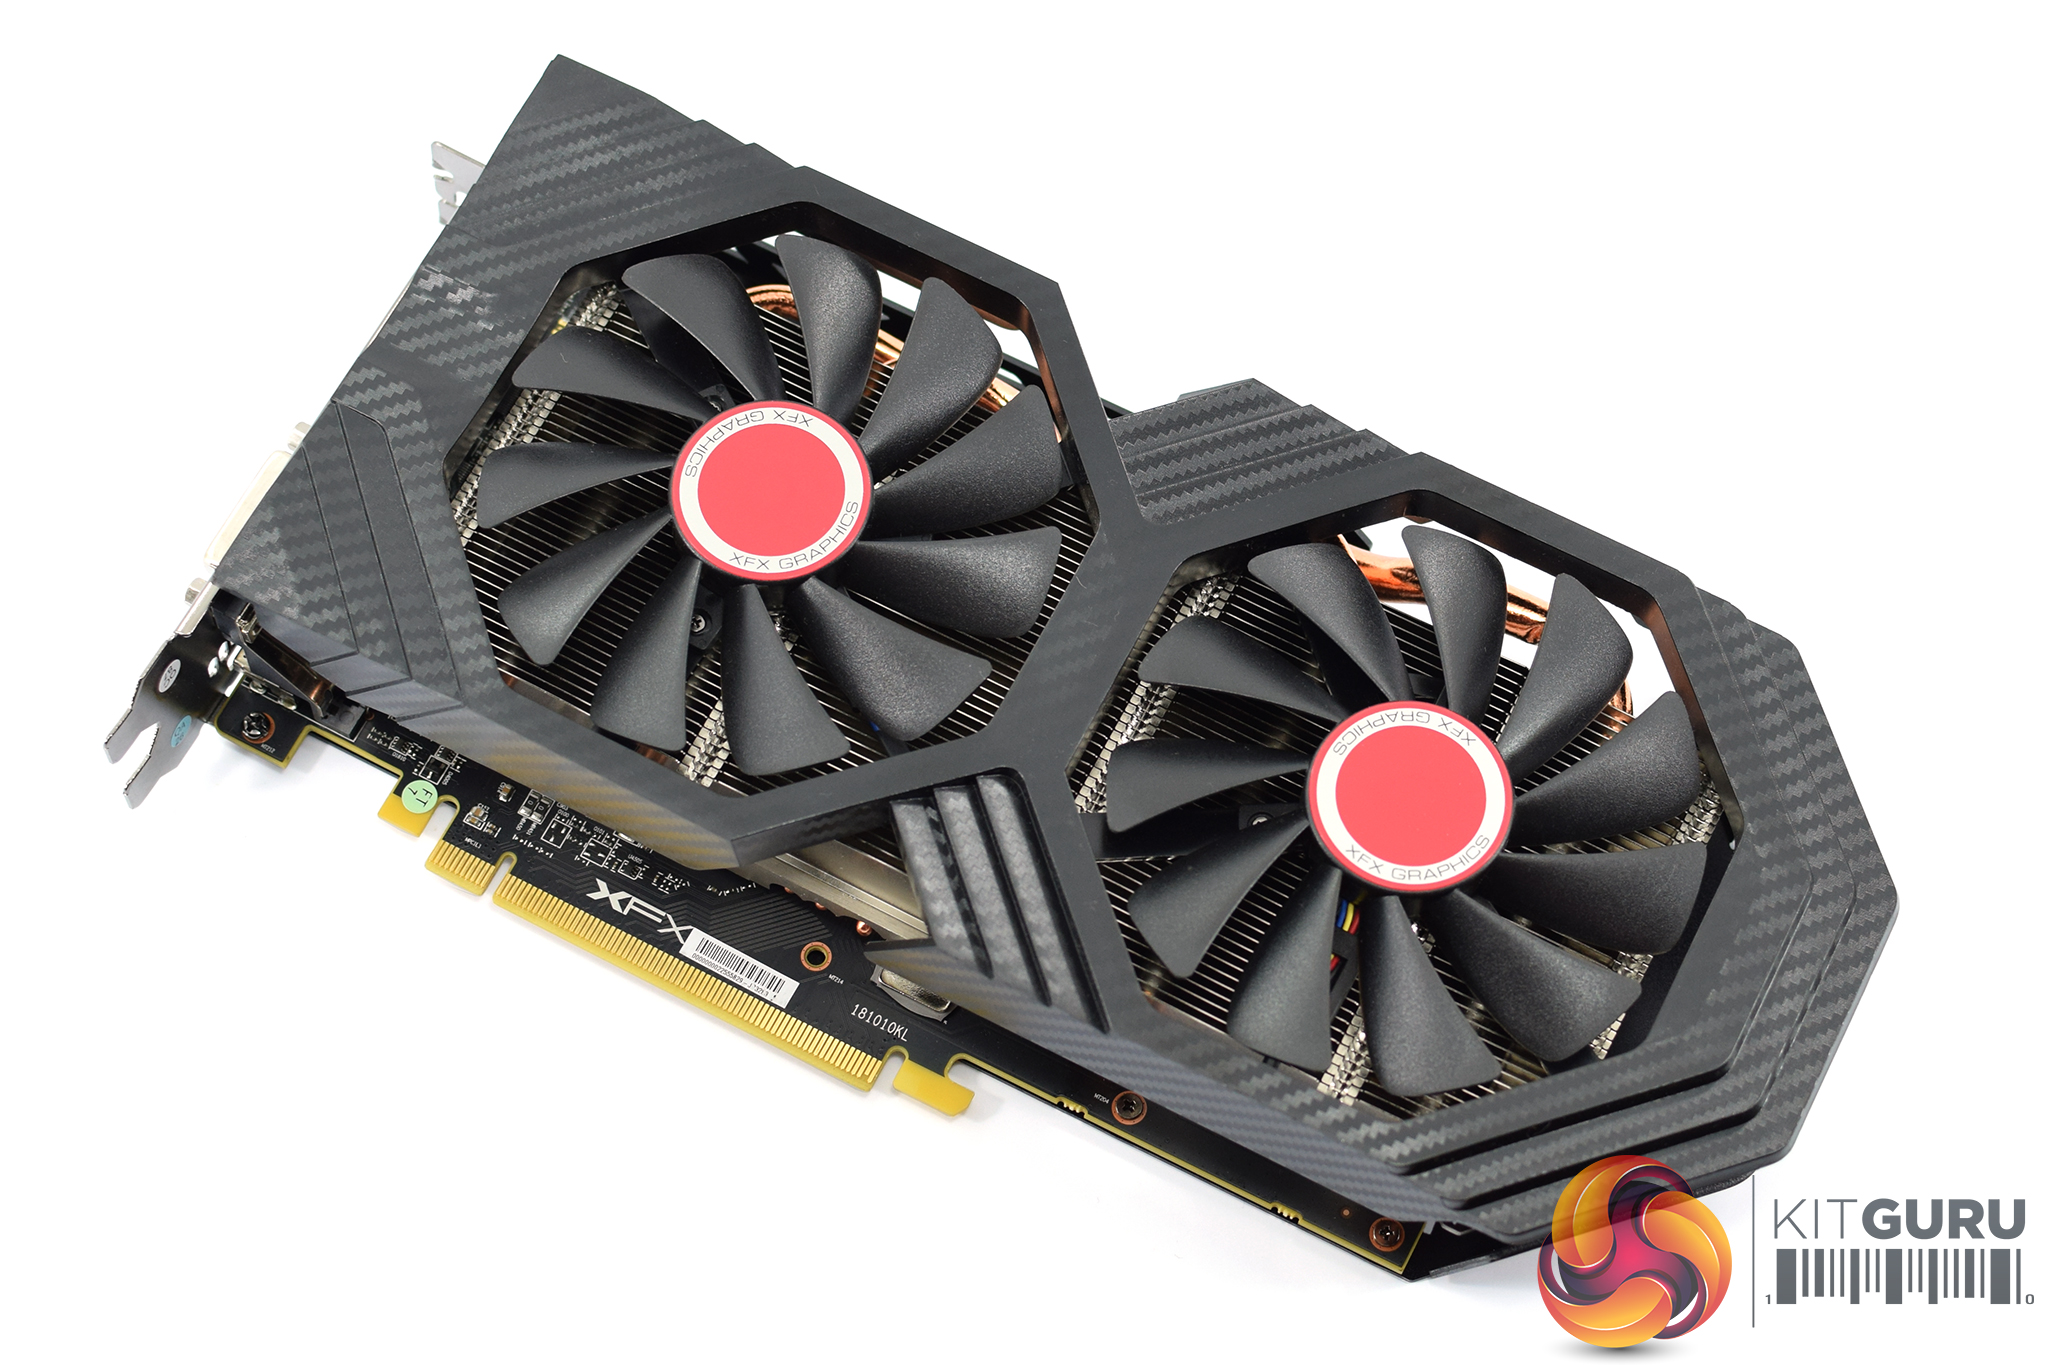
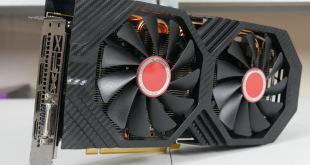
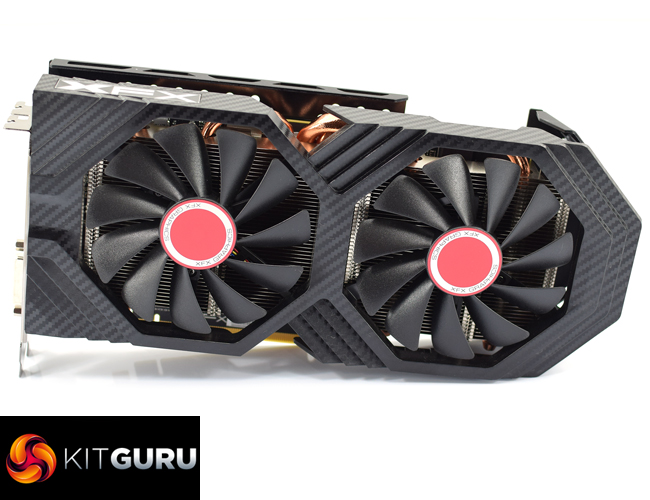
That just leaves the Fatboy itself, and I have to say it is a pretty basic looking card. It's essentially all made from black plastic, though the shroud is decorated with a carbon fibre look which isn't fooling anybody. The plastic also has some extras ridges to add visual interest, but overall I don't think it is much to look at.
Most of the front of the shroud is taken up by the two 100mm fans which have a red central hub. The blade design is fairly straight and does remind me of ASUS ROG's last generation of Strix coolers. As already mentioned, the fans also stop spinning when there is little or no load placed on the GPU.
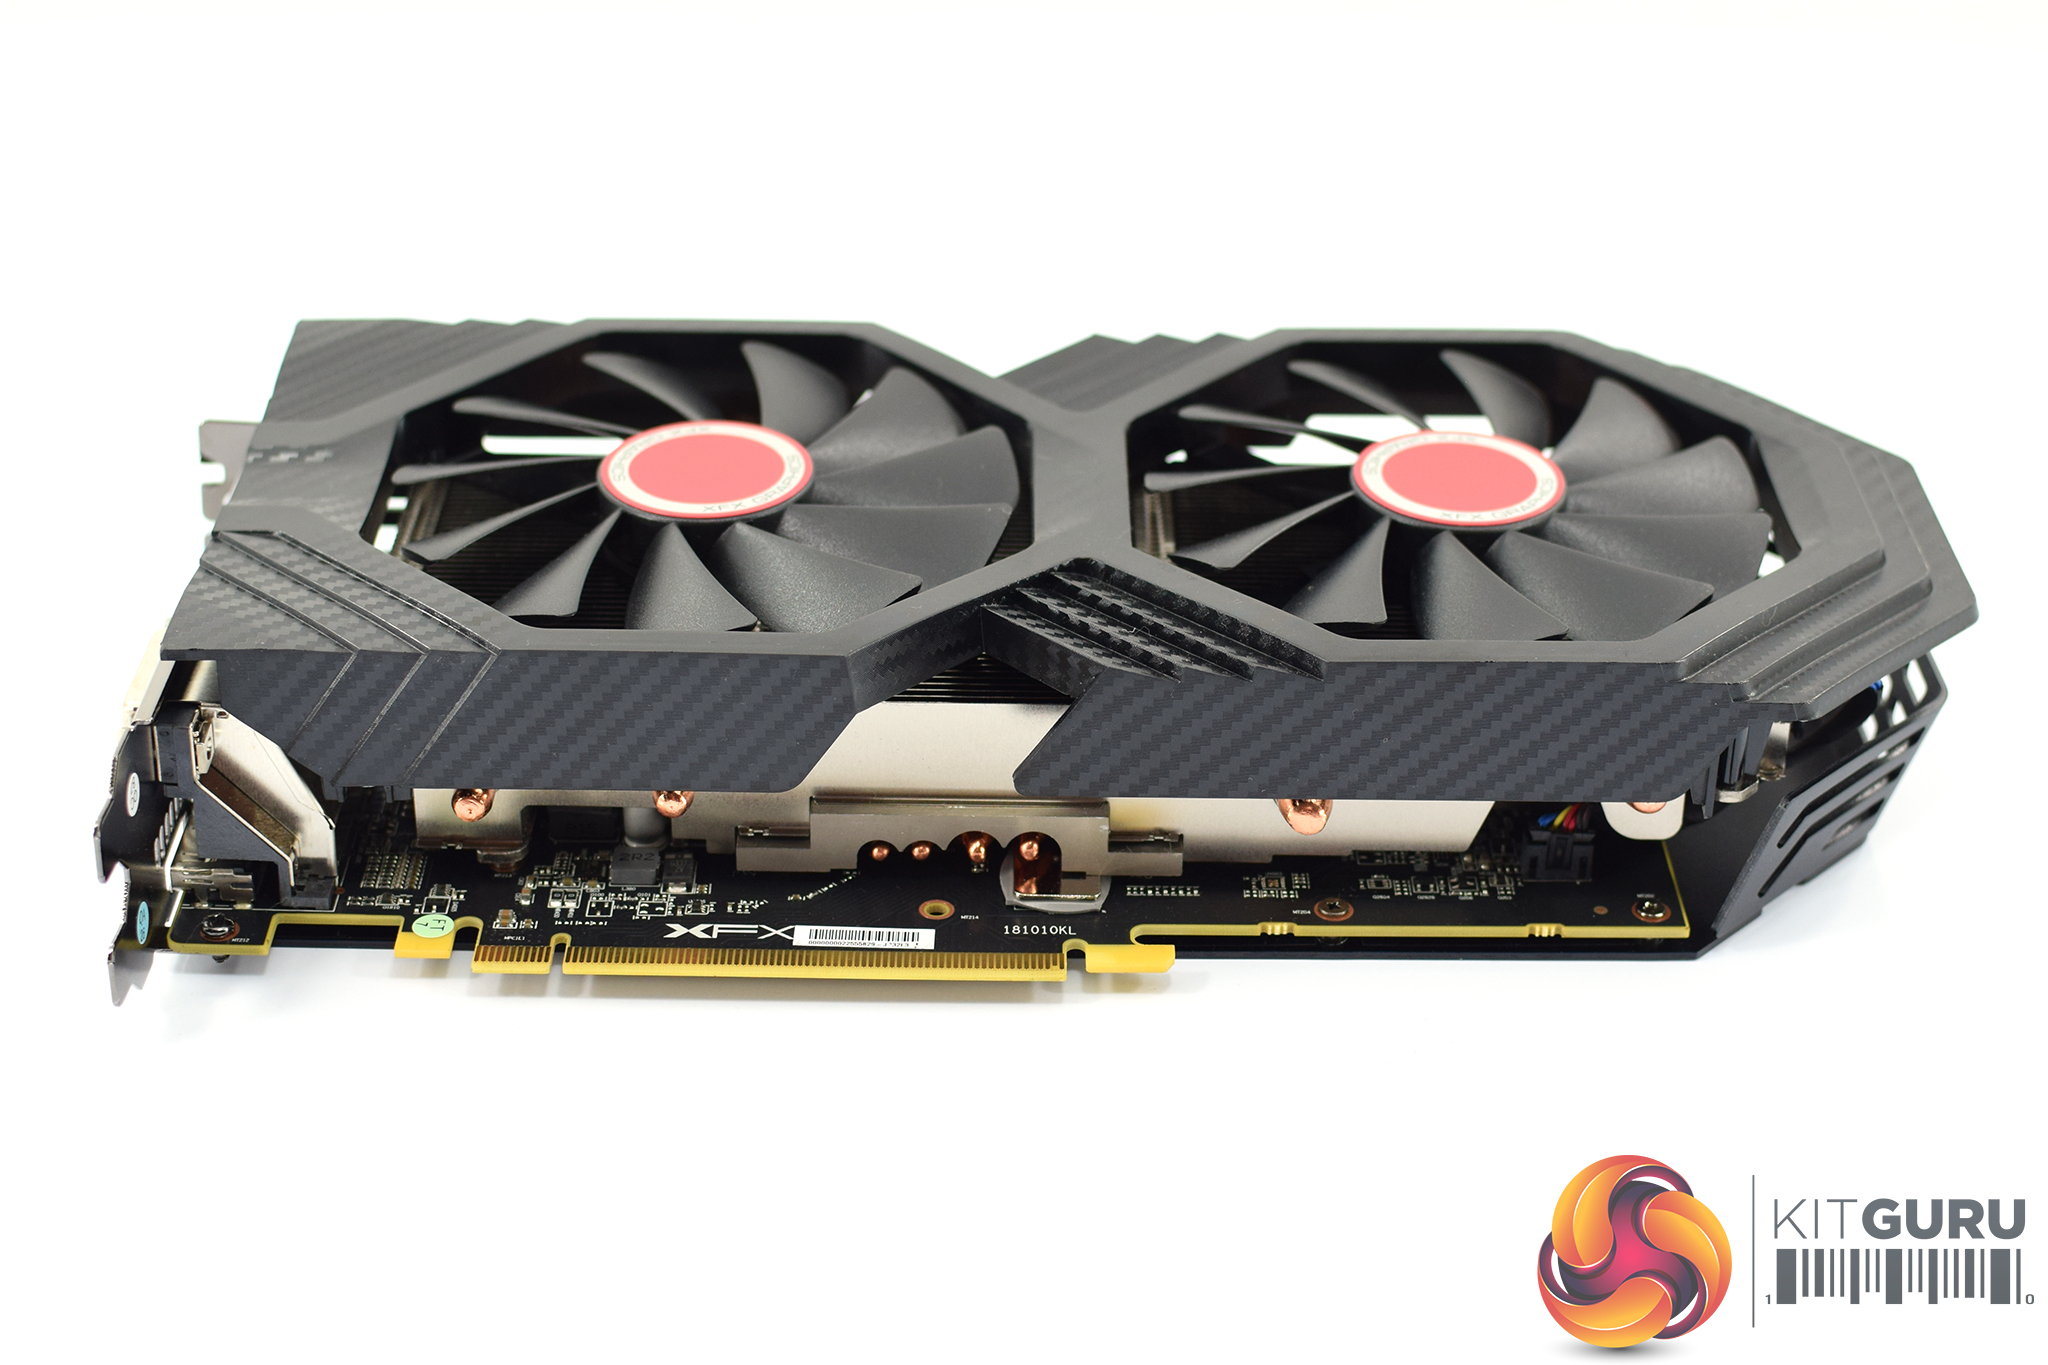
Getting a look at the card from both sides, I have to say it is really not that big. It measures 270 x 124 x 53mm, making it pretty average in terms of size. If this is what we are calling a ‘fatboy' now, I wonder what that makes the likes of the Palit RTX 2080 GameRock Premium, or the ASUS ROG Strix RTX 2080 Ti…
When we open up the card, too, we can also see that the actual PCB is a fair bit shorter than the shroud of the card. I measured the shroud to extend an extra 4.5cm from the end of the PCB, and hardly any of that space is even taken up by the heatsink, so it would seem XFX has decided to make the card longer for no real reason.
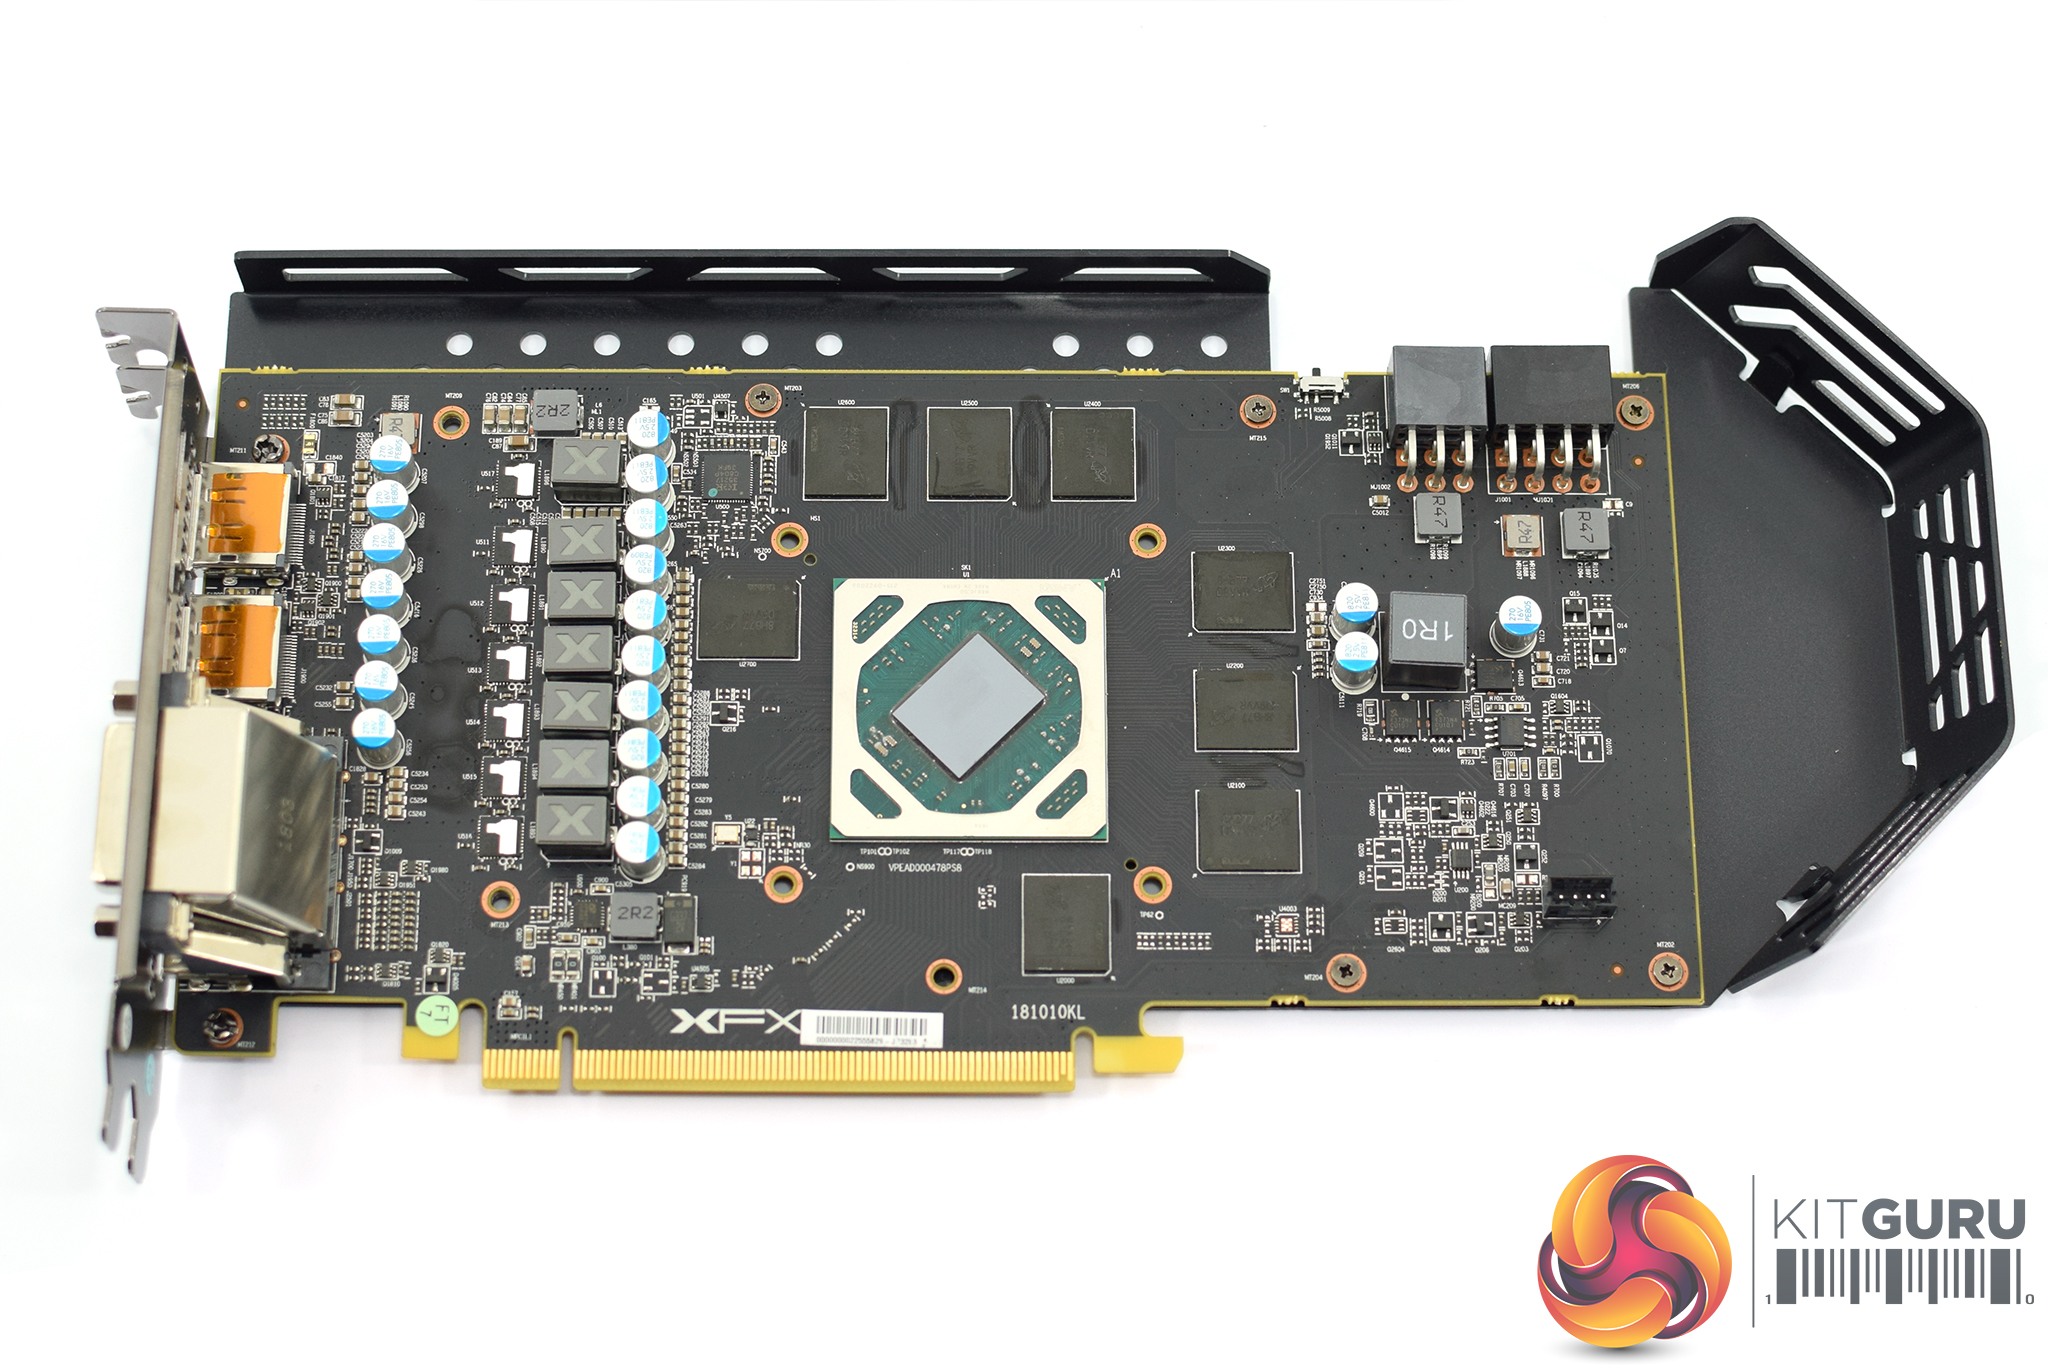
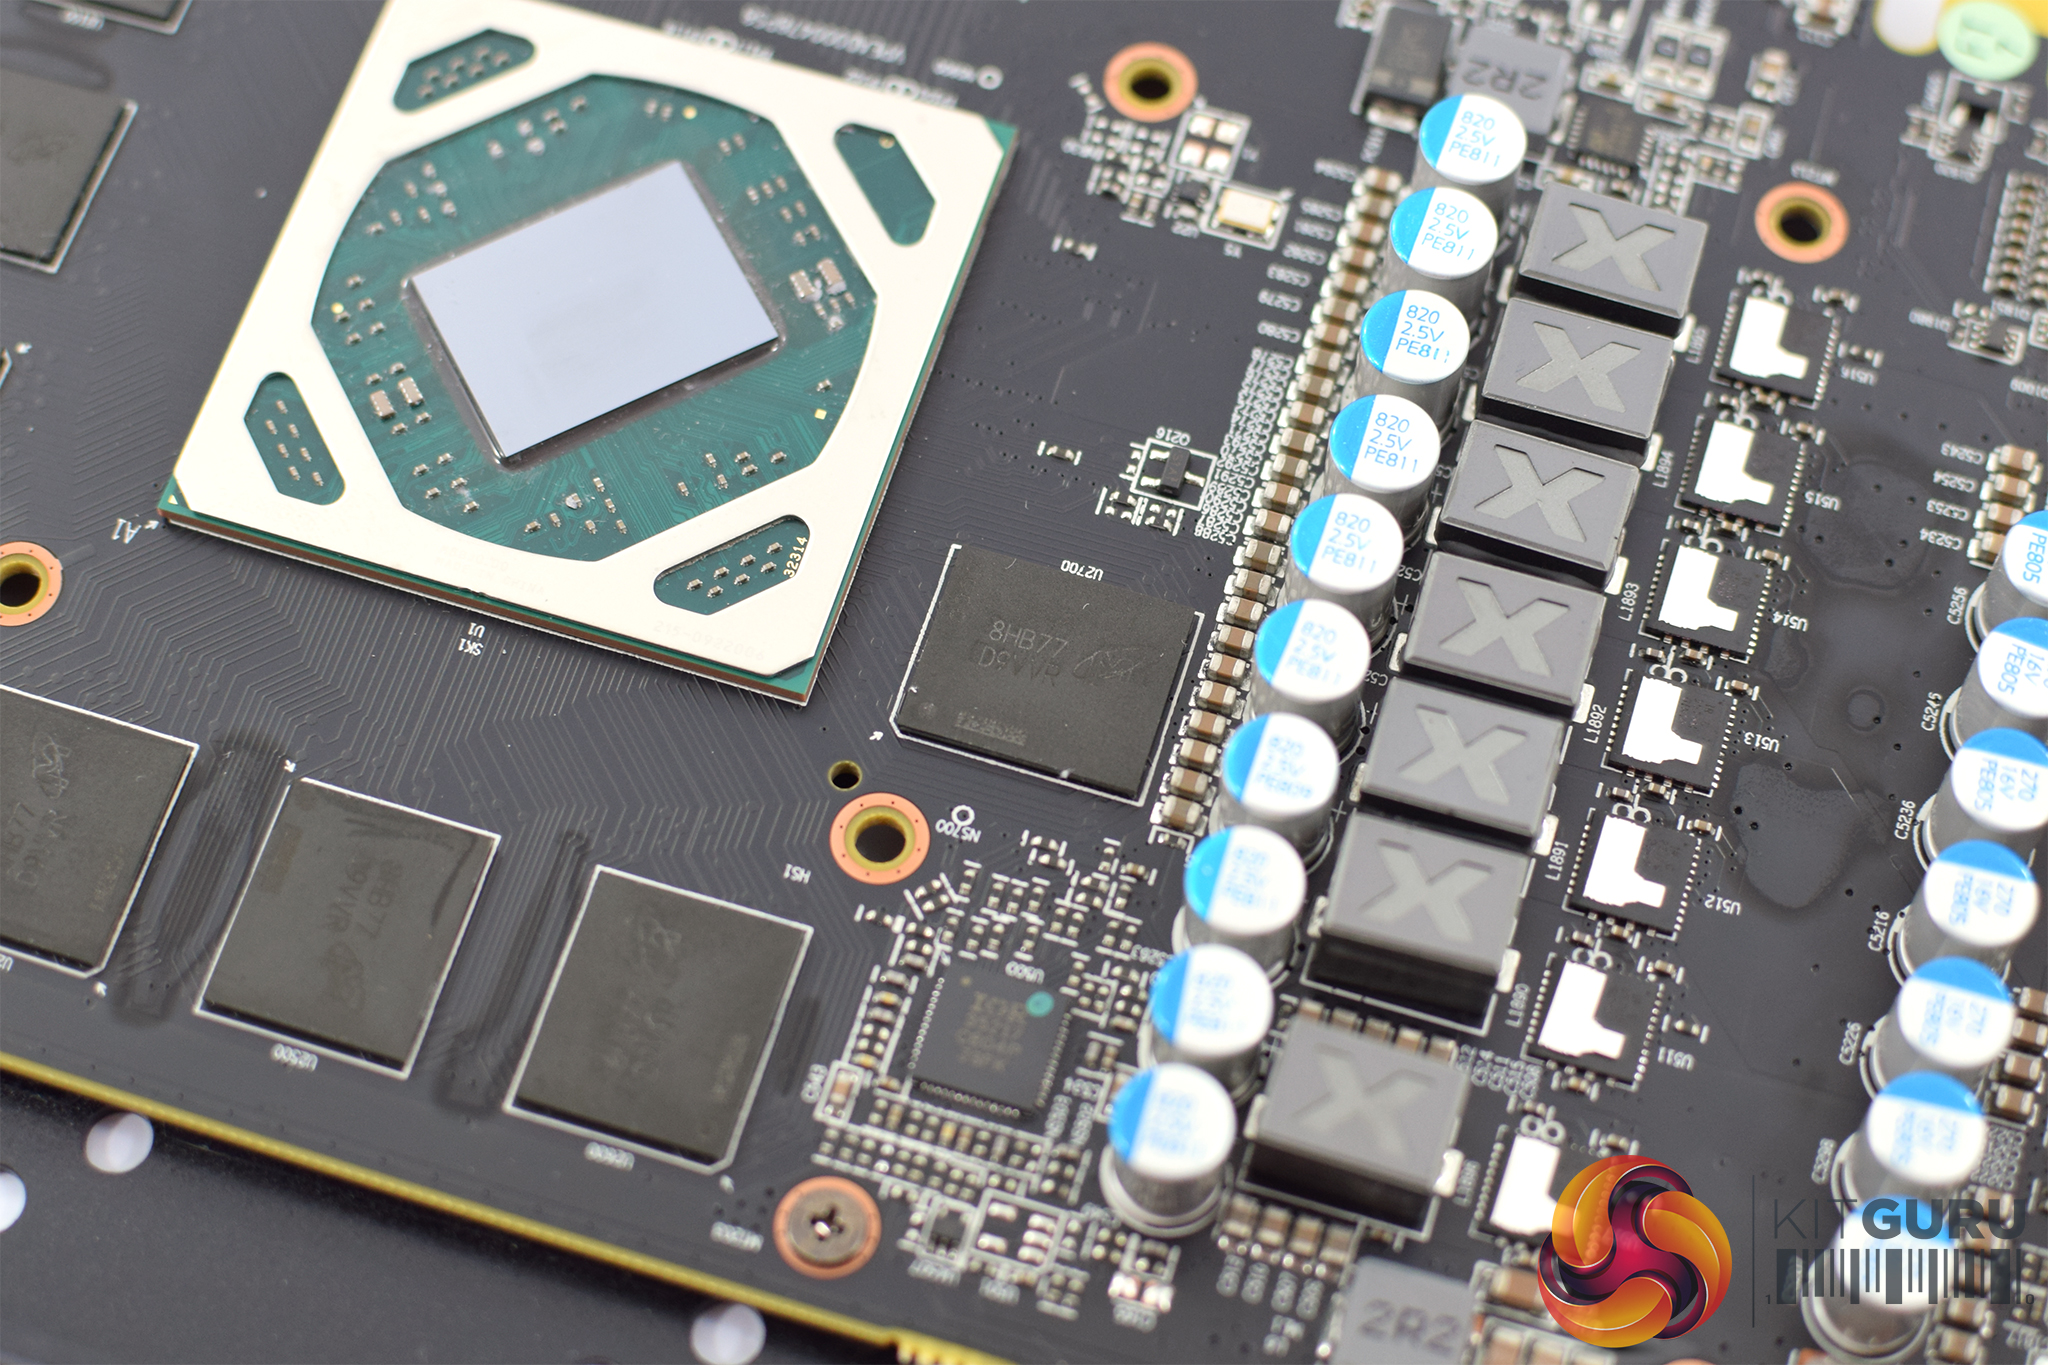
Still, looking at the PCB itself, we can see it uses 6+1 power phases set on the left-hand side of the board – the Sapphire RX 590 also went with a 6+1 phase design. The 8GB of GDDR5 memory comes from Micron, and each chip is labelled ‘8HB77D9VVR'. The GPU die itself is left unmarked.
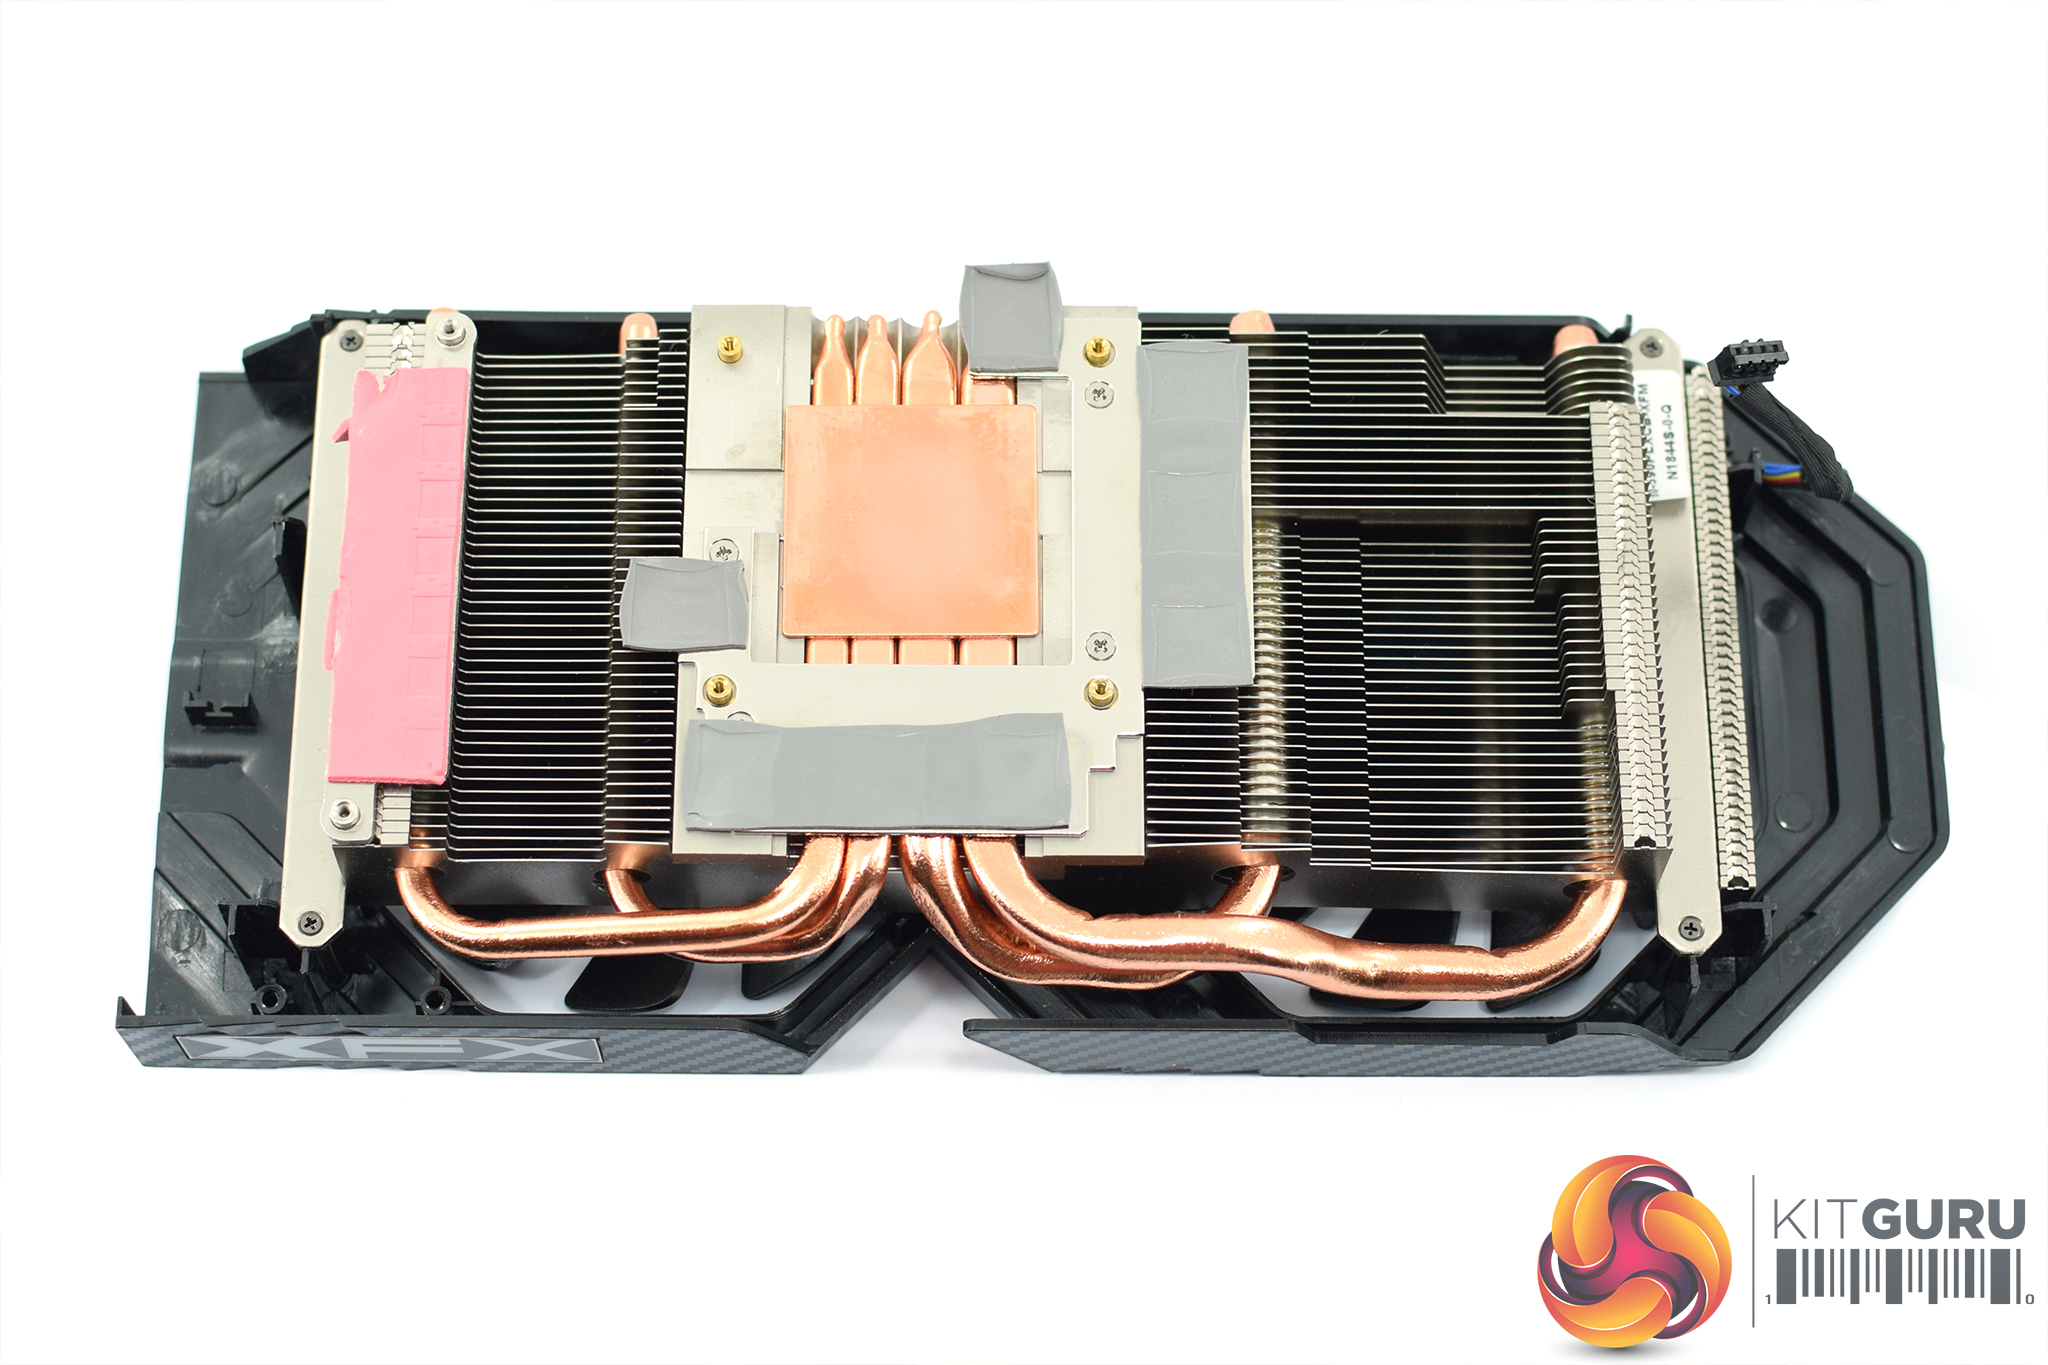
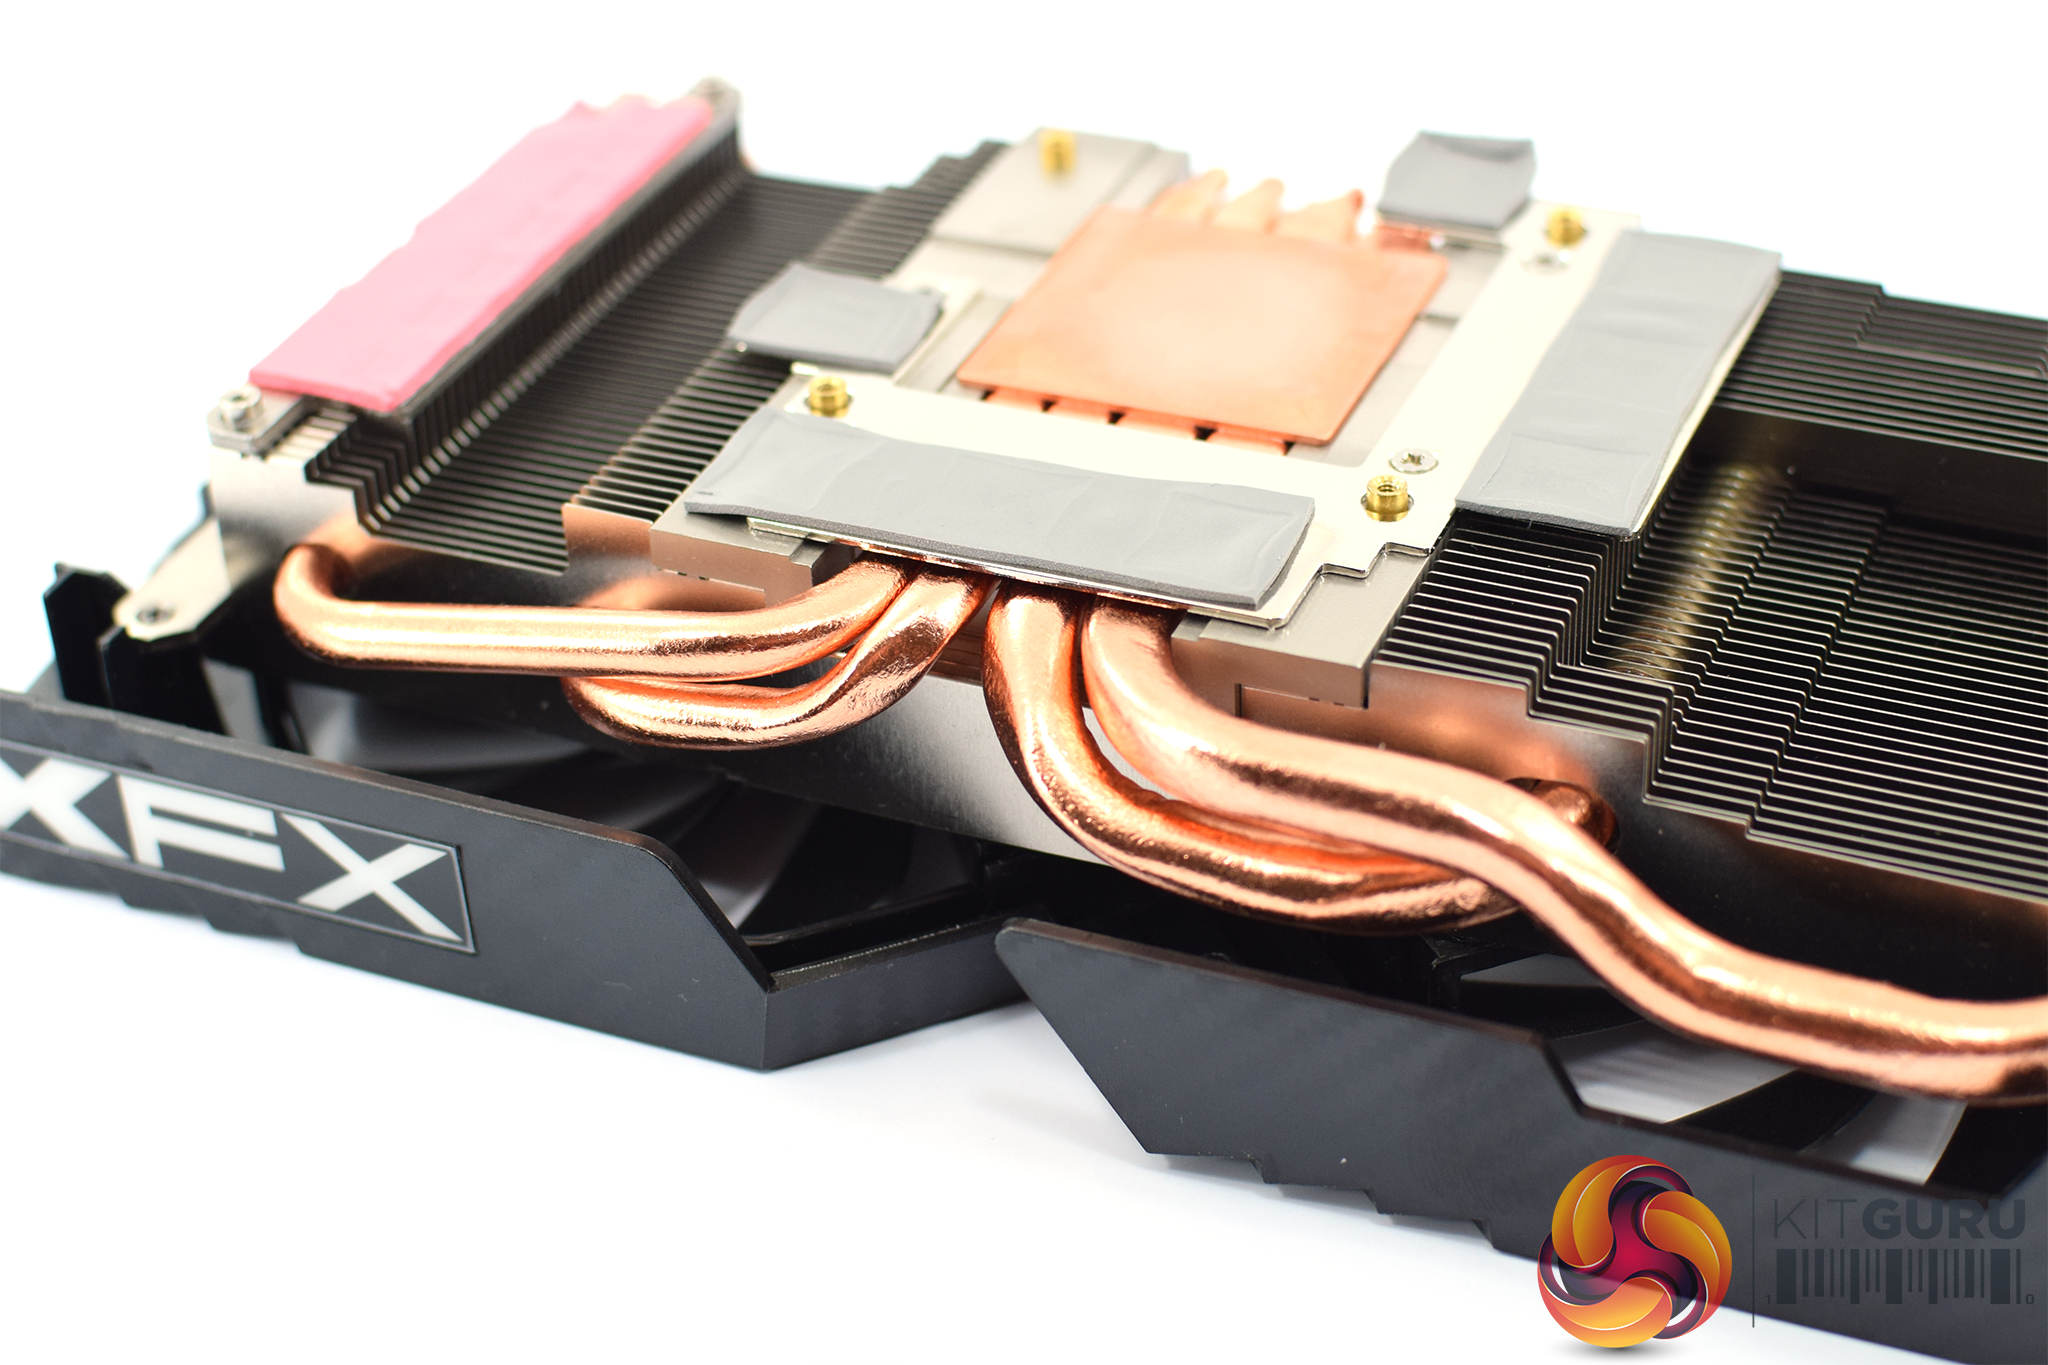
In terms of the heatsink, again I have to say it looks pretty basic and doesn't really live up to the Fatboy name – though the proof is in the pudding as they say, and we look at thermals later in the review.
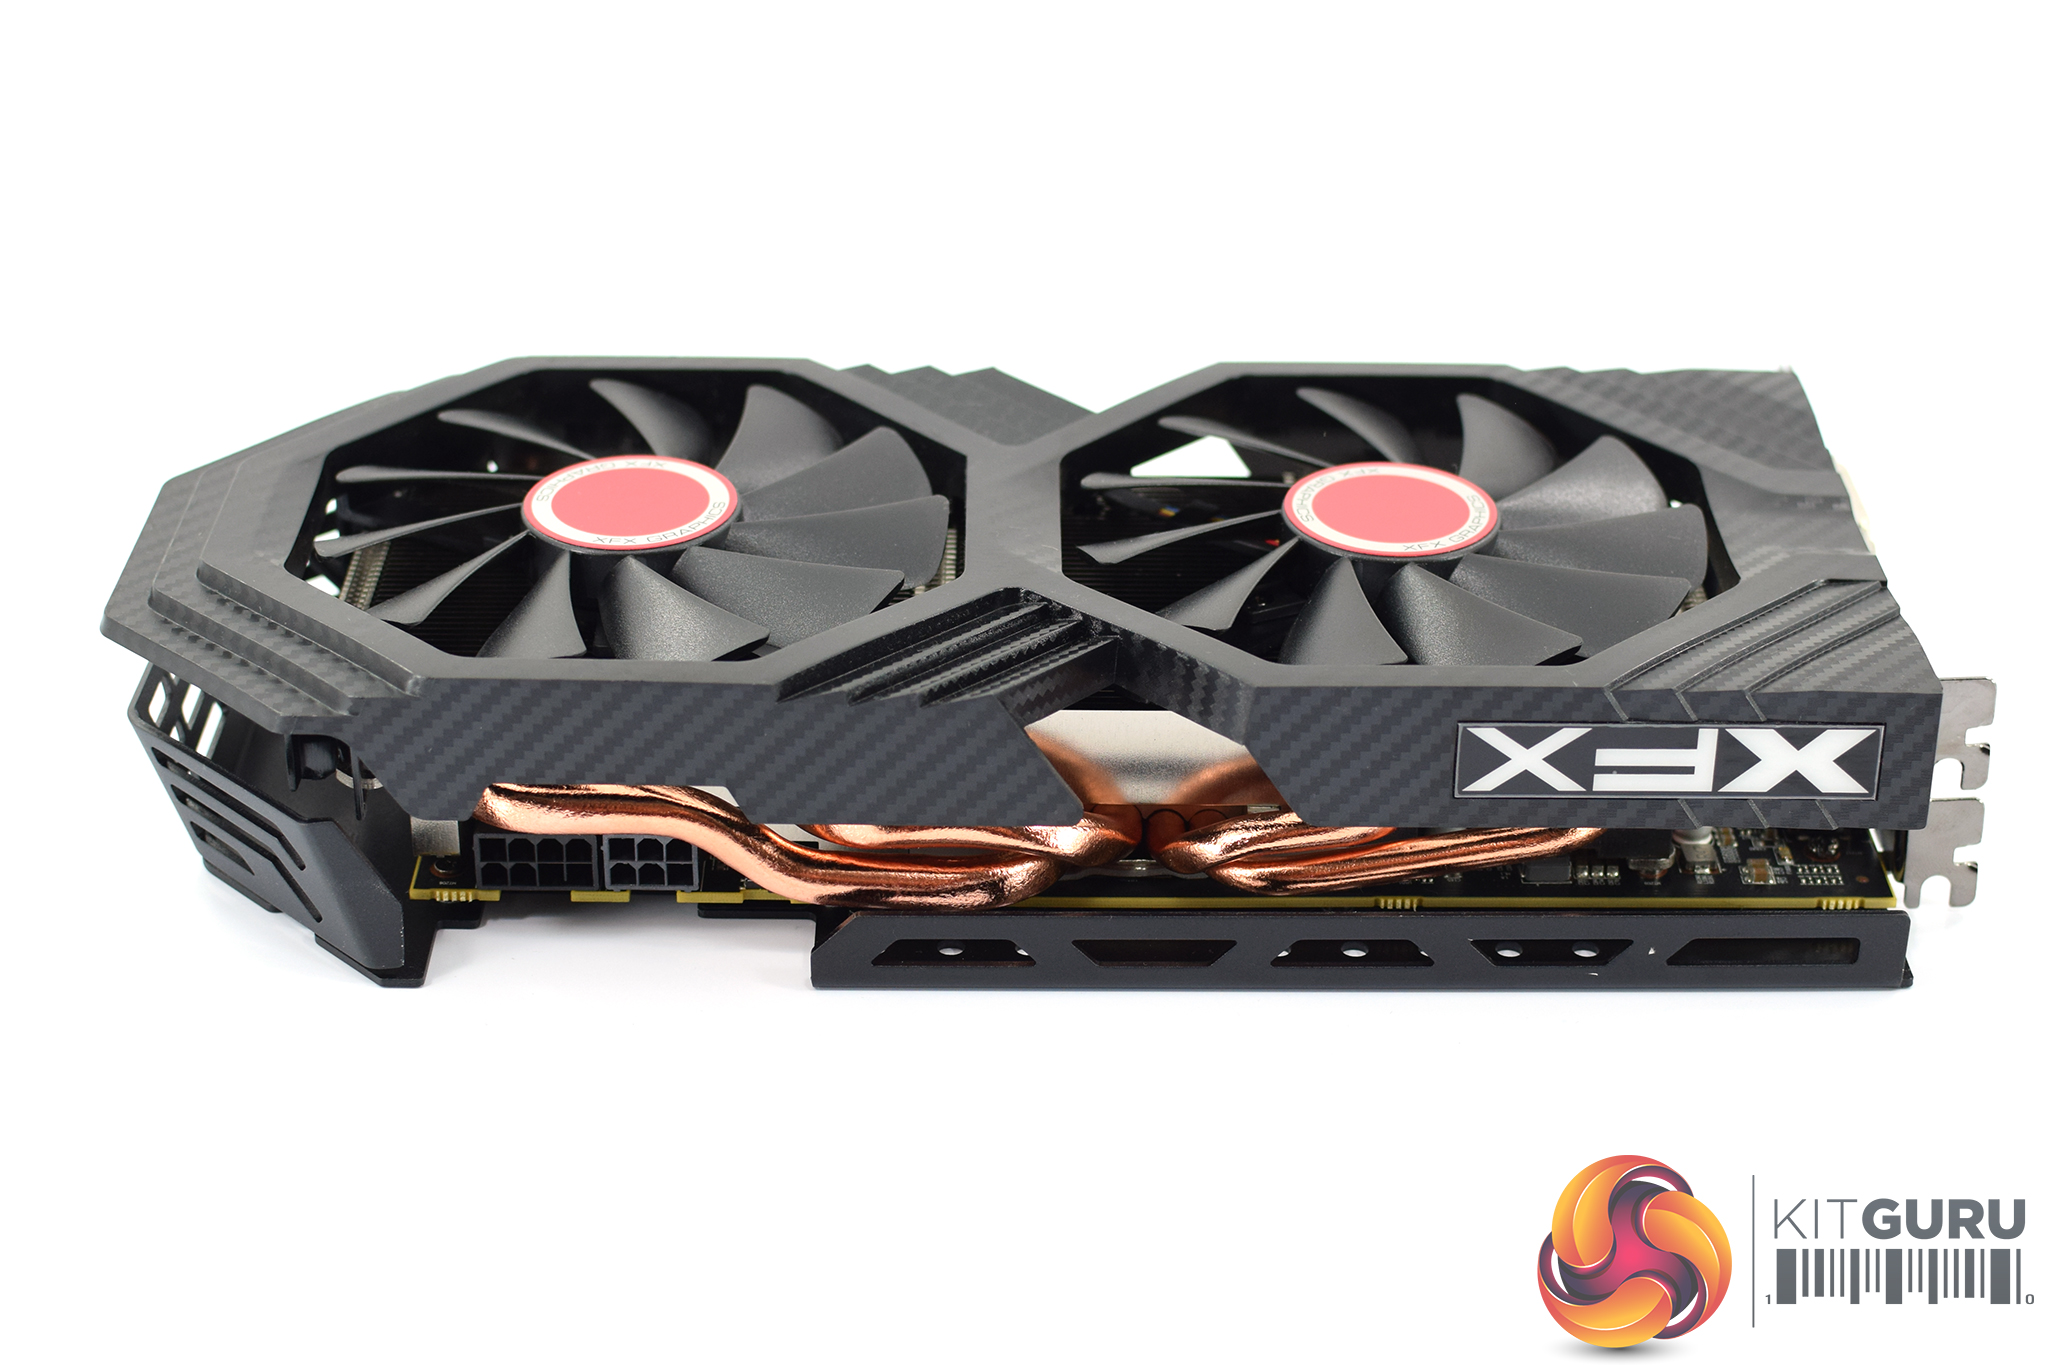
Still, what we can see here is a four heatpipe configuration, with what looks to be 2x 8mm and 2x 6mm pipes used. These feed out from a copper coldplate which contacts with the GPU die, while there is also a separate plate for the VRAM chips, and another smaller plate at the far end for the inductors.
Moving back round to the front side of the card, we can see the XFX logo is stuck onto the bottom of the shroud via a sticker which could be easily removed if you didn't want it there.
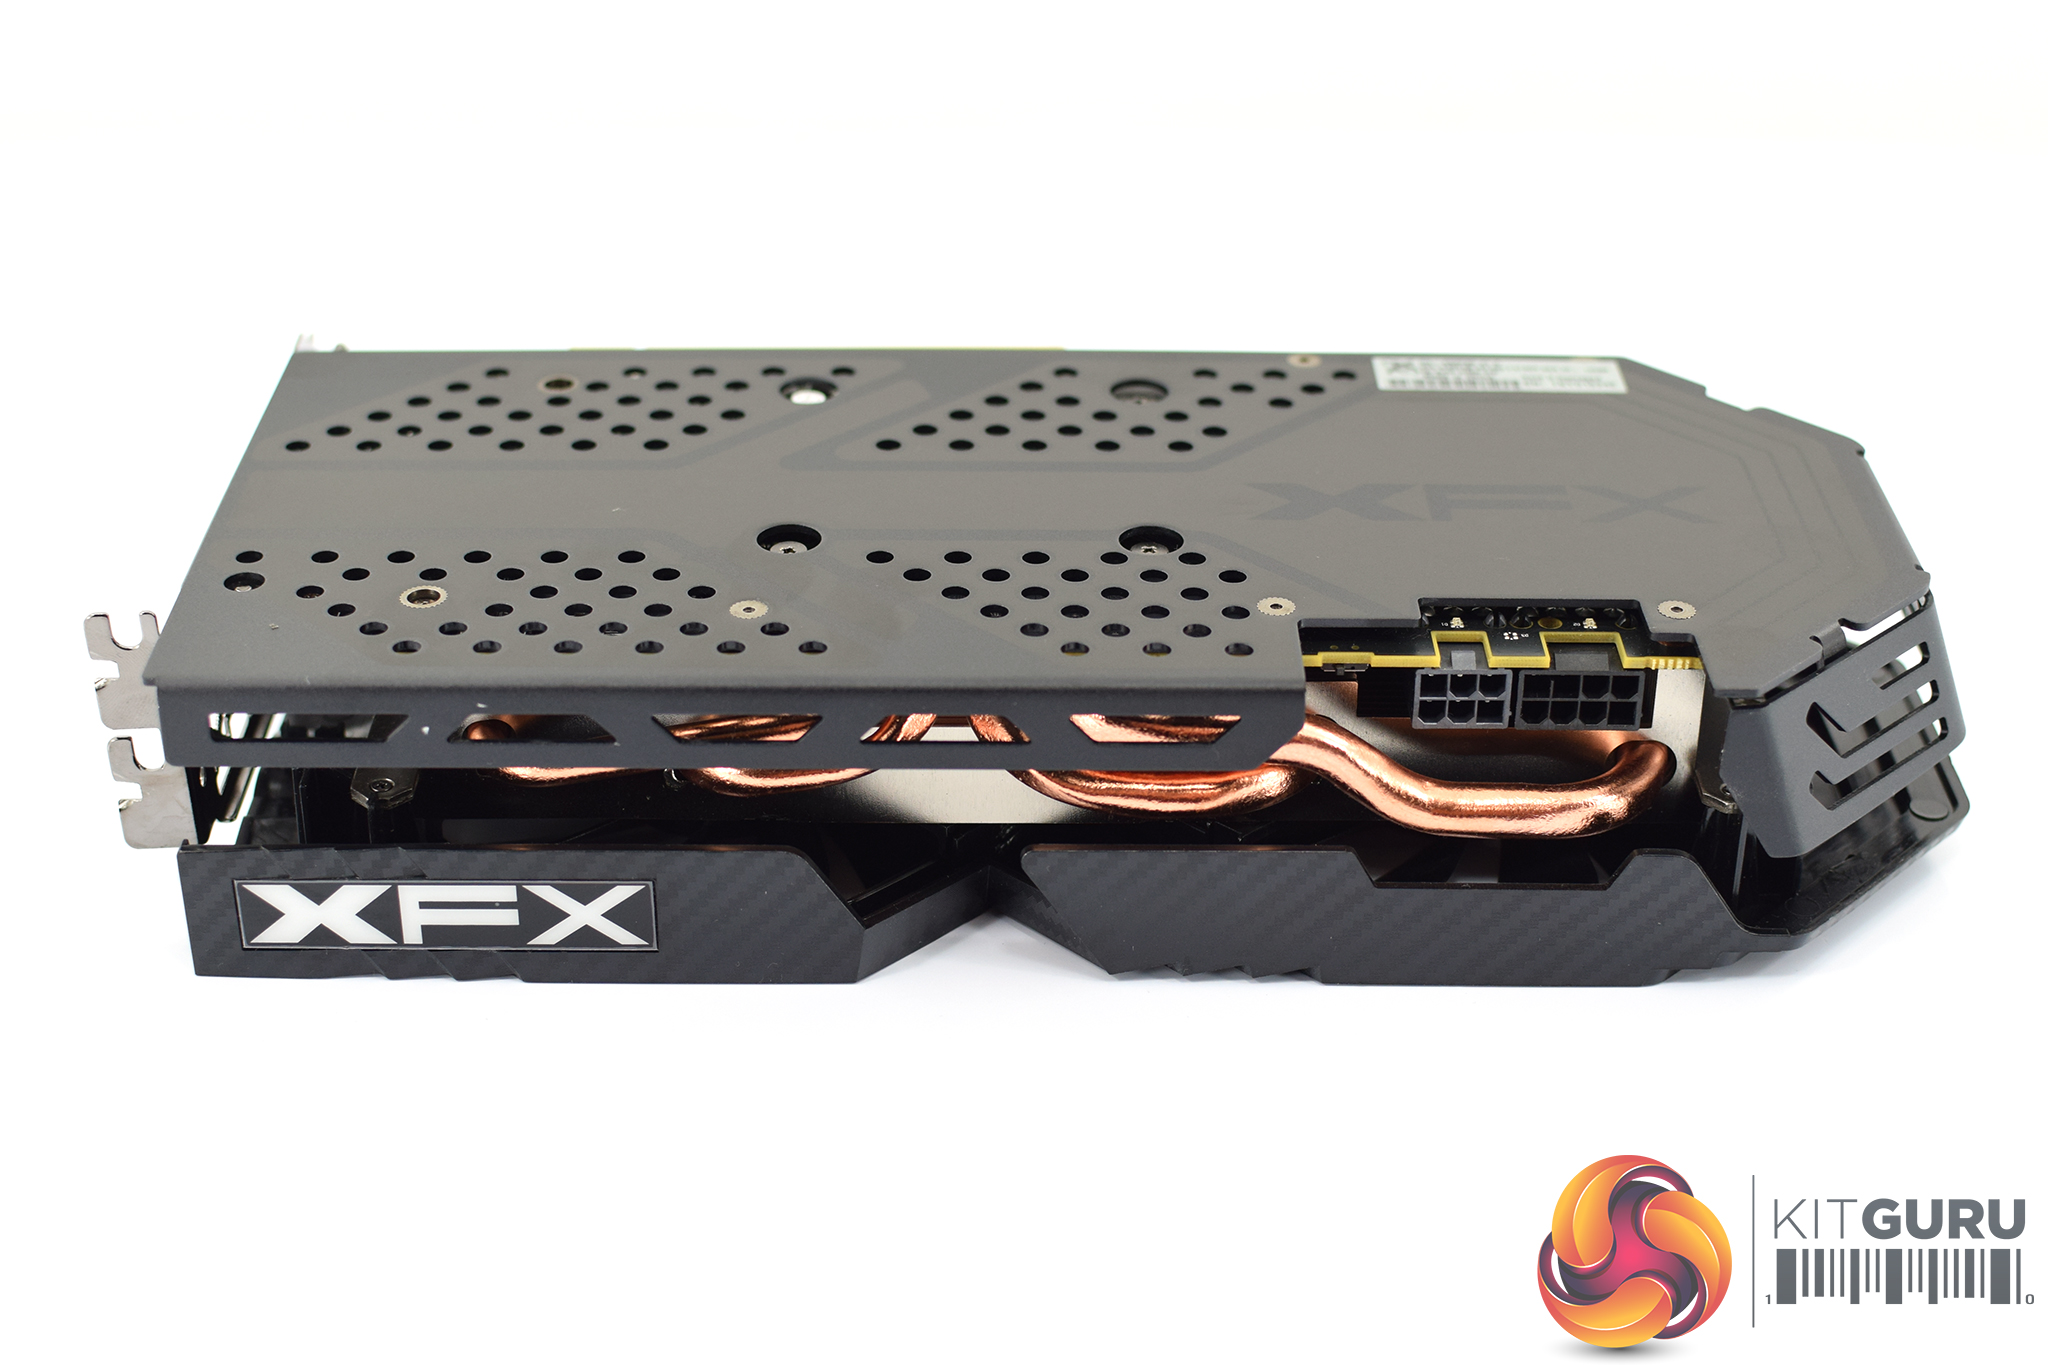
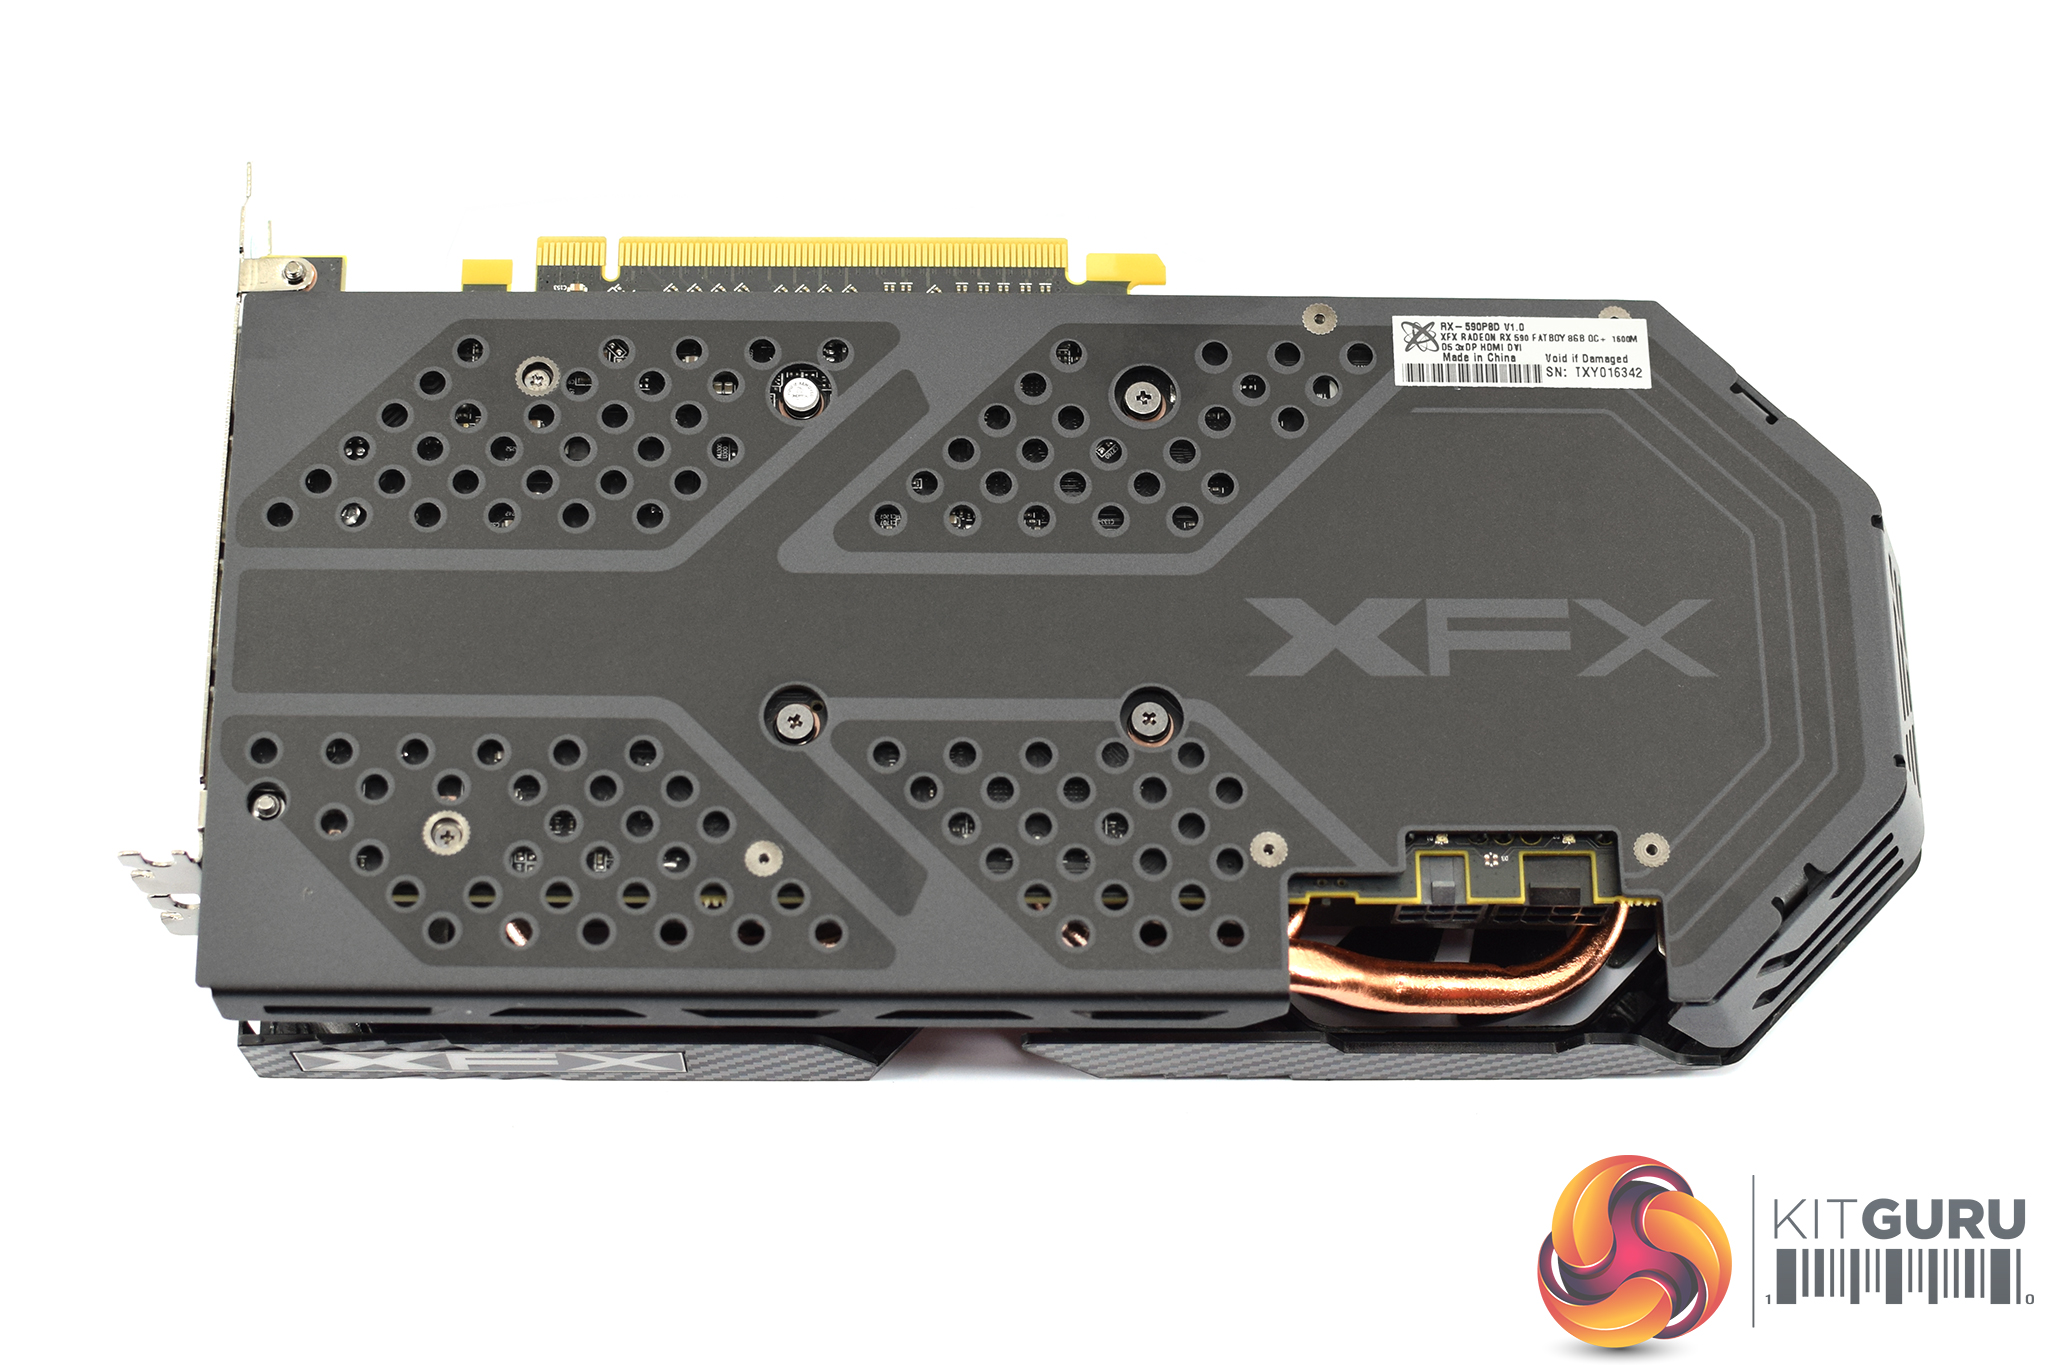
In terms of the backplate, this is made of aluminium and it sports a two-tone design, with some black and dark grey sections, while the XFX logo is present at the end of the card. Overall, though, it is relatively easy on the eye and won't cause any issues in a colour coordinated build.
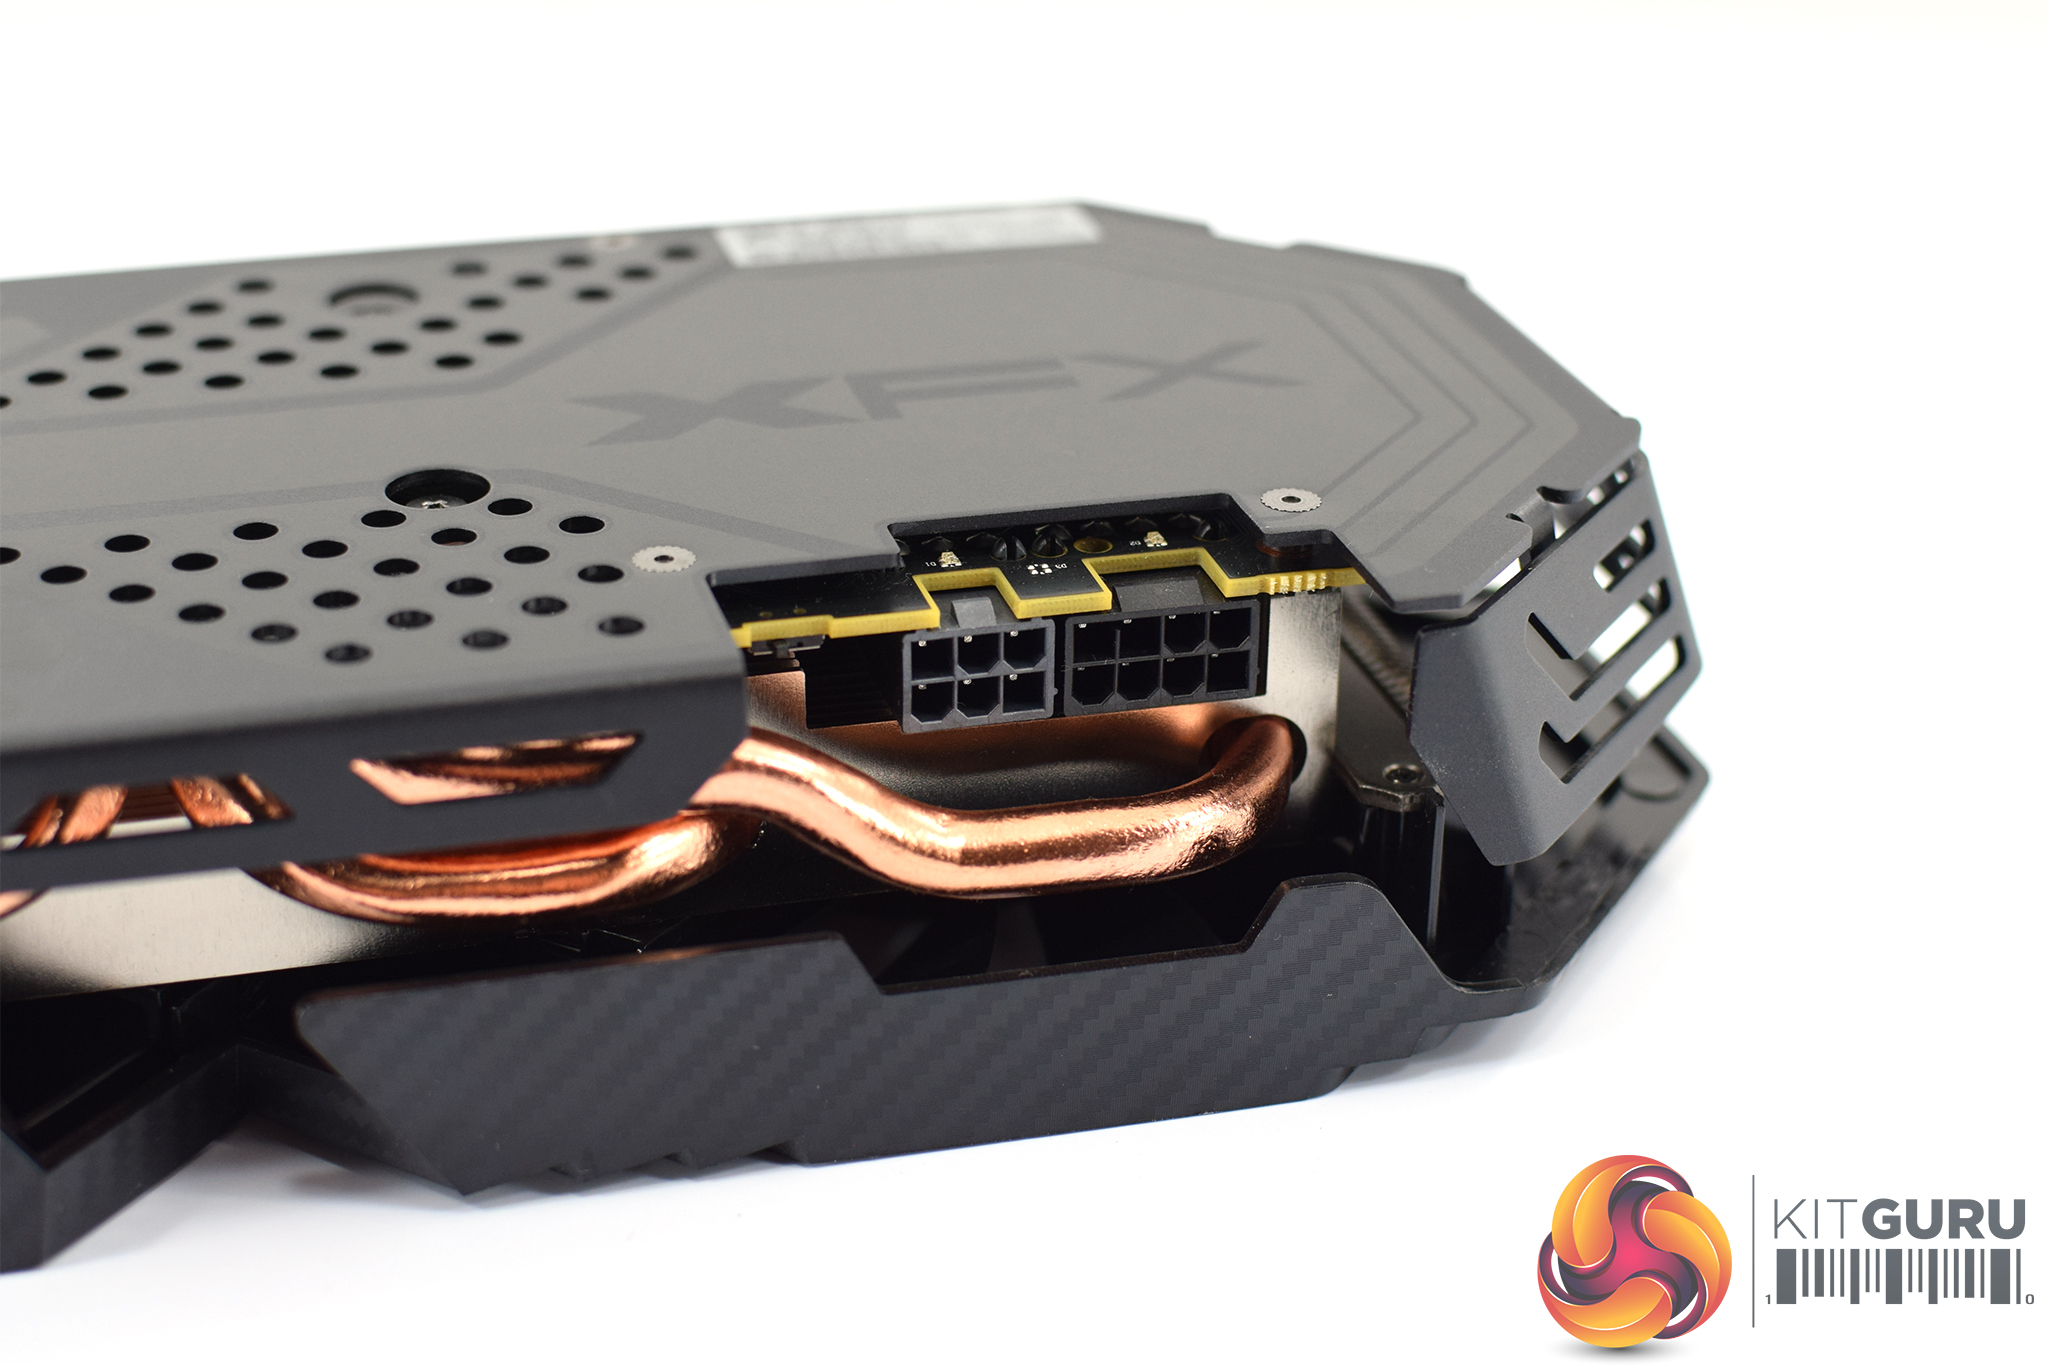
Also on the front side of the card we see the 1x 6-pin and 1x 8-pin PCIe power connectors. Just to the left of those, too, is a small BIOS switch which enables users to choose between the ‘performance' or ‘stealth' BIOS, each of which maintains clock speed at 1580MHz but adjusts the fan curve. This is something we test later in the review.
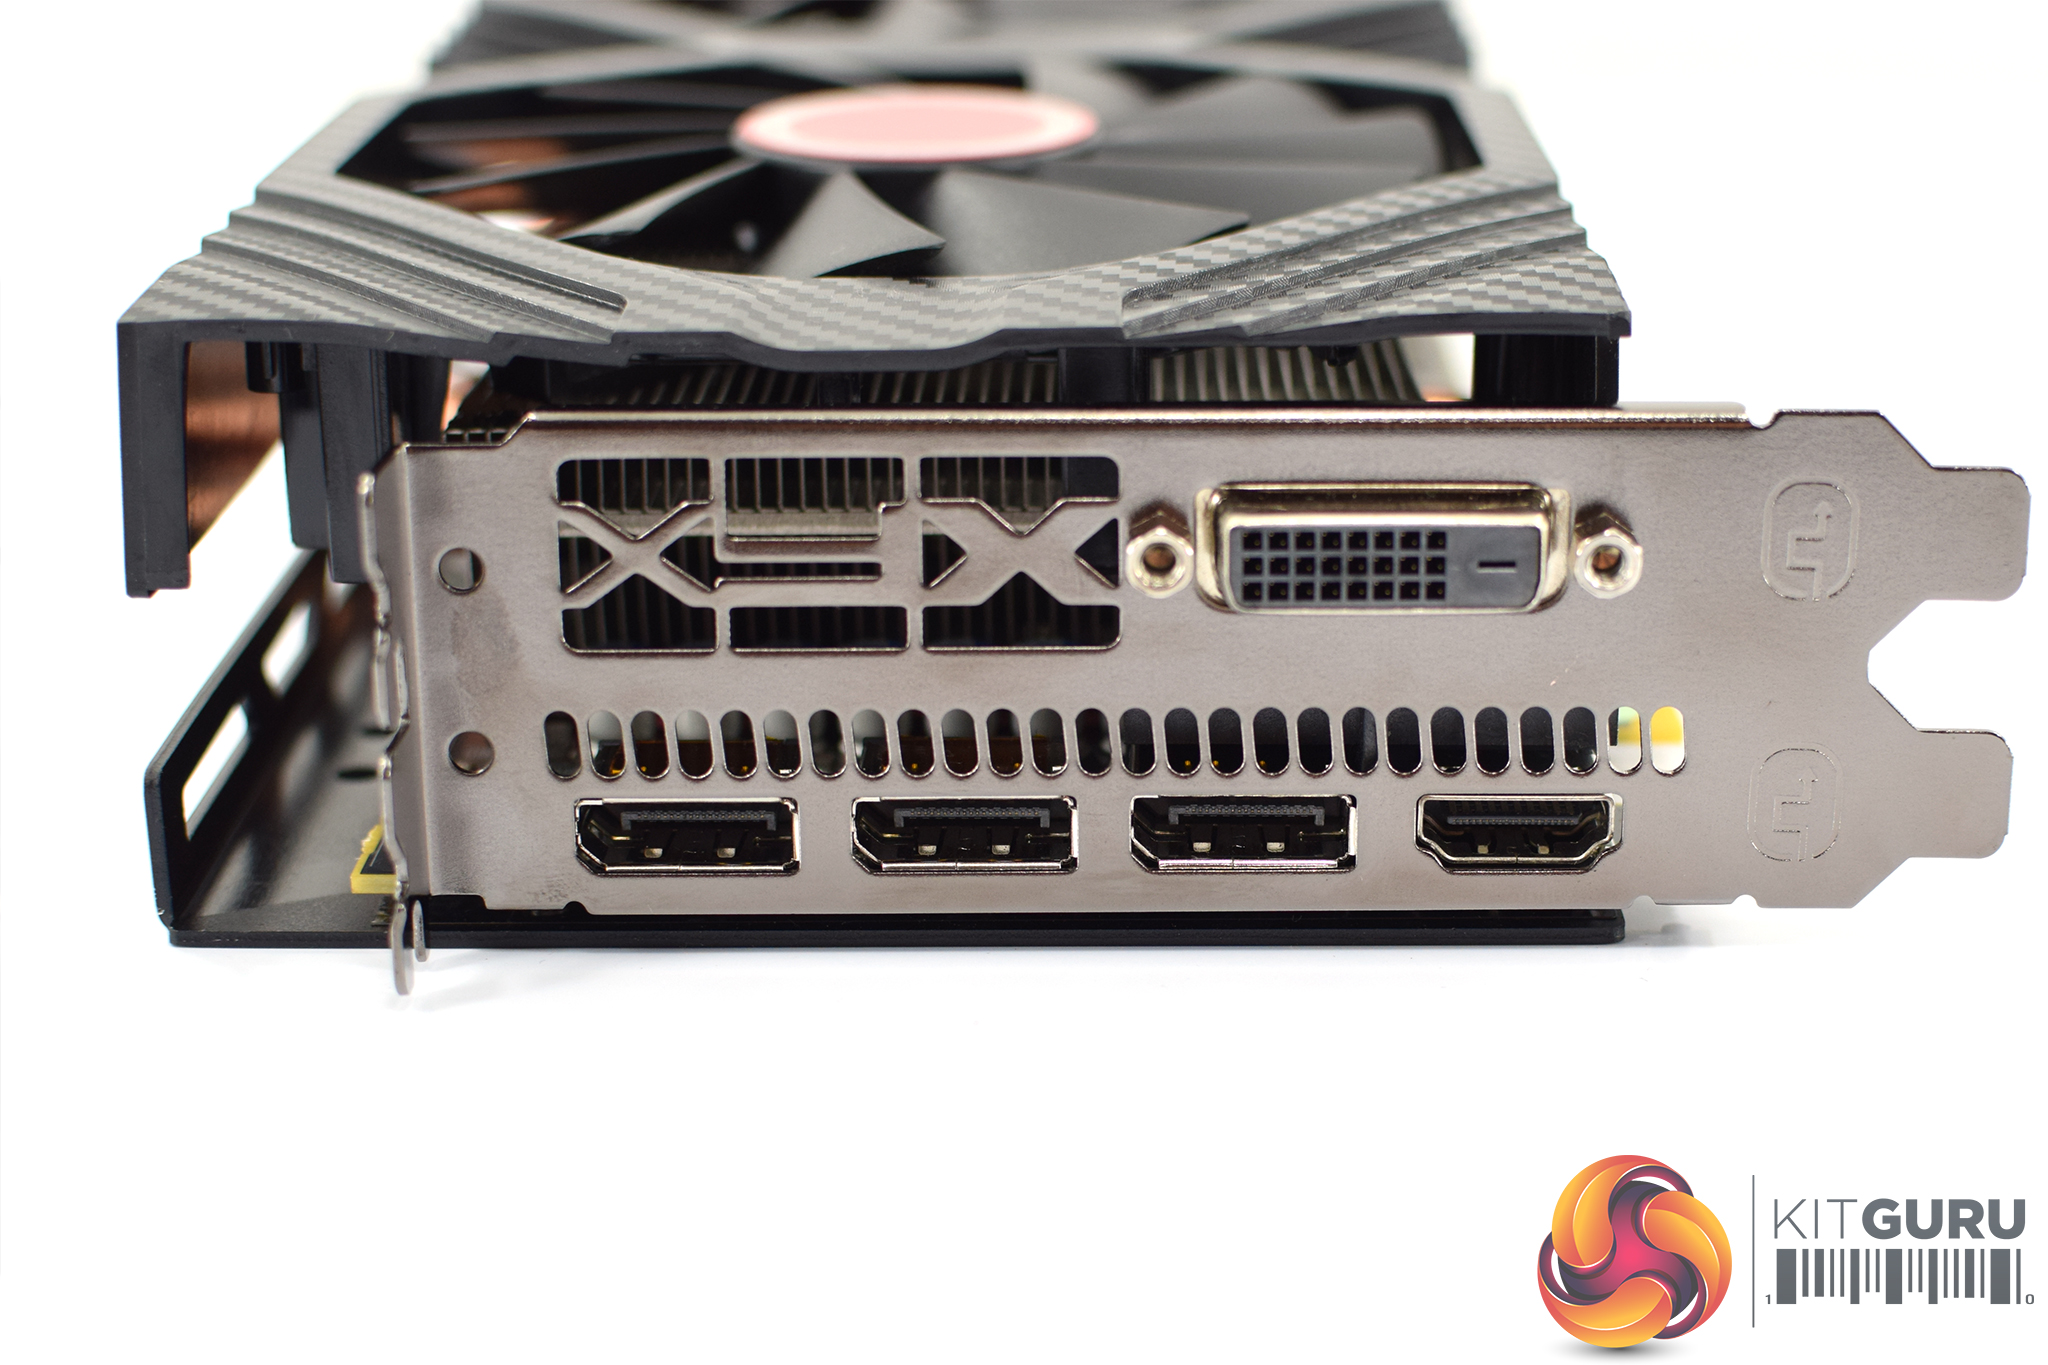
Lastly, display outputs consist of 3x DisplayPort 1.4, 1x HDMI 2.0b and 1x DVI.Our newest GPU test procedure has been built with the intention of benchmarking high-end graphics cards. We test at 1920×1080 (1080p), 2560×1440 (1440p), and 3840×2160 (4K UHD) resolutions.
We try to test using the DX12 API if titles offer support. This gives us an interpretation into the graphics card performance hierarchy in the present time and the near future, when DX12 becomes more prevalent. After all, graphics cards of this expense may stay in a gamer’s system for a number of product generations/years before being upgraded.
We tested the RX Vega64 and Vega56 using the ‘Turbo‘ power mode in AMD’s WattMan software. This prioritises all-out performance over power efficiency, noise output, and lower thermals.
As mentioned, the Fatboy ships with a 1580MHz boost clock. We did all of our 3DMark/games testing using the Performance BIOS, but tested both BIOS options for temperatures, noise levels, power draw and average clock speed.
Driver Notes
- All AMD graphics cards were benchmarked with the Adrenalin 18.11.1 driver.
- Nvidia graphics cards (apart from RTX 20 series cards) were benchmarked with the Nvidia 399.24 driver.
- RTX 2080 and 2080 Ti cards were benchmarked with the Nvidia 411.63 driver.
- RTX 2070 cards were benchmarked with the Nvidia 416.33 driver.
Test System
We test using the Overclockers UK Germanium pre-built system. You can read more about it over HERE. It is important to note we have had to re-house the components to an open-air test bench to accommodate our new GPU power testing (more on that later) but the core of the system is unchanged and the performance figures you see presented here are what you can expect from the Germanium.
| CPU |
Intel Core i7-8700K
Overclocked to 4.8GHz |
| Motherboard |
ASUS ROG Strix Z370-F Gaming
|
| Memory |
Team Group Dark Hawk RGB
16GB (2x8GB) @ 3200MHz 16-18-18-38 |
| Graphics Card |
Varies
|
| System Drive |
Patriot Wildfire 240GB
|
| Games Drive | Crucial M4 512GB |
| Chassis | Streacom ST-BC1 Bench |
| CPU Cooler |
OCUK TechLabs 240mm AIO
|
| Power Supply |
SuperFlower Leadex II 850W 80Plus Gold
|
| Operating System |
Windows 10 Professional
|
Comparison Graphics Cards List
- Nvidia RTX 2080 Ti Founders Edition (FE) 11GB
- ASUS ROG RTX 2080 Ti Strix 11GB
- Nvidia RTX 2080 Founders Edition (FE) 8GB
- Gigabyte RTX 2080 Gaming OC 8GB
- Palit RTX 2080 GameRock Premium 8GB
- ASUS ROG RTX 2080 Strix OC 8GB
- Gigabyte Aorus RTX 2080 Xtreme 8GB
- MSI RTX 2070 Gaming Z 8GB
- MSI RTX 2070 Armor 8GB
- Nvidia GTX 1080 Ti Founders Edition (FE) 11GB
- Gigabyte GTX 1080 G1 Gaming 8GB
- Palit GTX 1070 Ti Super Jetstream 8GB
- Nvidia GTX 1070 Founders Edition (FE) 8GB
- Nvidia GTX 1060 Founders Edition (FE) 6GB
- Gigabyte GTX 980 Ti XTREME Gaming 6GB
- AMD RX Vega 64 Air 8GB
- AMD RX Vega 56 8GB
- Sapphire RX 590 Nitro+ Special Edition (SE) 8GB
- Sapphire RX 580 Nitro+ 8GB
- ASUS RX 570 ROG Strix Gaming OC 4GB
Software and Games List
- 3DMark Fire Strike & Fire Strike Ultra (DX11 Synthetic)
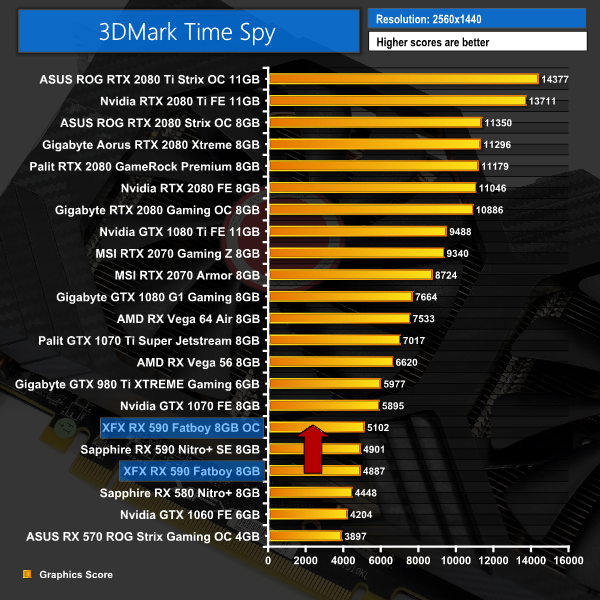
- 3DMark Time Spy (DX12 Synthetic)
- Deus Ex: Mankind Divided (DX12)
- Far Cry 5 (DX11)
- Tom Clancy’s Ghost Recon: Wildlands (DX11)
- Middle Earth: Shadow of War (DX11)
- Shadow of the Tomb Raider (DX12)
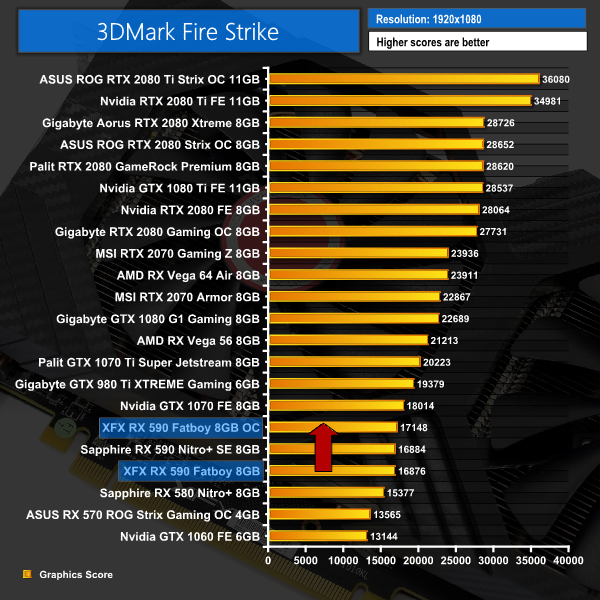
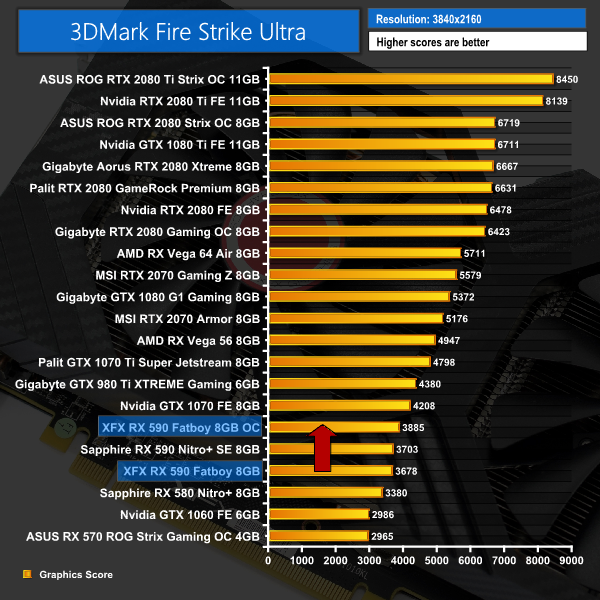
We run each benchmark/game three times, and present averages in our graphs.3DMark Fire Strike is a showcase DirectX 11 benchmark designed for today’s high-performance gaming PCs. It is our [FutureMark’s] most ambitious and technical benchmark ever, featuring real-time graphics rendered with detail and complexity far beyond what is found in other benchmarks and games today.
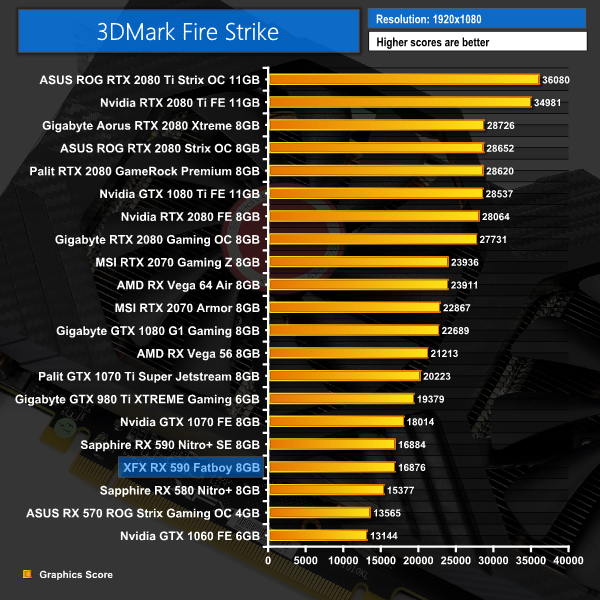
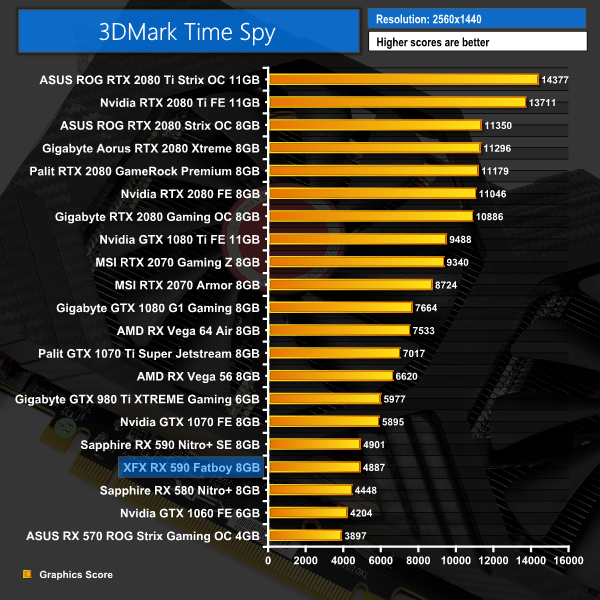
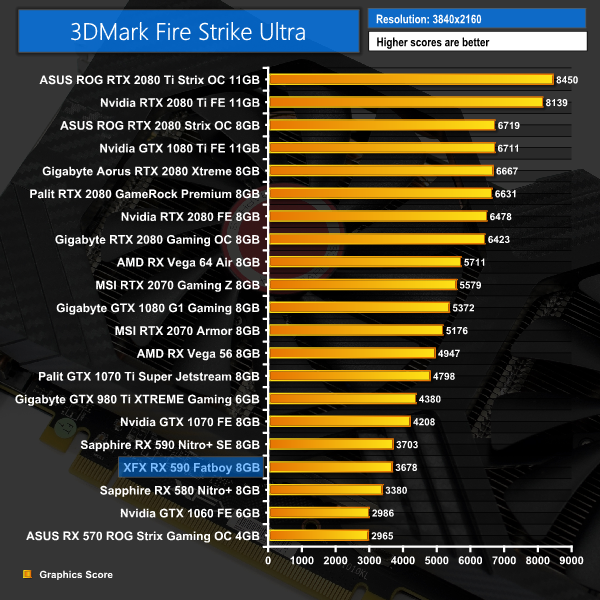
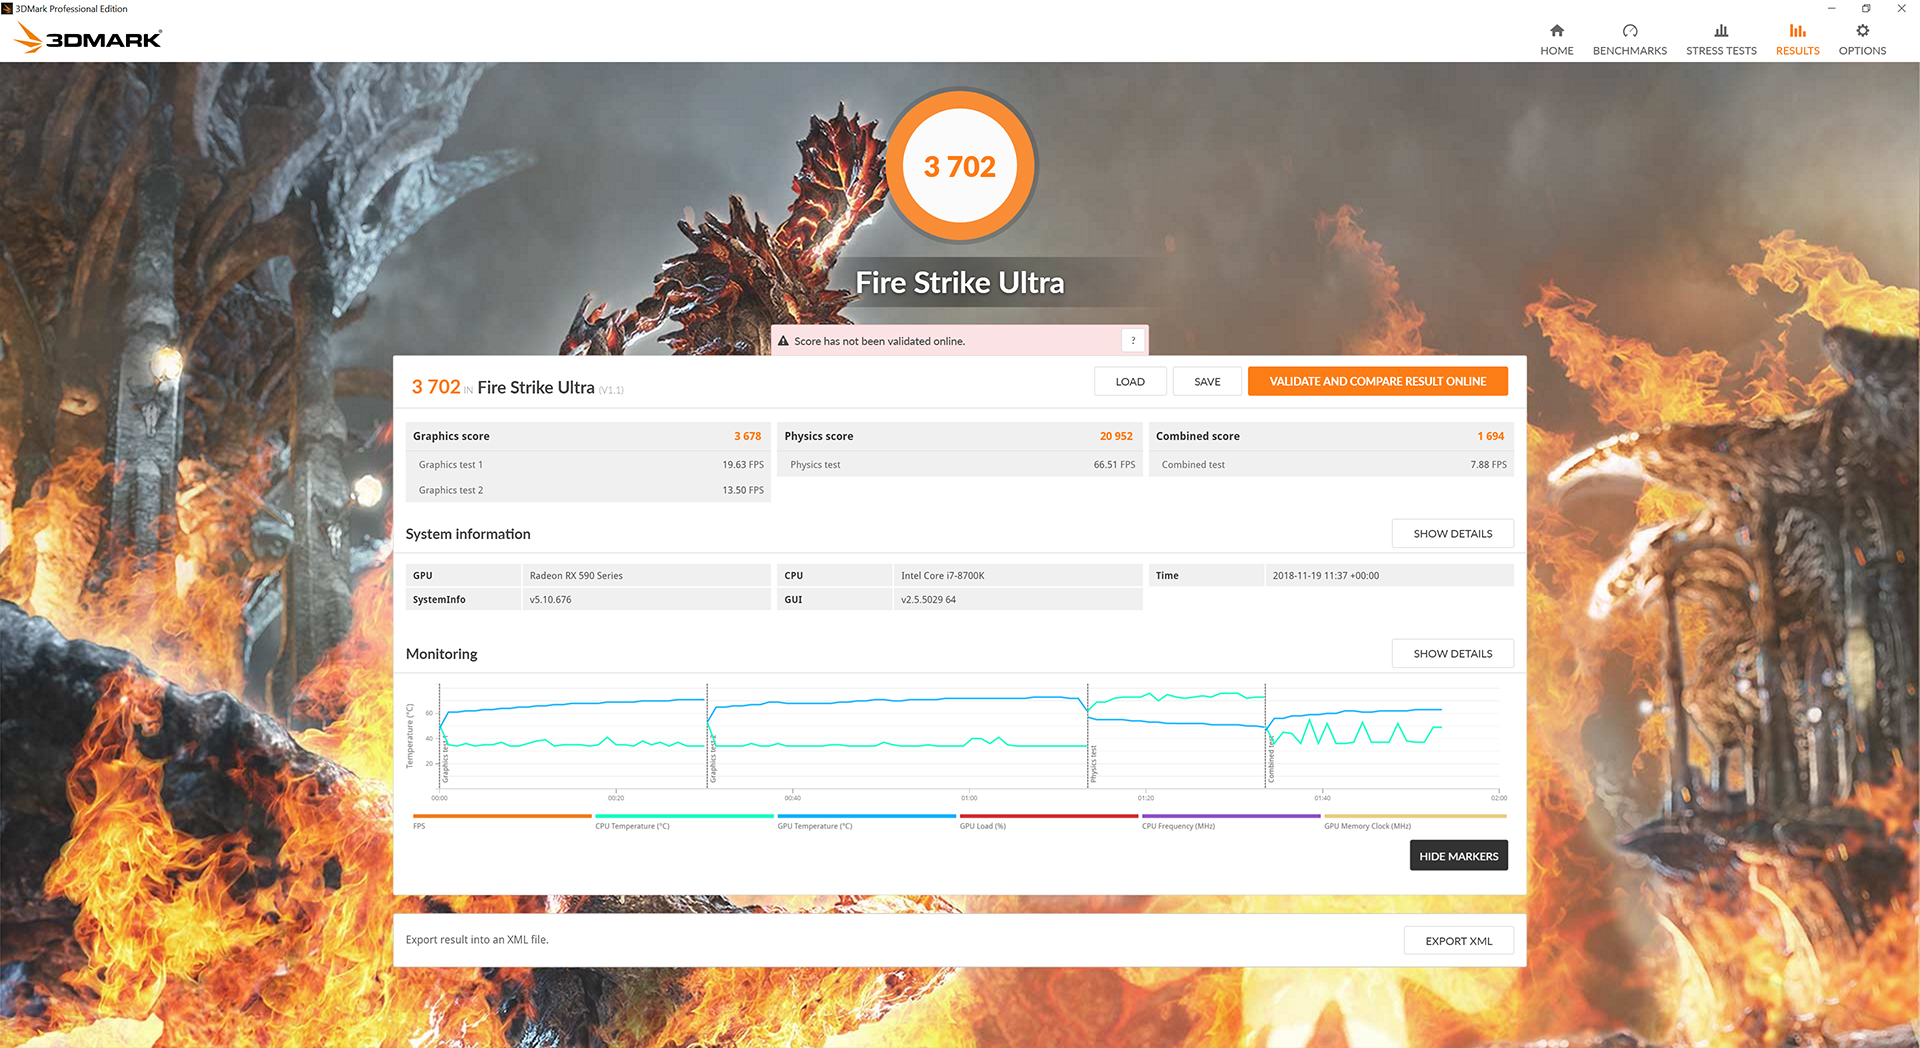
After our first set of 3DMark benchmarks, we can clearly see there is not much in it between the XFX and Sapphire RX 590 cards – the XFX is just behind, but only by the slimmest of margins.Deus Ex: Mankind Divided is set in the year 2029, two years after the events of Human Revolution and the “Aug Incident”—an event in which mechanically augmented humans became uncontrollable and lethally violent. Unbeknownst to the public, the affected augmented received implanted technology designed to control them by the shadowy Illuminati, which is abused by a rogue member of the group to discredit augmentations completely. (Wikipedia).
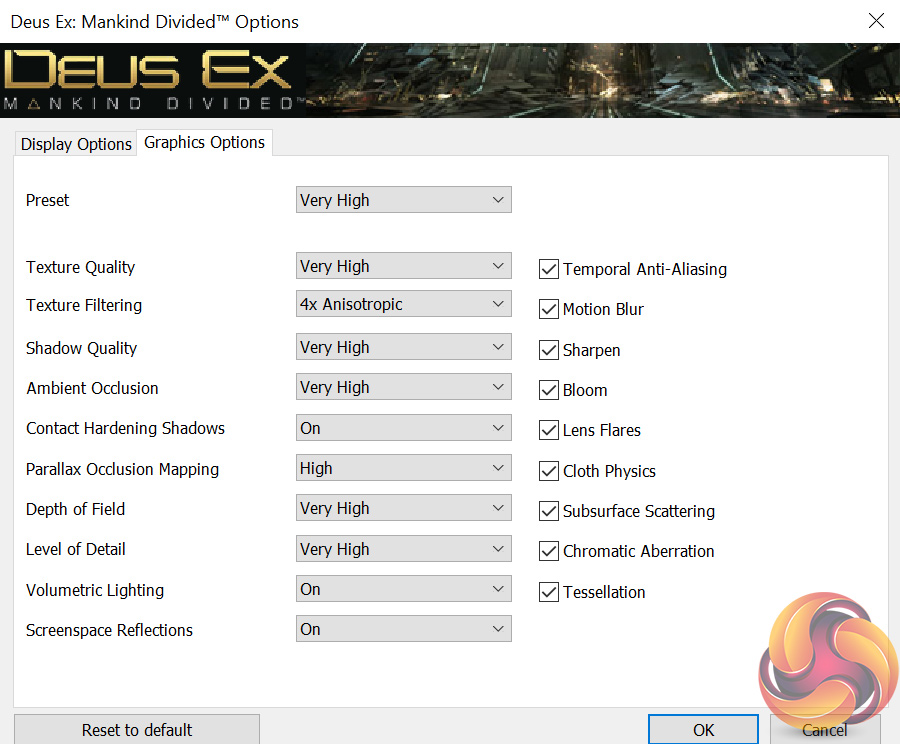
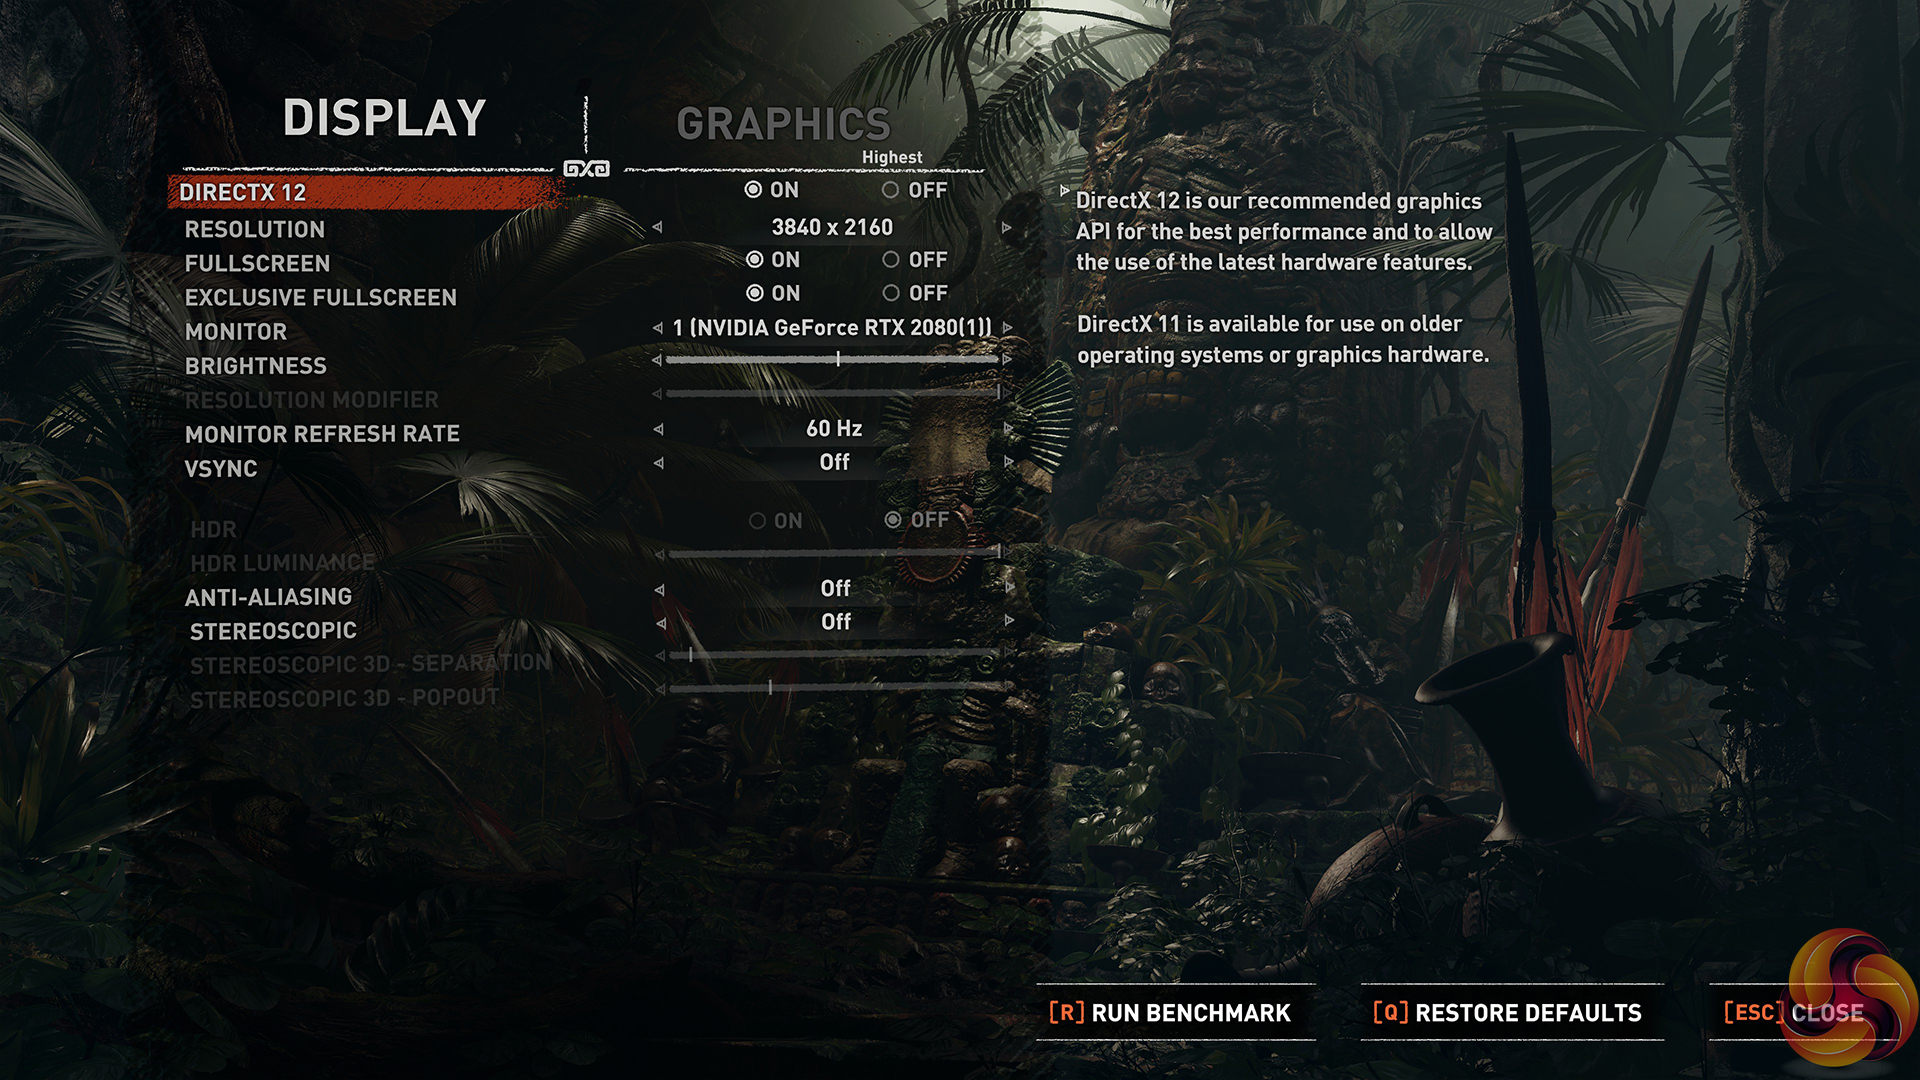
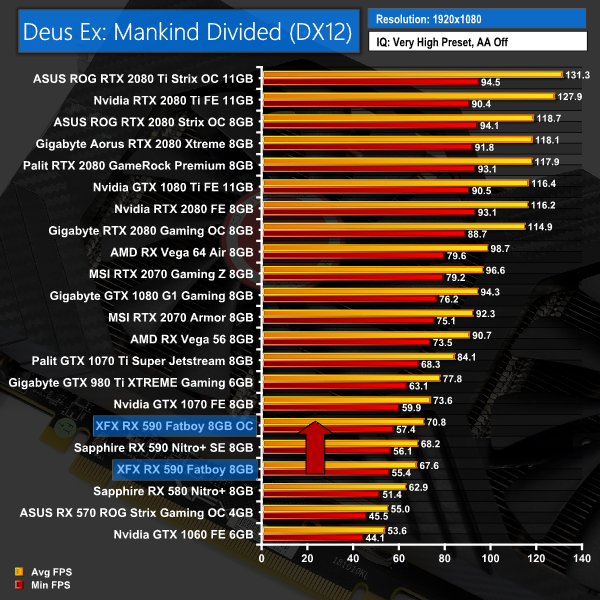
We test using the Very High preset, with MSAA disabled. We use the DirectX 12 API.
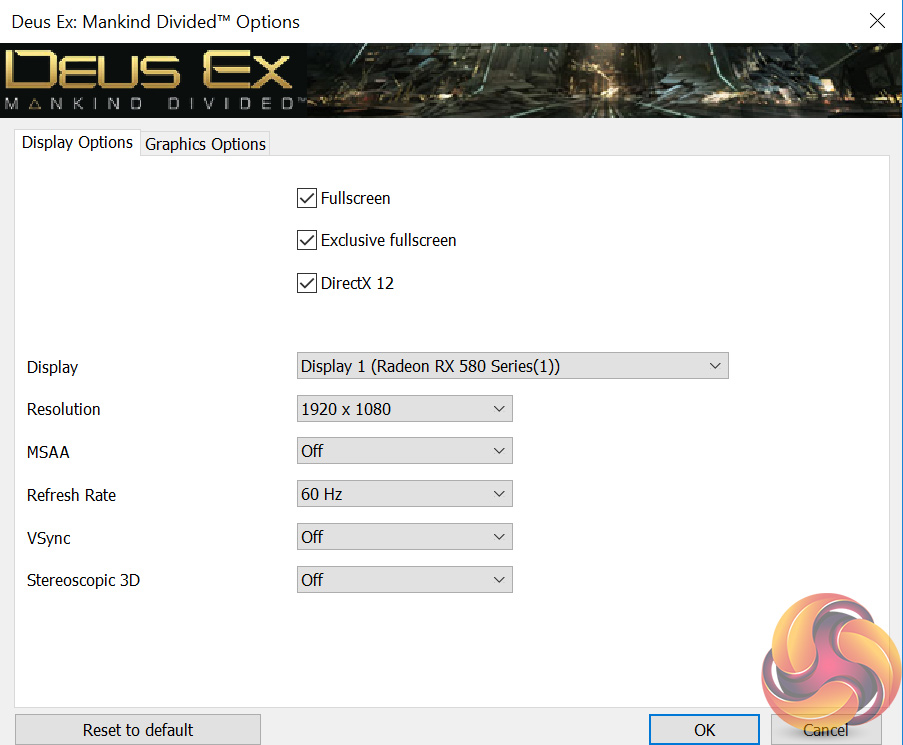
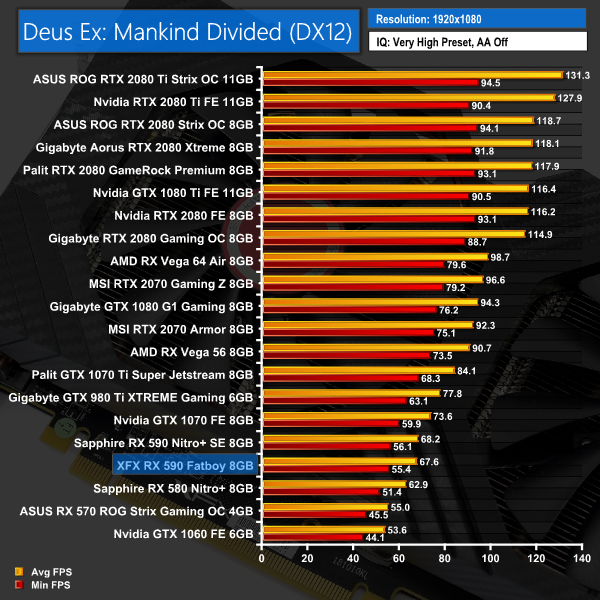
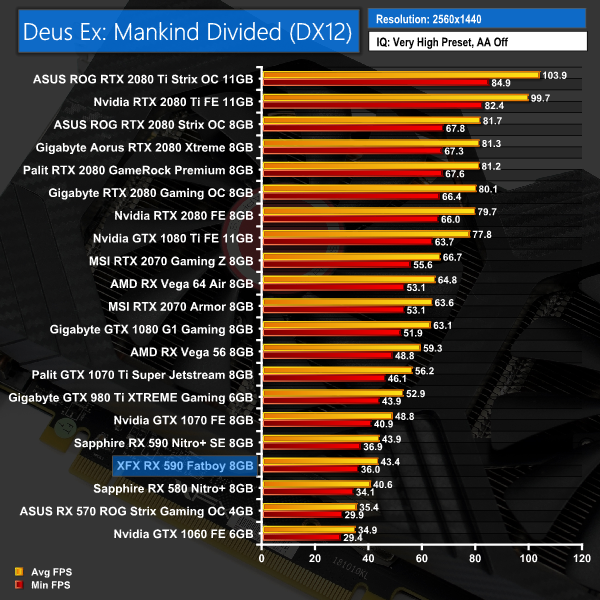

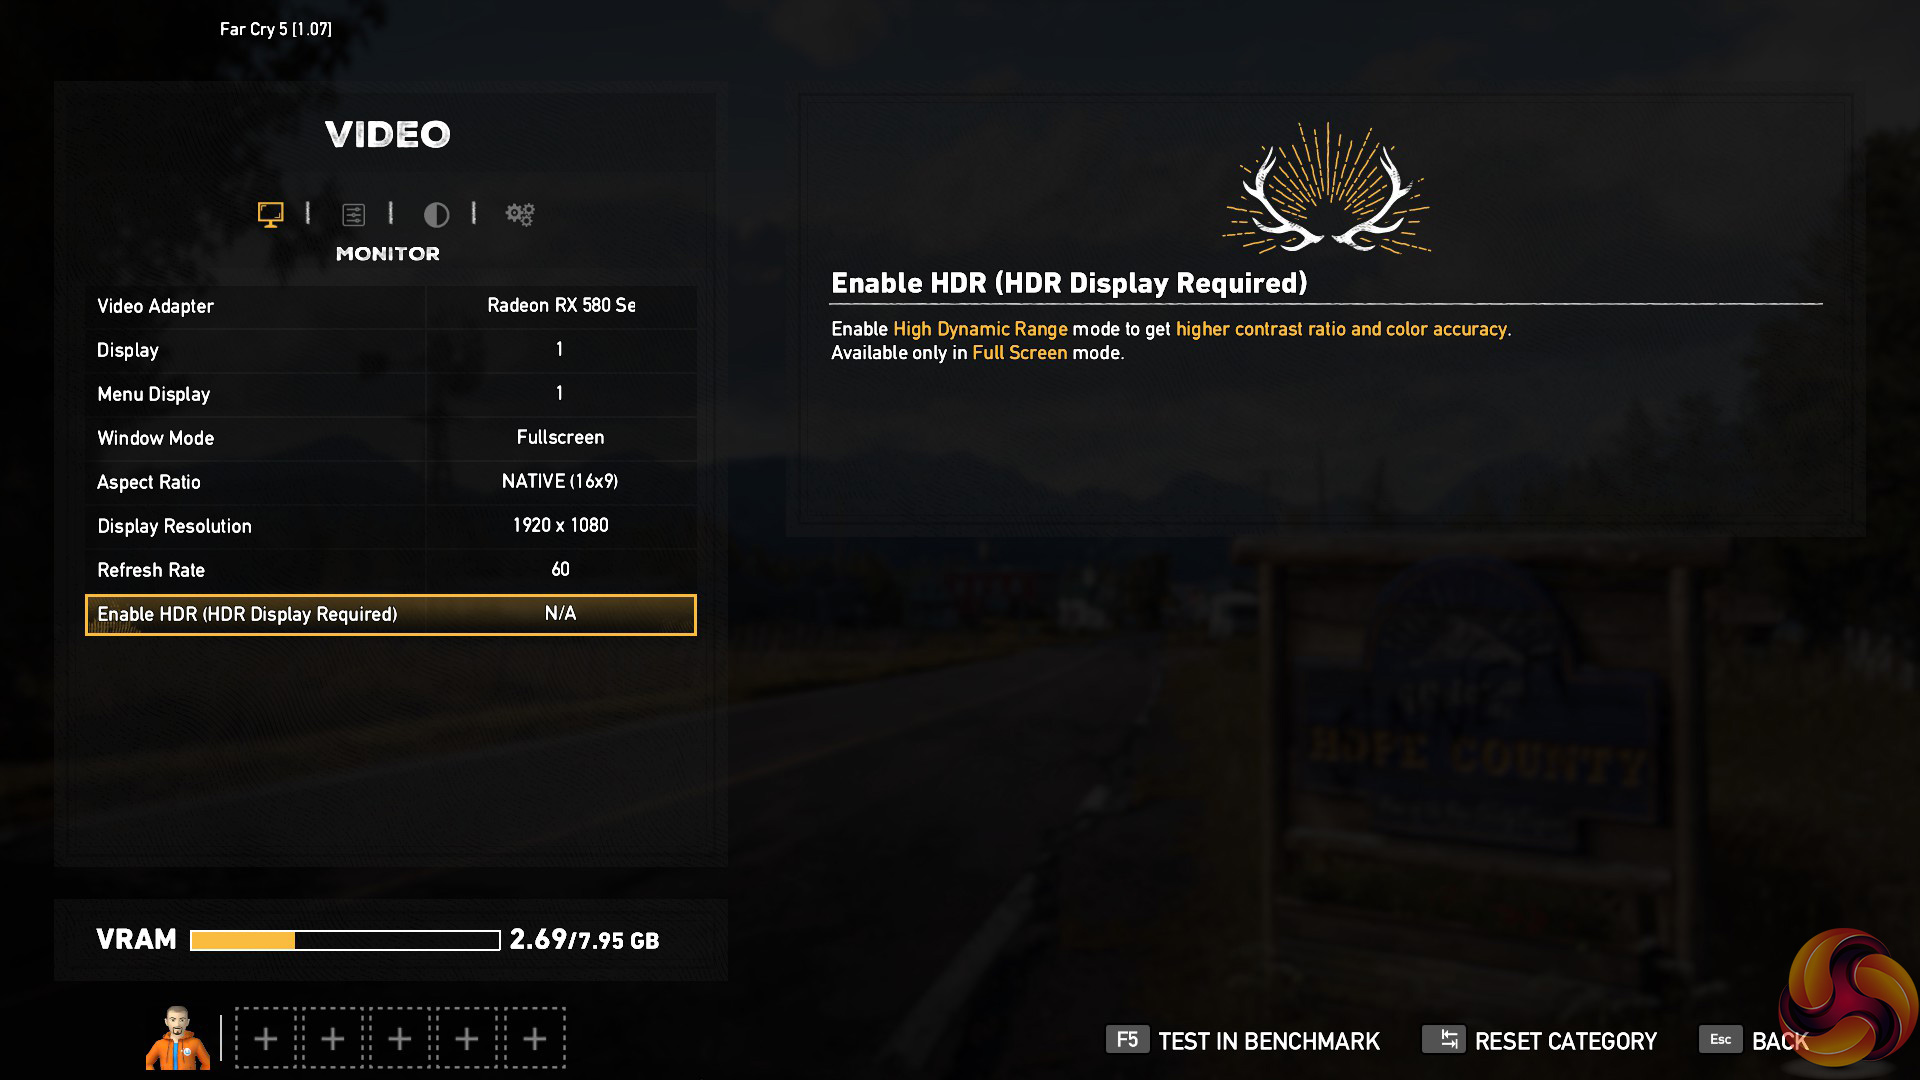
The Fatboy is again slightly behind the Sapphire Nitro+ RX 590 when it comes to Deus Ex: Mankind Divided, but if we look at the 1080p benchmark, the difference is a mere 0.6FPS.Far Cry 5 is an action-adventure first-person shooter game developed by Ubisoft Montreal and Ubisoft Toronto and published by Ubisoft for Microsoft Windows, PlayStation 4 and Xbox One. It is the eleventh entry and the fifth main title in the Far Cry series, and was released on March 27, 2018.
The game takes place in the fictional Hope County, Montana, where charismatic preacher Joseph Seed and his cult Project at Eden’s Gate holds a dictatorial rule over the area. The story follows an unnamed junior deputy sheriff, who becomes trapped in Hope County and works alongside factions of a resistance to liberate the county from Eden’s Gate. (Wikipedia).
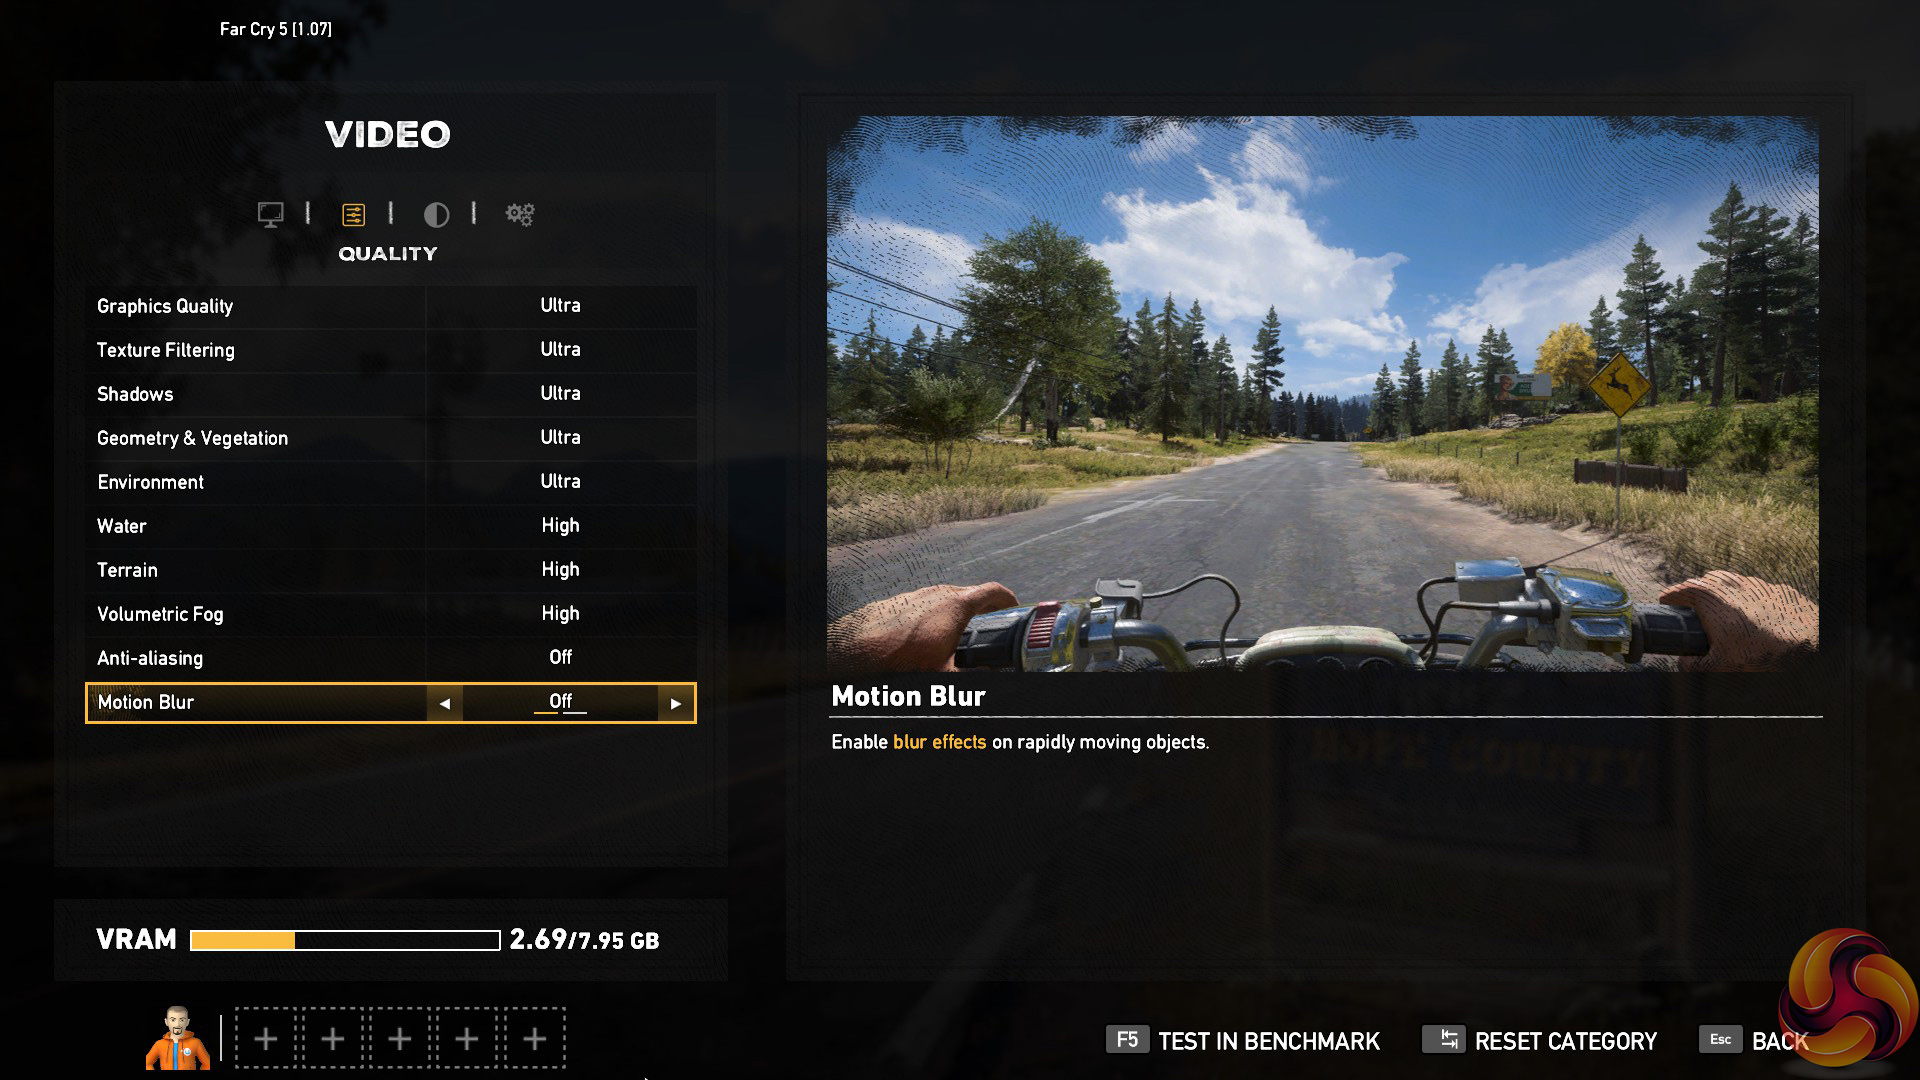
We test using the Ultra preset, with AA and motion blur disabled.
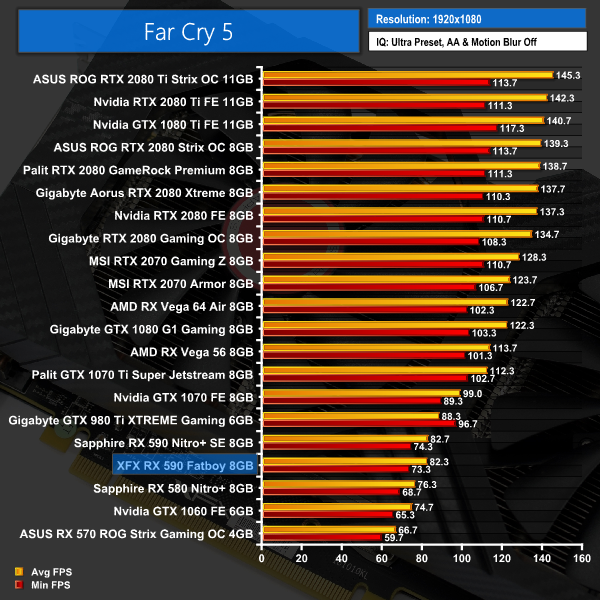
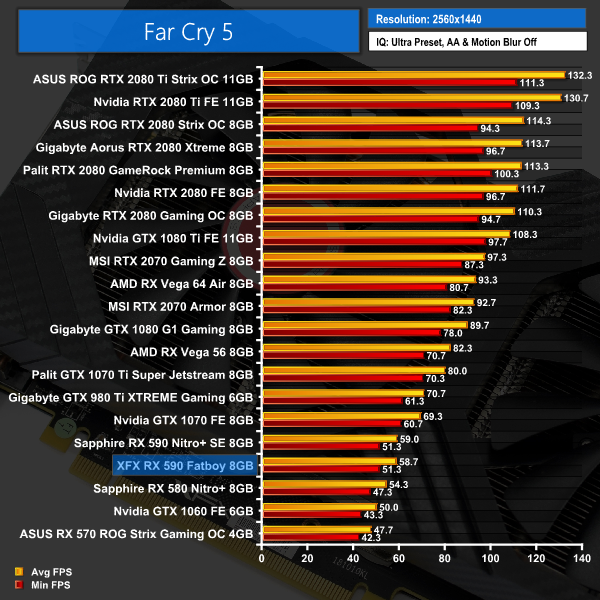
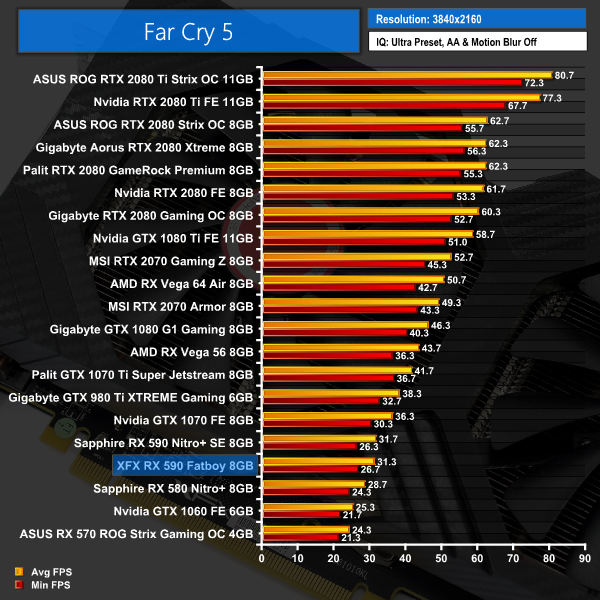
Far Cry 5 tells the same story, with the Sapphire RX 590 proving to be ever so slightly faster across all three resolutions.Tom Clancy’s Ghost Recon Wildlands is a tactical shooter video game developed by Ubisoft Paris and published by Ubisoft. It was released worldwide on March 7, 2017, for Microsoft Windows, PlayStation 4 and Xbox One, as the tenth installment in the Tom Clancy’s Ghost Recon franchise and is the first game in the Ghost Recon series to feature an open world environment. (Wikipedia).
We test using the Very High preset.
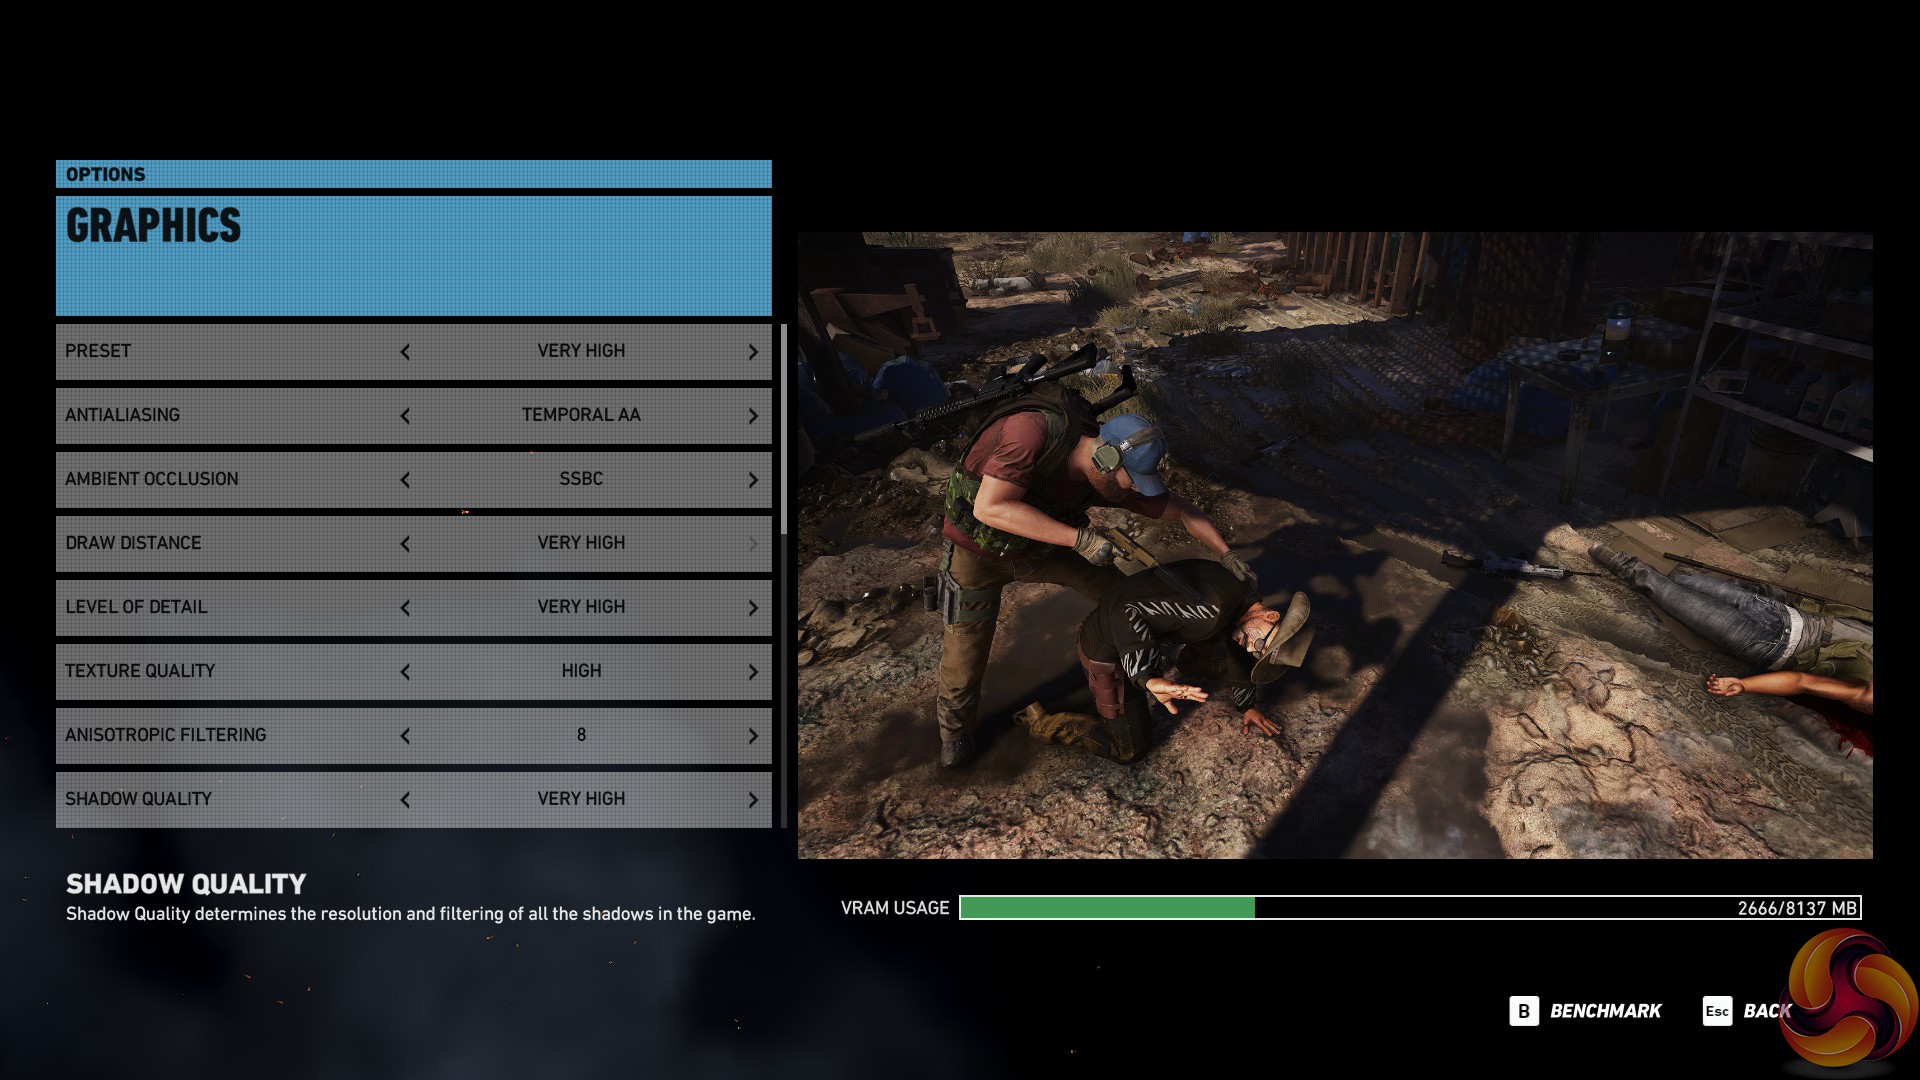
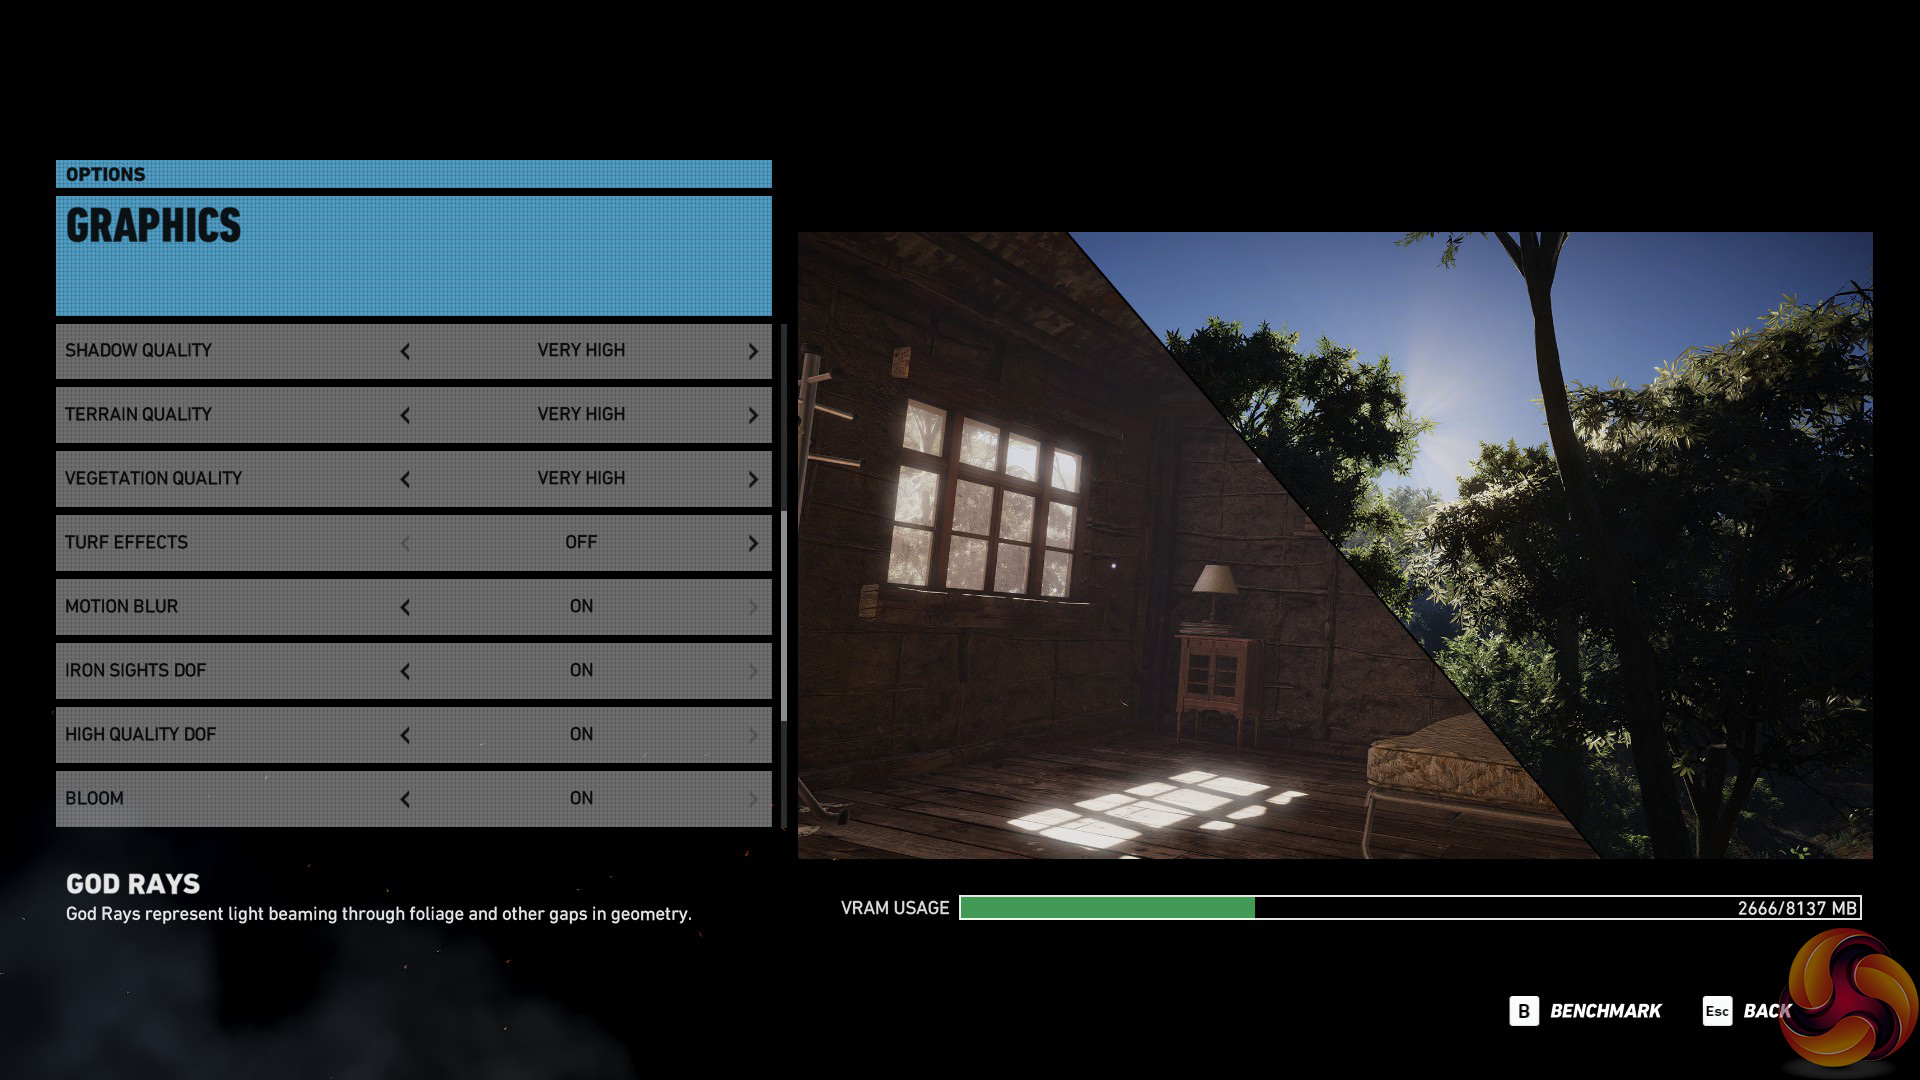
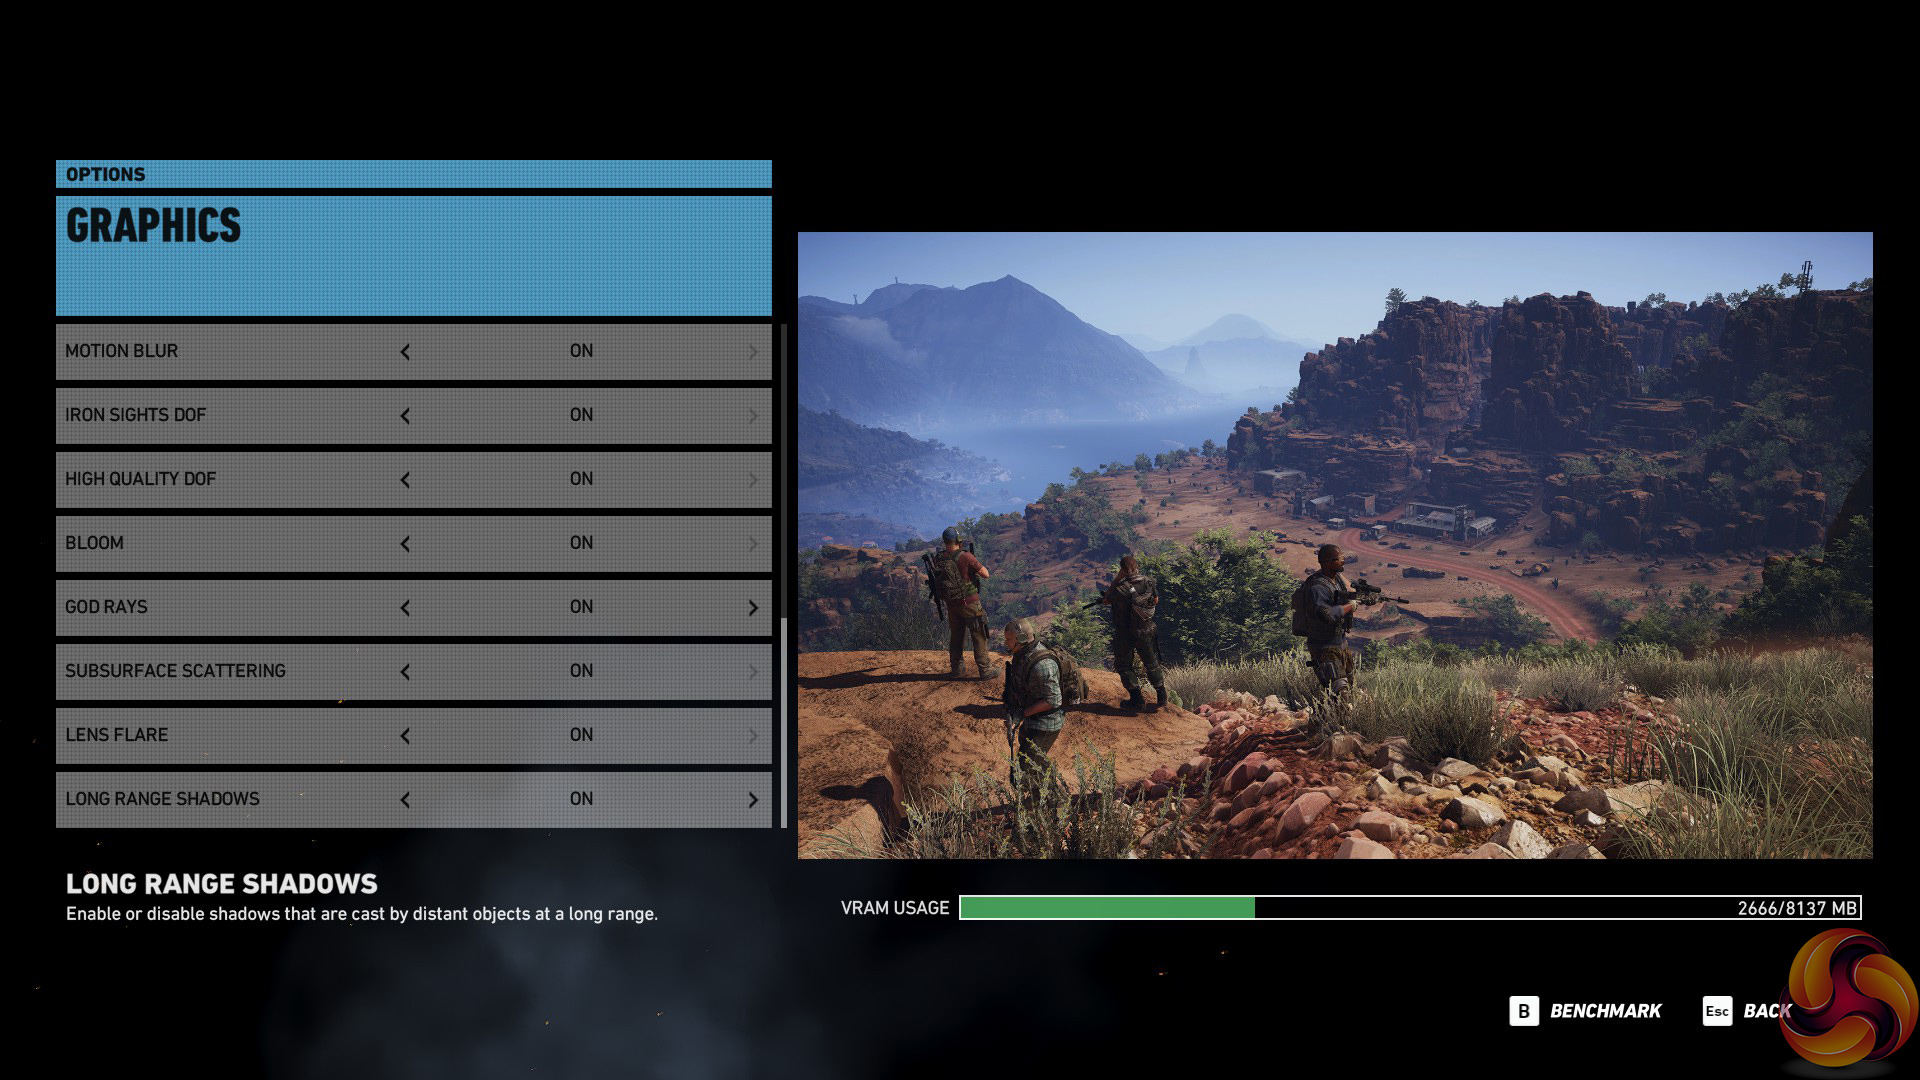
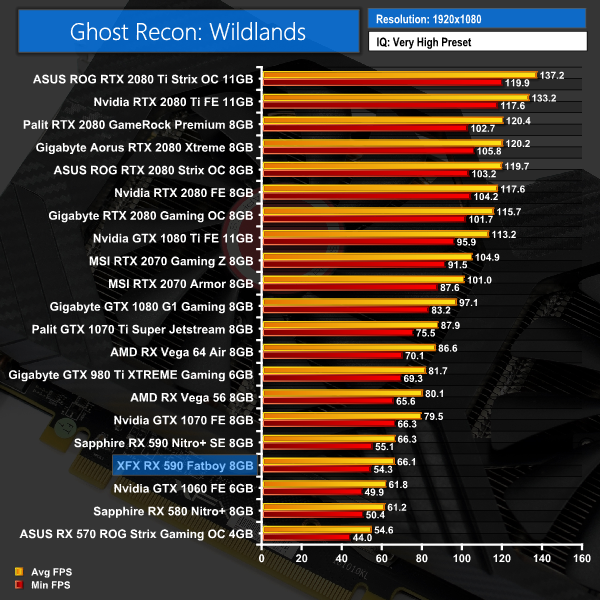
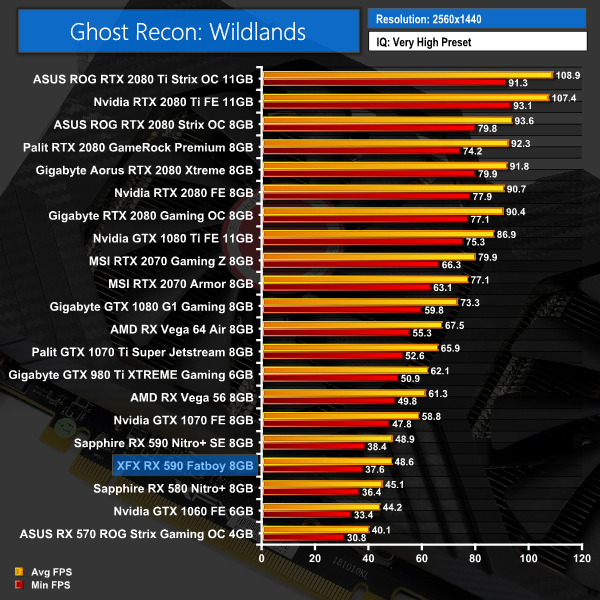

Despite the gap being just 0.2FPS at 1080p, the XFX Fatboy still proves just slower than its Sapphire counterpart when playing Ghost Recon: Wildlands.Middle-earth: Shadow of War is an action role-playing video game developed by Monolith Productions and published by Warner Bros. Interactive Entertainment. It is the sequel to 2014’s Middle-earth: Shadow of Mordor, and was released worldwide for Microsoft Windows, PlayStation 4, and Xbox One on October 10, 2017. (Wikipedia).
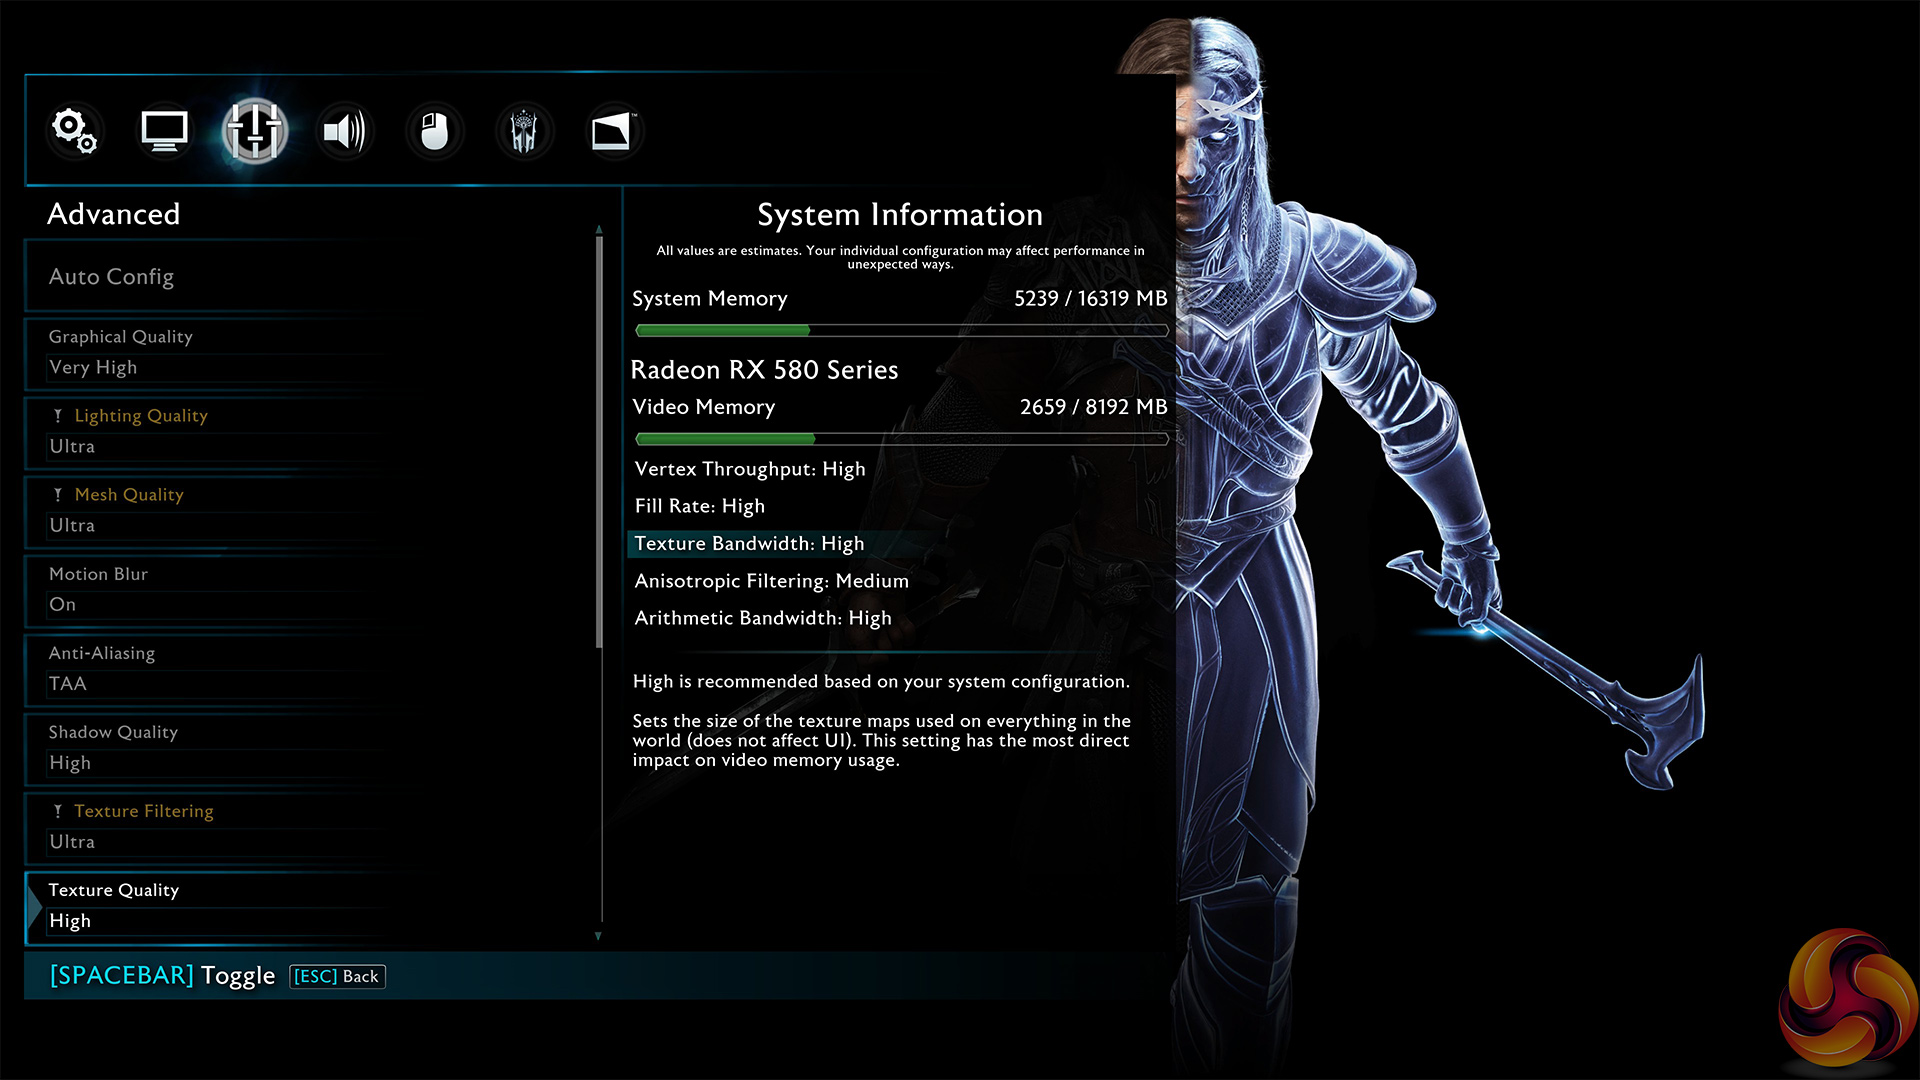
We test using the Very High preset.

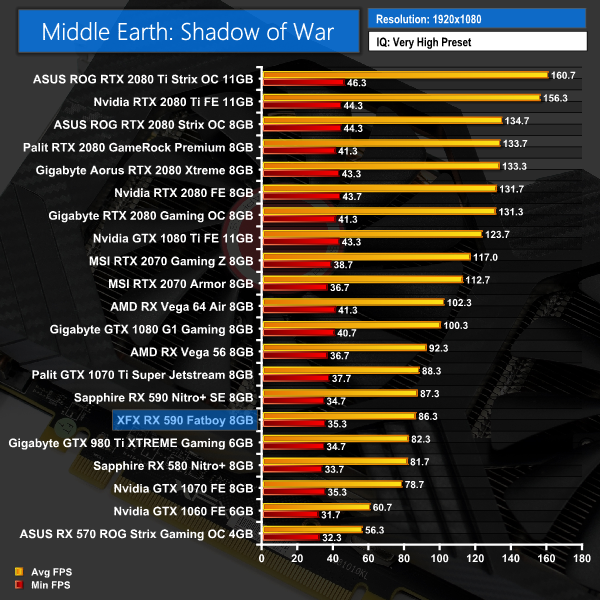
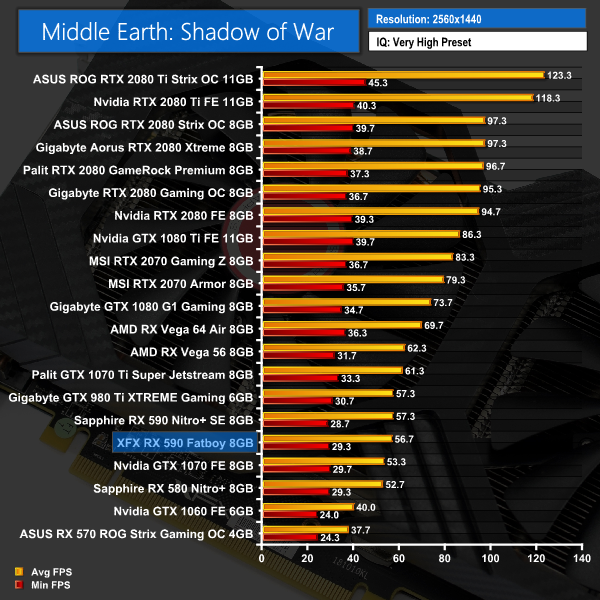
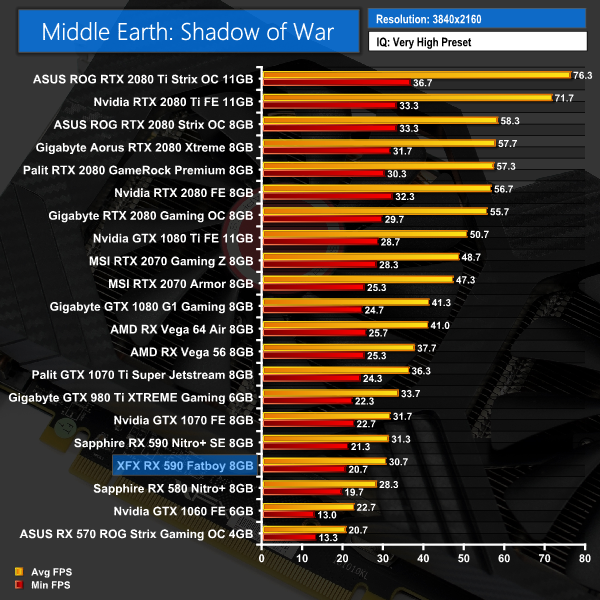
Continuing this trend, Middle Earth: Shadow of War shows the XFX card to sit just behind the Sapphire RX 590, with a 0.7FPS difference at 1080p.Shadow of the Tomb Raider is an action-adventure video game developed by Eidos Montréal in conjunction with Crystal Dynamics and published by Square Enix. It continues the narrative from the 2013 game Tomb Raider and its sequel Rise of the Tomb Raider, and is the twelfth mainline entry in the Tomb Raider series. The game released worldwide on 14 September 2018 for Microsoft Windows, PlayStation 4 and Xbox One. (Wikipedia).
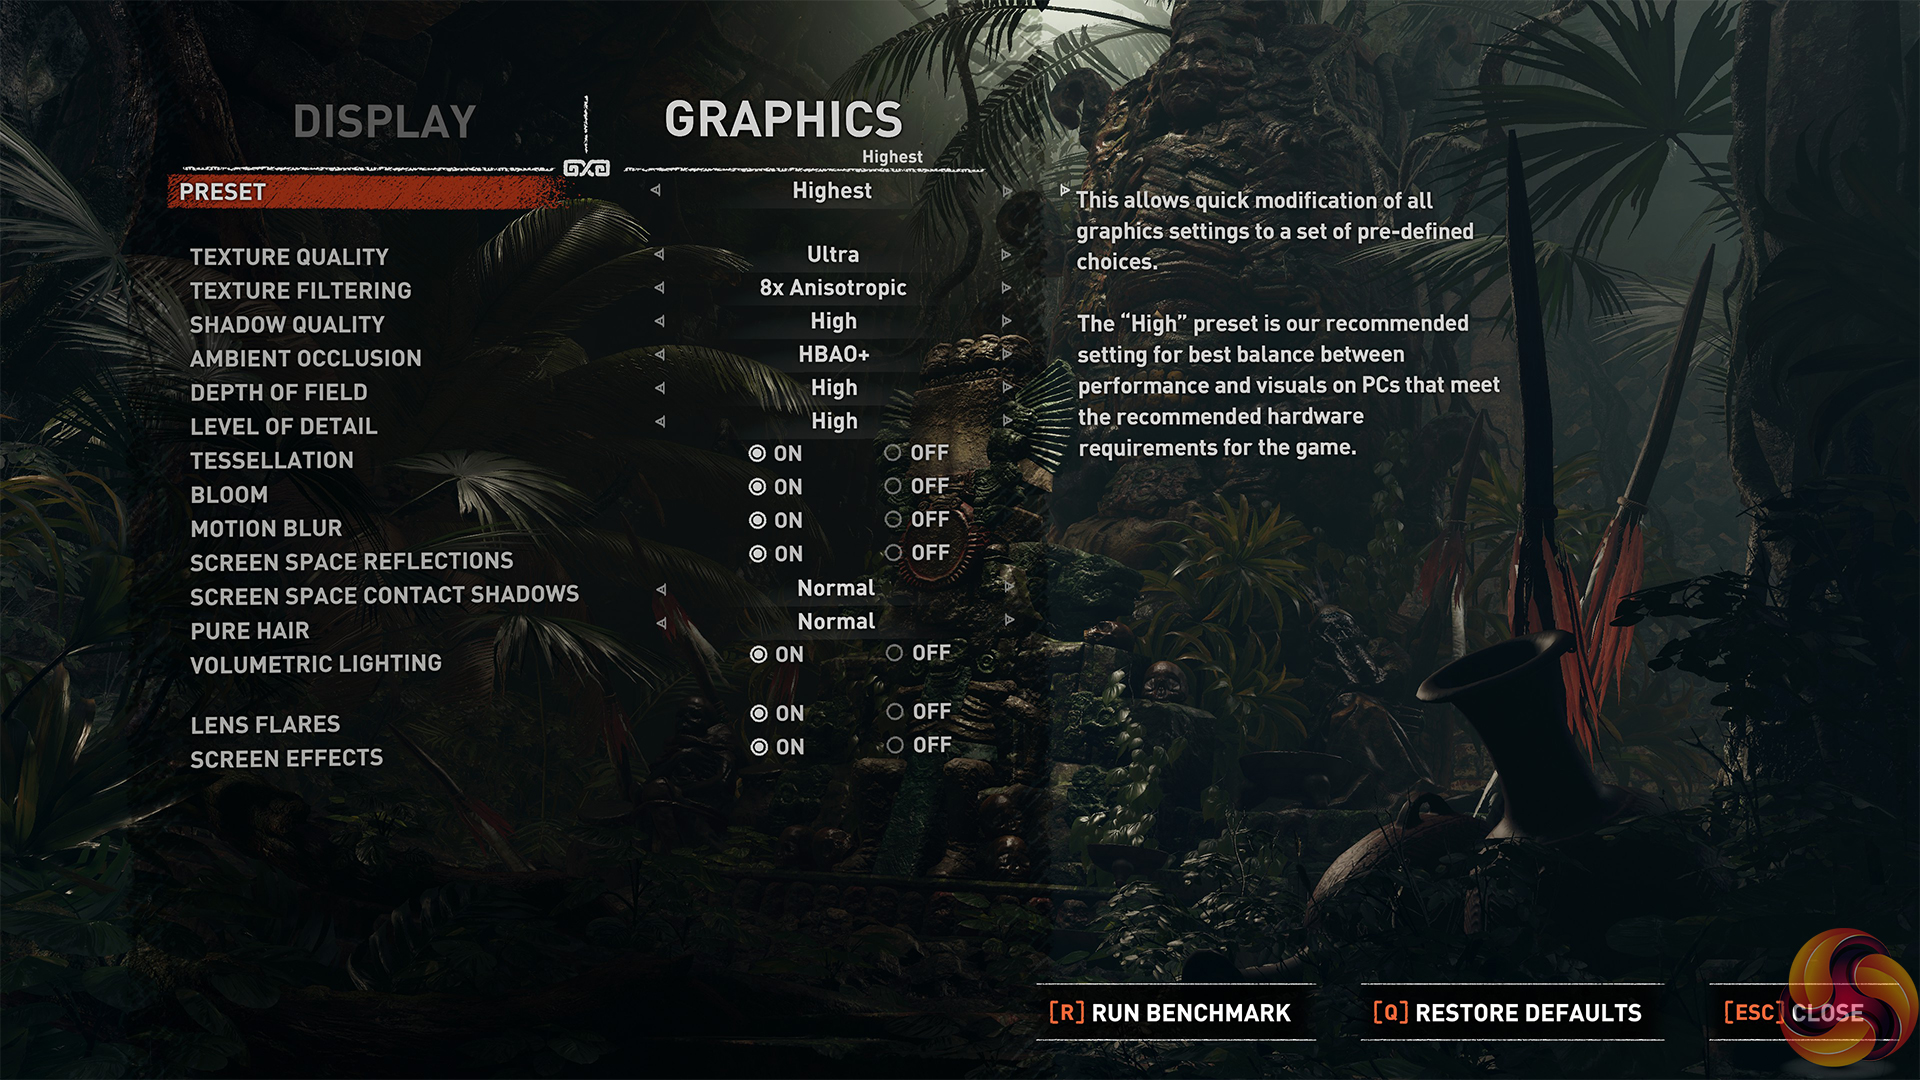
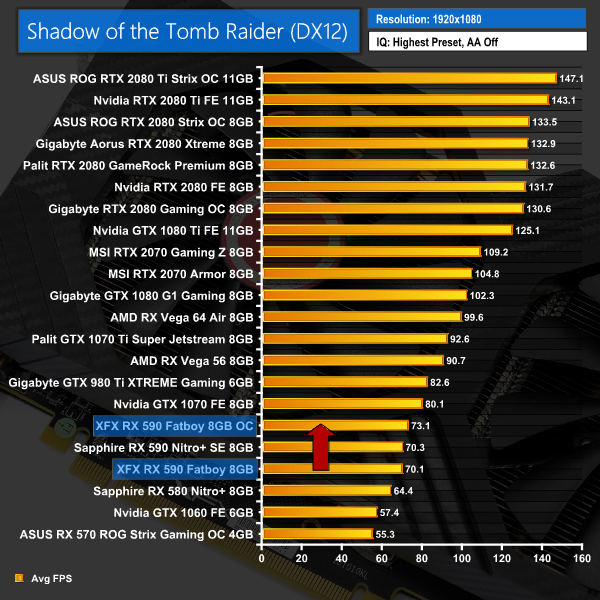
We test using the Highest preset, with AA disabled. We test using the DX12 API.
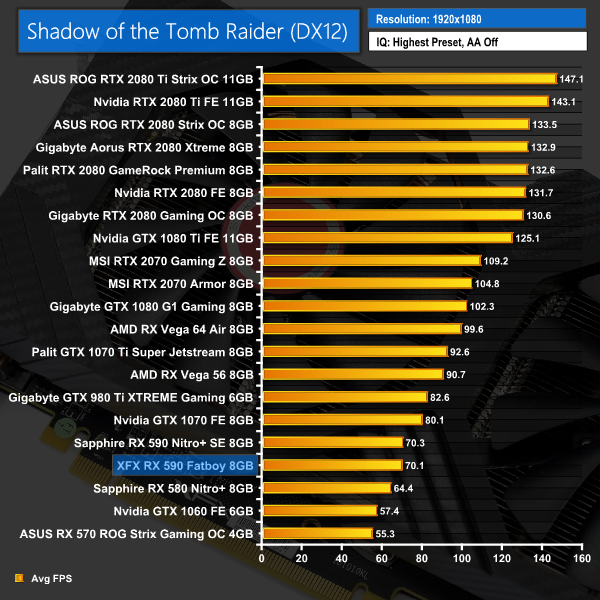
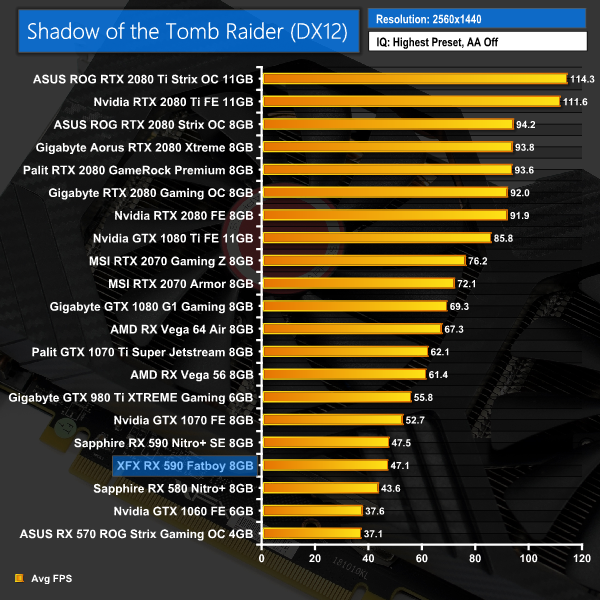
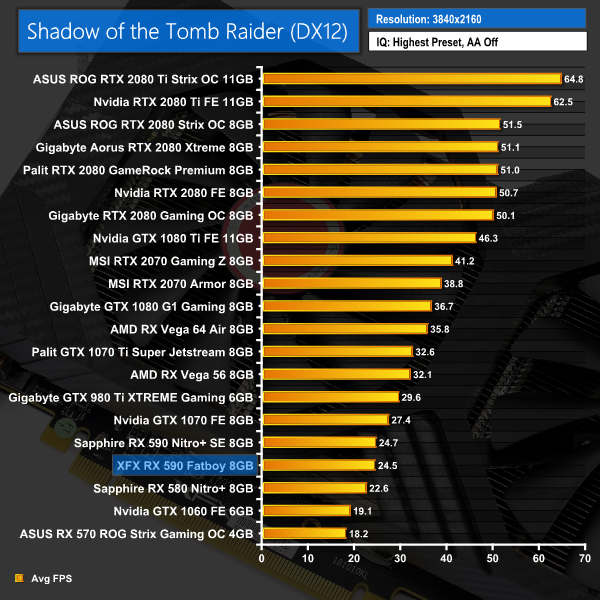
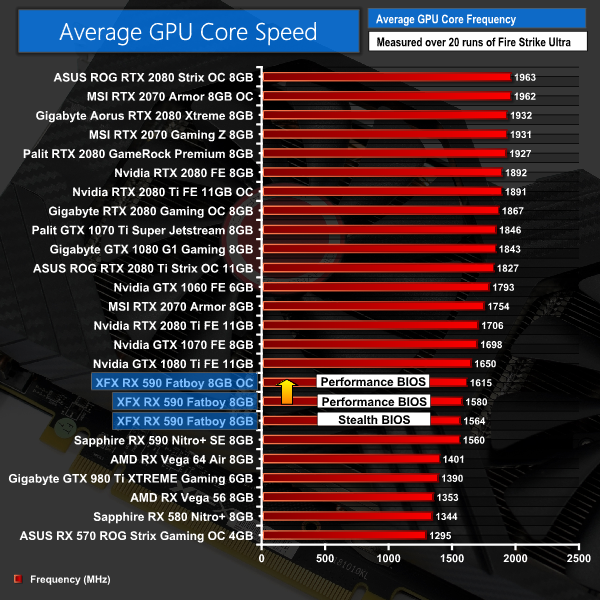
Our last game today, Shadow of the Tomb Raider has the XFX Fatboy just 0.2FPS behind the Sapphire Nitro+ model when gaming at 1080p.Here we present the average clock speed for each graphics card while running the 3DMark Fire Strike Ultra stress test 20 times. We use GPU-Z in tandem with the Powenetics Project to record the GPU core frequency during the Fire Strike Ultra runs – at the end, we are left with around 4300 data entries.
We calculate the average core frequency during the entire 20-run test to present here.
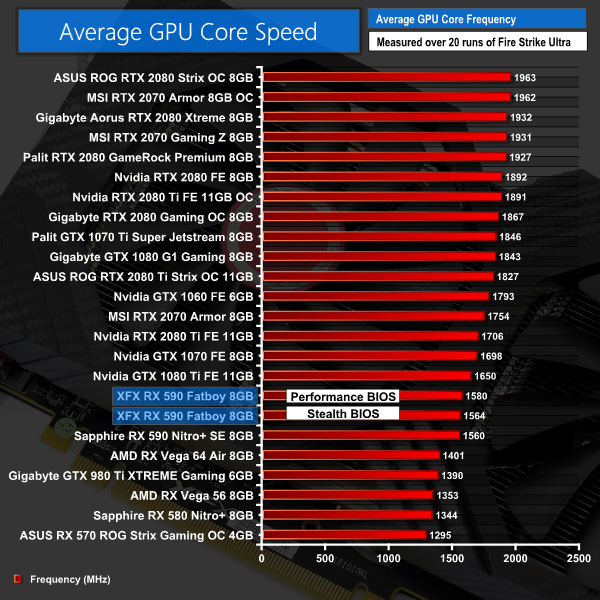
Here it is important to note that Nvidia and AMD cards behave differently when it comes to clock speed. Nvidia cards will almost always exceed their rated boost clocks (assuming there is thermal headroom) thanks to GPU Boost technology. AMD cards don't do that – they will either run at exactly their rated boost clock, or slightly slower if temperatures are high.
That is exactly what we see when testing the average clock speed of the XFX Fatboy – using the performance BIOS, it held absolutely steady at 1580MHz. The stealth BIOS, however, drops the fan speed (pushing up temperatures) and so the clock couldn't be maintained as high, but it still sat at 1564MHz.
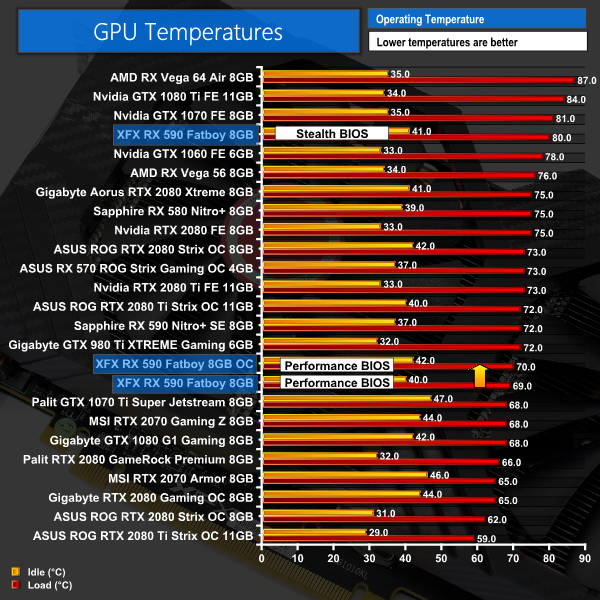
Both of these are higher than the average clock speed of the Sapphire RTX 590, though, despite that card edging ahead in our benchmarks. As we saw, the different is very small – a fraction of a frame – but the Sapphire does have faster memory at 2100MHz (versus 2000MHz for the Fatboy) so we put that down as the explanation.For our temperature testing, we measure the peak GPU core temperature under load, as well as the GPU temperature with the card idling on the desktop. A reading under load comes from running the 3DMark Fire Strike Ultra stress test 20 times. An idle reading comes after leaving the system on the Windows desktop for 30 minutes.
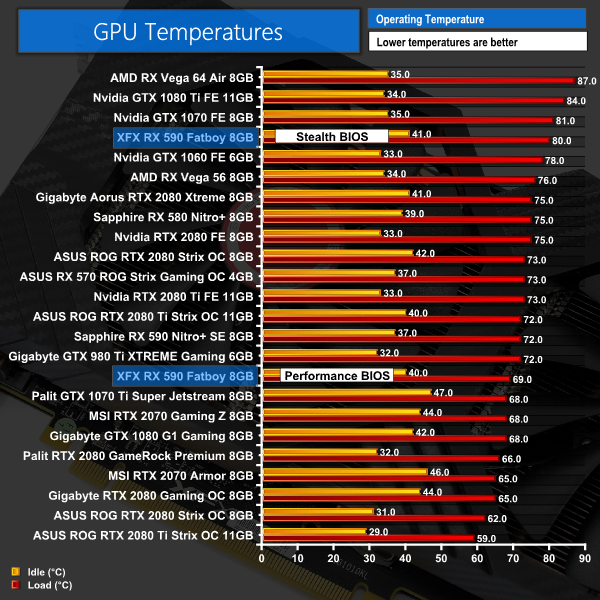
Moving onto thermals, as mentioned we tested both performance and stealth BIOS options for the Fatboy. The performance BIOS did very well, keeping the GPU core at or below 69C, while the stealth BIOS did run hotter with a peak of 80C. Both results have relatively high idle temperatures, too, as the card's fans stop spinning when idle resulting in higher temperatures.
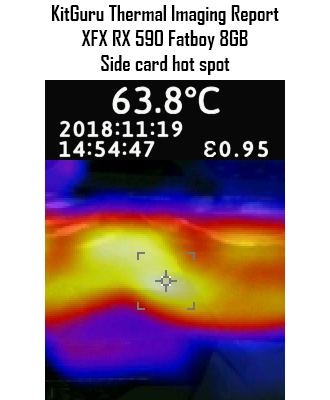
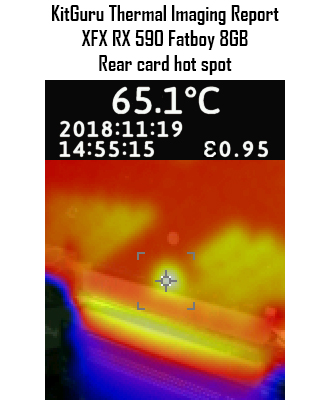
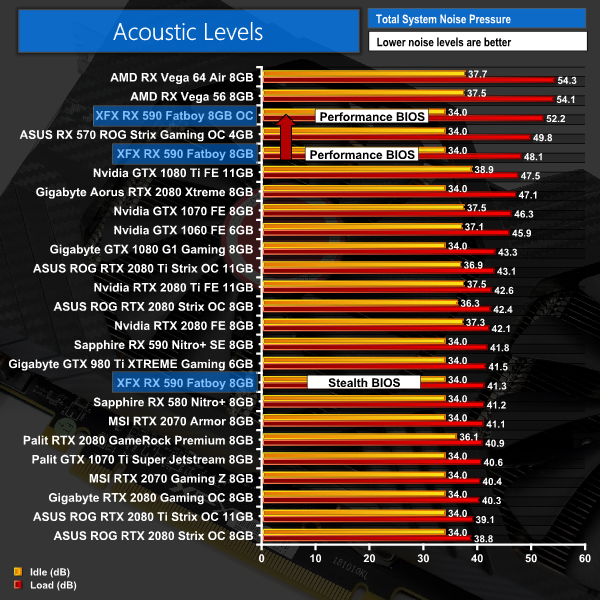
In terms of the thermal imaging camera, there is nothing to be concerned about here. Both the side and the rear of the card peaked at 64-65C under load which is pretty much par for the course from an aftermarket card.We take our noise measurements with the sound meter positioned 1 foot from the graphics card. I measured the sound floor to be 34 dBA, thus anything above this level can be attributed to the graphics cards. The power supply is passive for the entire power output range we tested all graphics cards in, while all CPU and system fans were disabled.
A reading under load comes from running the 3DMark Fire Strike Ultra stress test 20 times. An idle reading comes after leaving the system on the Windows desktop for 30 minutes.
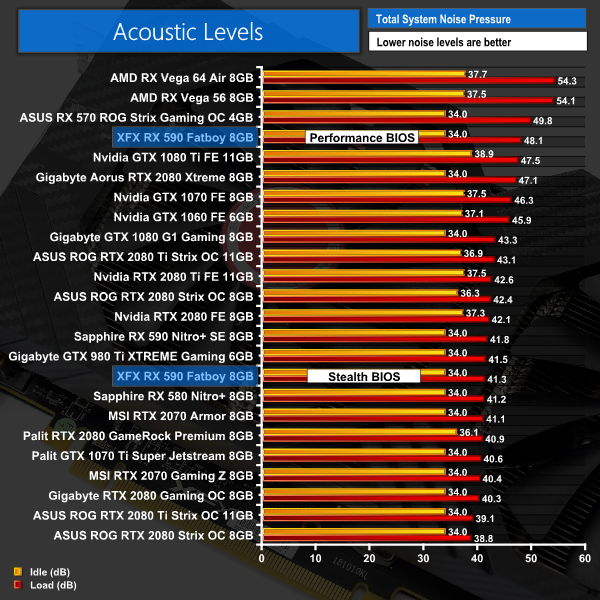
Here we come to one of the downsides to the XFX Fatboy – it is rather loud when using the performance BIOS, with a peak of just over 48dB making it around 6dB louder than the Sapphire Nitro+ RX 590..
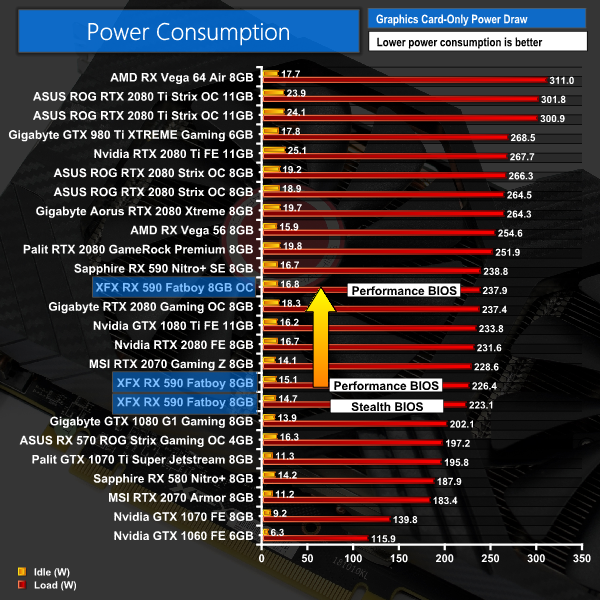
Of course, the stealth BIOS drops this to 41.3dB, making it essentially the same as the Sapphire card, but we have to remember that BIOS also runs significantly hotter. To my mind, the Sapphire RX 590 cuts a much better balance of offering good thermals and low noise levels – with the XFX Fatboy, you seemingly have to choose between ‘loud and cool' or ‘quiet and hot'.We have recently revamped our GPU power consumption testing. Previously we would measure the total system power draw with each graphics card installed. Given that the rest of the components did not change, this gave us an idea of the relative power consumption of each graphics card, but we could not be more specific than that.
Now, however, thanks to Cybenetics Labs and its Powenetics Project, we are able to measure the power consumption of the graphics card alone, giving much more precise and accurate data. Essentially, this works by installing sensors in the PCIe power cables, as well as the PCIe slot itself thanks to a special riser card. This data is recorded using specialist software provided by Cybenetics Labs and given it polls multiple times a second (between 6 and 8 times a second, based on my observations) we can track the power consumption in incredible detail over any given amount of time.
You can read more about the Powenetics Project over HERE.
As with previous testing, a reading under load comes from running the 3DMark Fire Strike Ultra stress test 20 times. An idle reading comes after leaving the system on the Windows desktop for 30 minutes. This stress test (20 runs) produces approximately 4300 data entries in the Powenetics software, which we can then export to an Excel file and analyse further. Here we present the average continuous power consumption of each graphics card across the entire 20 run test.
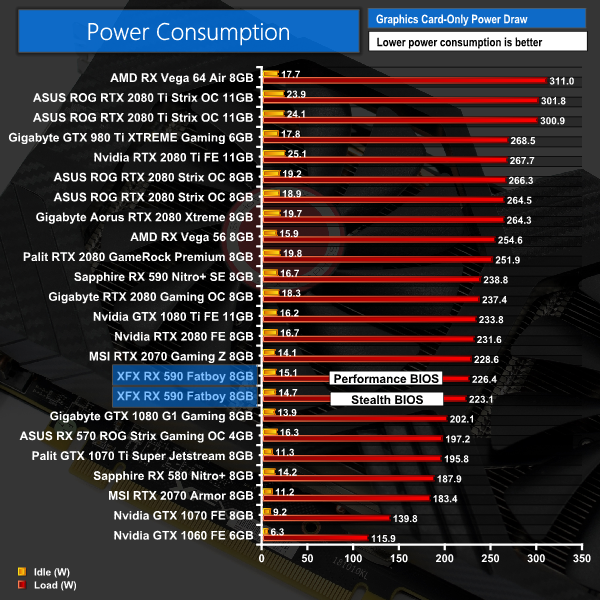
Both BIOS draw around 225W under load, and this is about 13W less than the Sapphire RX 590 Nitro+ SE. That might sound all well and good, but looking at the big picture, I have to say RX 590 is not very efficient at all – it is drawing similar levels of power to an RTX 2080, and we know how much faster that card is. Still, it is what it is.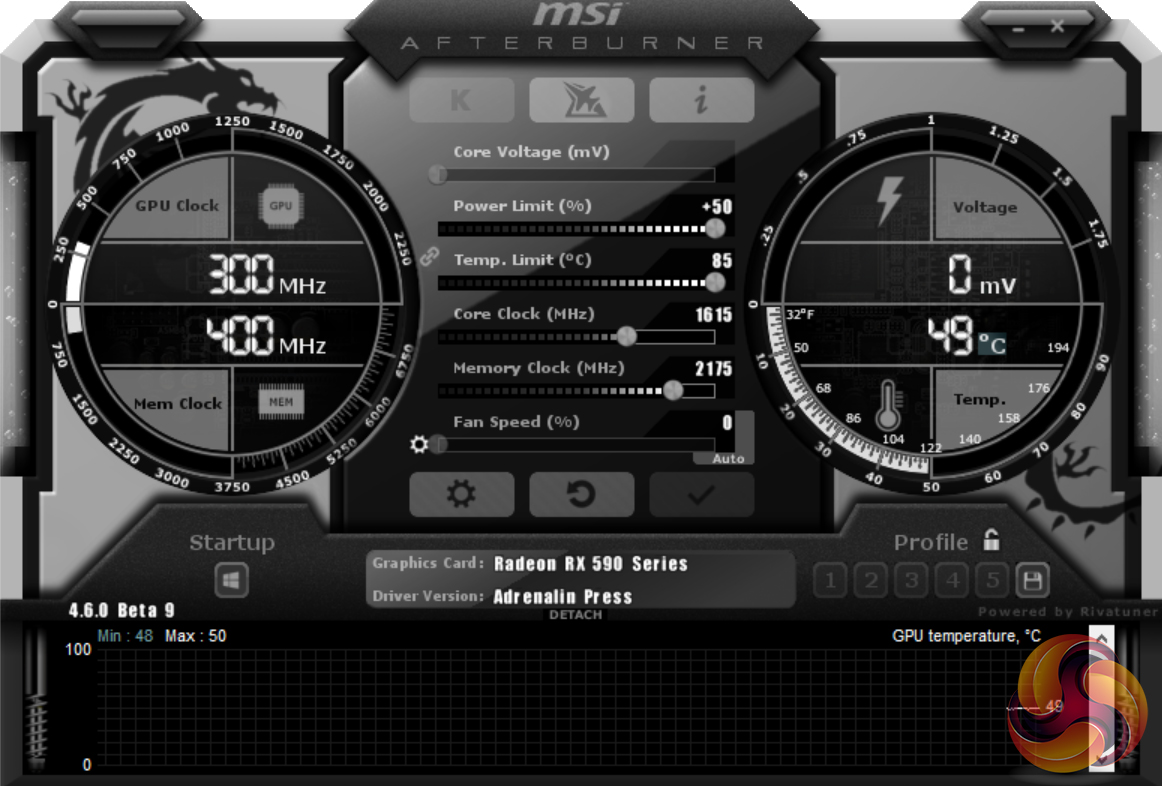
When overclocking the Fatboy, we used MSI Afterburner and set the power and temperature targets to their maximum levels. We could add +35MHz to the GPU core, and +175MHz to the memory.
3DMark and Games Testing
This isn't a big overclock by any stretch of the imagination – RX 590 really seems to have been pushed about as far as it can go already. Still, we saw some minor improvements to our Fire Strike score, an about an extra 3FPS when gaming at 1080p, so it's certainly something – but not much.Here, we take a further look at the impact of our overclock, looking at the increased temperatures, acoustics, power draw, and lastly, the effect had on the average clock speed.
Temperatures
Acoustics
Power consumption
Average clock speed under load
Overview
Using the performance BIOS with our overclock (to ensure thermals did not adversely affect our results) we can see that the GPU core only rose by 1C when stressed with the overclock applied, which is not bad – although we do have to remember, the frequency really did increase that much. That being said, noise levels did jump up considerably to over 52dB making this one of the loudest cards we have tested.
Power did jump up as well to 237W, which isn't much of an increase, and in terms of clock speed the 1615MHz boost we dialled in (1580+35) did hold steady throughout testing. Even then, I don't think the small gains are worth the extra noise – RX 590 seems to have been pushed as far as it will go.Having already analysed the Sapphire RX 590 Nitro+ SE for launch day, today we have been assessing the XFX RX 590 Fatboy.
The thing that strikes me most is just how basic a card this is. Performance aside, you really don't get any bells or whistles – it looks pretty plain, doesn't feel especially premium and doesn't offer anything we've not seen before.
To my mind, that says XFX is clearly just trying to bring an aftermarket RX 590 to the market for as little money as possible, and in fairness it is one of the cheapest models I have come across at £250.
It performs fine, too. RX 590 is definitely best suited to 1080p gaming, and we saw this card average over 60FPS across every title we tested. 1440p gaming is certainly possible, but you will notice dips into the 40FPS zone depending on the title.
The thing I am not too sure about, though, is the choice of BIOS. Each will run the clock speed at 1580MHz, so they perform essentially identically in game. The performance BIOS, however, cranks the fans up quite loud, while the stealth BIOS drops the fan speeds but increases GPU temperatures to 80C – so it really becomes a choice of ‘loud and cool' or ‘quiet and hot'.
Sapphire strikes a much better balance with its RX 590. It is essentially just as loud as the XFX Fatboy using the stealth BIOS, but still only peaks at 72C on the GPU core, offering low noise levels and low temperatures, something the Fatboy cannot do.
And for me, for just £10 extra, that is worth paying for. The XFX RX 590 Fatboy is a decent card that will run the latest titles very well at 1080p, but considering the Sapphire card is hardly any more expensive, it does seem like a more refined overall package.
You can buy the XFX RX 590 Fatboy for £249.99 HERE.
Pros
- Performs as expected for an RX 590.
- One of the cheaper cards.
- Should fit in most cases, despite the ‘Fatboy' name.
Cons
- Dual-BIOS options seem to be ‘either or'.
- Looks and feels very plain.
- Sapphire's RX 590 is just £10 more.
KitGuru says: It's not a bad card at all, and if you can find it on sale you will get very solid 1080p performance from the Fatboy. I just feel that if you're spending £250 for this, you may as well spend an extra £10 and get a better overall package in the shape of the Sapphire RX 590 Nitro+ SE.